Hello Fellow ChartWatchers!
This week's edition of ChartWatchers is full of important information including a lively debate about the health of the market - Tom Bowley is actually optimistic (well... somewhat), Arthur Hill not so much. But first, I have several items that are super important for our members:
BAD NEWS: WE'RE GOING TO RAISE OUR PRICES BY US$5 PER MONTH
Behind the scenes here at StockCharts, the sad fact is that the data vendors have been continually increasing the price they charge for their data. We have been protecting our subscribers from those price increases for as long as we can. In fact, we have NEVER raised prices going all the way back to when we started the website back in 1999. (How many other things do you know of that are the same price as they were back then?) This is a first for us and we are not happy about it.
Starting August 1, 2008, the price of all of our services will go up by US$5 per month. One month of Basic will be US$14.95, one month of Extra will be $24.95, and one month of ExtraRT will be US$34.90. Longer term subscriptions will also be going up at the fixed rate of US$5 per month.
We know that with the price of gas putting the squeeze on everyone these days the timing of this increase couldn't be worse, but we hope that everyone will consider the fact that we've keep prices as low as we could for as long as we could when considering renewing. Oh, and by the way...
GOOD NEWS: YOU CAN AVOID THE PRICE INCREASE BY RENEWING IN JULY!
Notice how I said "Starting August 1, 2008" above? That means that you can avoid (or at least significantly delay) the price increase by adding a long-term renewal to your subscription during the month of July. Even if you renewed recently, you can re-renew and we will simply add more time to your expiration date. By renewing now, YOU can determine when the price increase will actually start to affect you. Oh, and by the way...
GREAT NEWS: THE SUMMER SPECIAL IS NOW ON!!!
Just like in the past, we are running a special during the month of July: If you renew for 6 months, we'll give you 1 month free. If you renew for 12 months, we'll give you 2 months free. This is the best deal on our prices and, with the looming price increase in August, this is the last time you'll have a chance to get this deal ever.
So...
My strong advice to current members is to renew your account today for 12 months. You'll get 2 additional months for free AND you won't have to pay our increased prices until at least November of 2009. Seems like a no-brainer to me.
If you aren't a member but are thinking of joining, now is really the time. If you delay until August, it will cost you - it's just that simple.
To get started, simply click this link and follow the instructions.
Again, we're just as unhappy as everyone else about rising prices and we will continue to do our best to make sure you get the most value for your money here at StockCharts.
- Chip
SECTOR ROTATION SAYS BEARISHby John Murphy | The Market Message
SECTOR ROTATION MODEL... One of our readers asked where we are in the Sector Rotation Model. That model shows the normal sector rotation that takes place at various stages in the business cycle. The chart shows that basic materials and energy are market leaders at a market peak. As the economy starts to slow, money starts to rotate out of those two inflation-sensitive groups. Basic materials peak first and energy last. This week's downturn in basic material stocks suggests that the topping process is moving even further along. Energy may be the next to roll over. As the economy slows, money flows into consumer staples, healthcare services, and utilities. That's where we appear to be right now. One way we can tell that a bottom is near is when money starts to flow into financial and consumer discretionary stocks. So far, there's no sign of that happening. That leaves us in the midst of a bear market with money flowing toward staples, healthcare, and utilities.
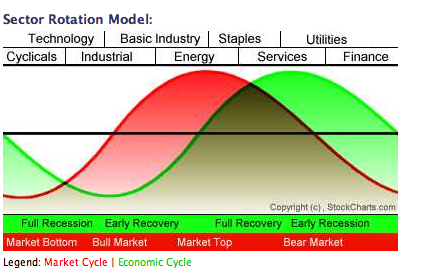
STOCKS LEAD THE ECONOMY... Everytime I show the Sector Rotation Model, I feel the need to point out that the stock market (red line) peaks well before the economy (green line). Although most of us are aware that the stock market is a leading indicator of the economy, that point keeps getting lost on Wall Street and the media. Ever since the market peaked last fall, the media has presented a parade of economists arguing that the economy was still on sound footing. I remember seeing a headline "fear versus fundamentals" back in January (that was repeated again this week on CNBC). The implication being that the market was falling on "fear" instead of "fundamentals". With the stock market having had one of the worst first halfs in decades, we're now starting to get confirmation that the economy is in bad shape. It's a little late for that to do anybody any good. That's why we study the market and pretty much ignore the media, economists, and Wall Street suits.
NOTE: John will be on vacation next week.
BEAR MARKET EXPANDS!by Arthur Hill | Art's Charts
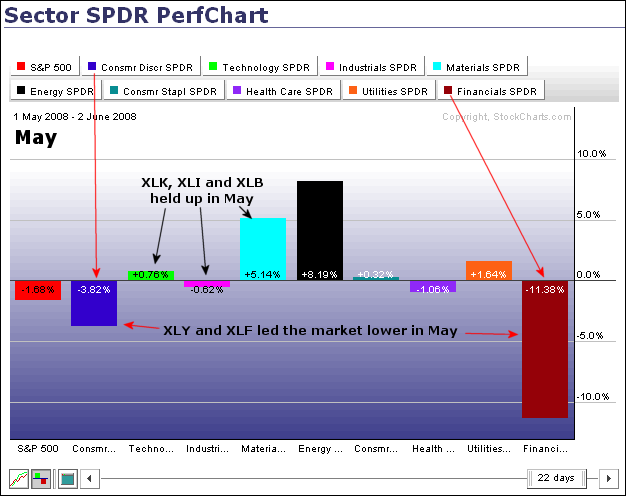
Sector performance in May and June shows the bear extending its grip into
other key sectors. The Financials SPDR (XLF) and the Consumer Discretionary
SPDR (XLY) woke up the bear with dismal performances in May. The first
PerfChart shows sector performance from 1-May until 2-June, which is
basically the month of May. XLF and XLY led the way lower in May. Notice
that the Industrials SPDR (XLI), Materials SPDR (XLB) and Technology SPDR
(XLK) held up relatively well in May. In fact, selling pressure in May was
pretty much limited to the financial and consumer discretionary sectors.
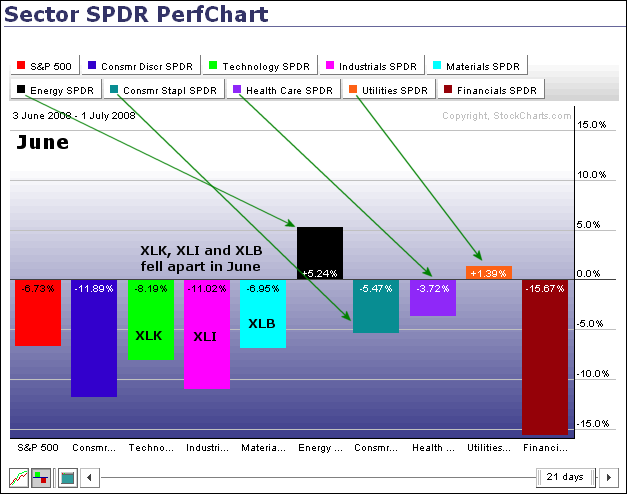
The second PerfChart shows sector performance from 3-June to 1-July, which
is basically the month of June. There are two items worth noting here.
First, the Technology SPDR, Industrials SPDR and Materials SPDR declined
rather sharply in June. These three held up in May, but fell apart in June
as selling pressure expanded among the sectors. Second, the Utilities SPDR
(XLU), Consumer Staples SPDR (XLP) and Healthcare SPDR (XLV) held up the
best in June. Well, outside of the Energy SPDR (XLE) that is.
Utilities, healthcare and consumer staples represent the defensive sectors.
No matter what happens in the economy, we still need electricity (XLU),
toothpaste (XLP) and medicine (XLV). While the S&P 500 moved lower in May
and June, XLU edged higher both months and showed relative strength. XLV and
XLP are down over the last two months, but less than the S&P 500 and this
shows less weakness, which can also be interpreted as relative strength.
Fund managers that are required to be fully-invested in stocks are no doubt
watching these relative performance numbers and looking for the sectors that
are holding up the best.
VERY DANGEROUS MARKETby Carl Swenlin | DecisionPoint.com
A bullish take on the stock market would be that (1) market indicators are very oversold, (2) there is a triple bottom setup on the S&P 100 Index, and (3) sentiment polls show a lot of bearishness. I agree that those conditions exist, but we are in a bear market and these conditions can easily see price movement transition into a crash. The reason, as I have said many times before, is that bullish setups don't always work so well in bear markets, and an oversold market can very quickly become significantly more oversold.
Let me be clear, I am not predicting a crash. If the market does crash, I will not claim to have "called" it, because that is not what I am trying to do. I want my readers to be aware of the danger and not try to pick the exact bottom of this decline. That bottom could be very far away.
Our first chart contains three indicators (one each for price, breadth, and volume), and you can see that they are all very oversold. You can also see the triple bottom setup. This oversold condition is repeated on most of our other indicator charts.
The next chart looks more closely at how prices have been behaving in response to short-term oversold conditions. Note how during the recent decline that oversold indicator readings have not resulted in anything but tiny advances that were quickly followed by continued price declines. This is typical bear market behavior, and it implies that medium-term oversold readings may be just as soft.
Our final chart gives us a view of just how much complacency exists, in spite of widely negative sentiment readings. The Volatility Index (VIX) is derived from prices on near-term SPX put and call options. Higher readings reflect a high level of fear among options traders, and lower readings complacency. Note the upside spikes on the VIX at the January and March lows. Now note how the VIX is currently about mid-range, even though prices are making new lows. This shows a surprising lack of fear, considering what prices are doing. (Thanks to Ike Iossif for bringing this to my attention.)
Bottom Line: We are in a bear market, and it is suicide to try to take positions anticipating the next rally merely on the evidence that the market is very oversold. Conditions are such that a sharp decline could materialize at any moment. This is not a prediction -- I don't suggest placing bets on it -- just something that traders should consider. Bear markets are dangerous. Wait for solid evidence that a rally has begun before sticking your neck out.
We rely on the mechanical trend models to determine our market posture. Below is a recent snapshot of our primary trend-following timing model status for the major indexes and sectors we track. Note that we have included the nine Rydex Equal Weight ETF versions of the S&P Spider Sectors. This may seem redundant, but the equal weighted indexes most often do not perform the same as their cap-weighted counterparts, and they provide a way to diversify exposure.

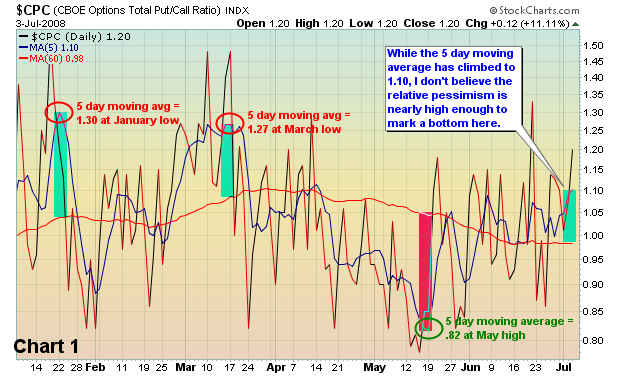
I'm the conservative type. I'm also nervous. I never like to see the market fall precipitously while market participants yawn. In a nutshell, that's what we've been seeing. Yes, the talking heads will say the sky is falling, but unfortunately for bulls, that's not the case amongst those actually trading the market. I've provided in previous articles how the put call ratio correlates to market tops and bottoms. I won't go into the details again. However, everyone needs to understand that market participants are not panicking yet. That is a very big clue to me that we've got more work to the downside before we can declare a bottom. It doesn't mean we can't bounce and I'll provide an argument below that suggests a near-term bounce is imminent. But it will likely be just that - a bounce.
First, let's talk sentiment. Thursday, the put call ratio printed a closing reading of 1.21. Finally! It was the 3rd highest end of day reading since the mid-March lows. That's the good news. The bad news is that one day of negative sentiment doesn't mark a bottom. Below is a favorite chart of mine, measuring the 5 day moving average of the put call ratio against the 60 day moving average. It simply plots the short-term pessimism against the longer-term pessimism, and provides us with a measure of relative pessimism. I like to see the short-term 20%-30% higher to begin to mark bottoms (and 20%-30% lower to mark tops). From Chart 1, you'll see we're simply not there yet so strap on your helmets and buckle your seatbelts.
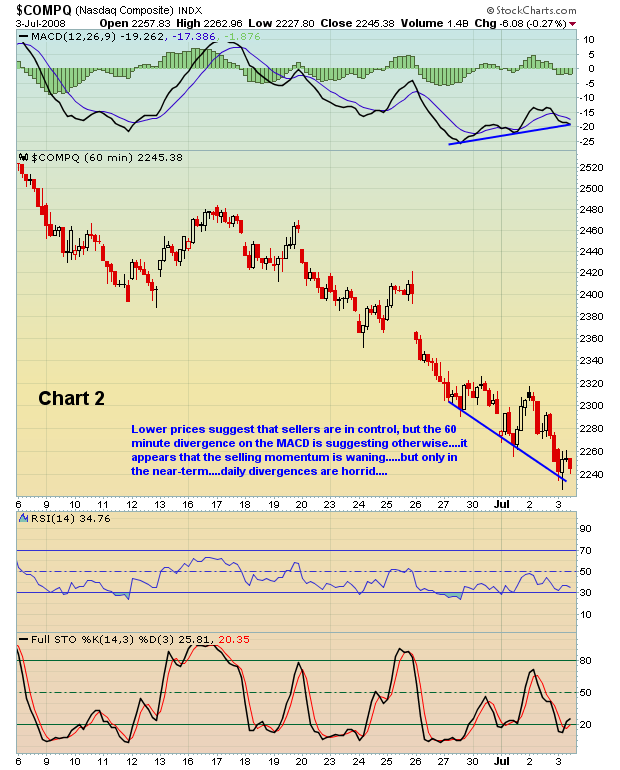
We could continue lower, the pessimism could build, and a significant bottom could form in the near-term. Given the severely oversold conditions though, I expect to see a bounce first and that will likely return the 5 day put call ratio down closer to the 60 day moving average, possibly even below the 60 day. Furthering my belief of a short-term bounce is the positive divergence that has printed on the 60 minute charts. The major indices have put in new lows the last 3 days, and with each new low has come a higher MACD reading on the 60 minute chart. Take a look at the NASDAQ below in Chart 2.
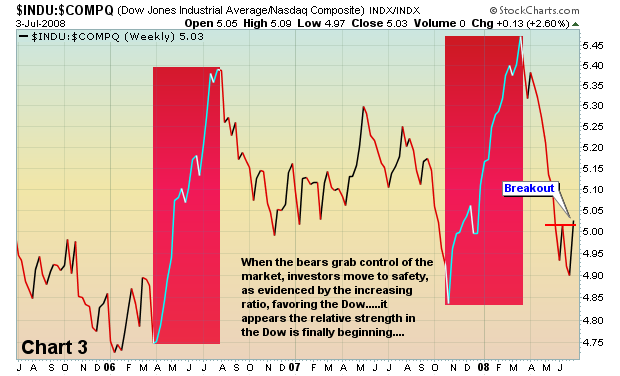
I'll leave you with one more chart to ponder. Normally when the market sells off, the Dow outperforms the NASDAQ. That makes perfect sense as investors flock to high quality, "safer" investments. From Chart 3 below, you can see that the ratio between the Dow and the NASDAQ moved much higher during the summer of 2006 and again in fall of 2007 into the first quarter of 2008 as the market sold off hard. Any time this ratio moves up, it indicates relative outperformance by the Dow. A declining ratio suggests relative outperformance by the NASDAQ. Here's the interesting part: Since the May 19th top, this ratio has actually declined. We just suffered through the worst June in several decades, yet the money did not gravitate towards the Dow - interesting indeed. Is this a short-term phenomenon that will rectify itself in due time? I say yes. I've highlighted the recent move up in the ratio and believe that the move above the recent high is technically significant.
We'll find out in time. In the meantime....
Happy trading!


