Art's Charts October 30, 2009 at 08:46 AM
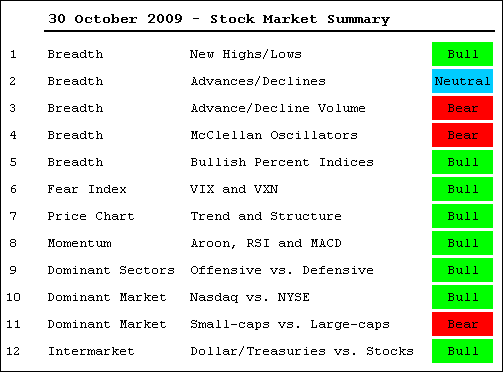
-Breadth chart page updated -Short-Term SPY analysis in separate post below -Medium-term evidence remains bullish, but...... Read More
Art's Charts October 30, 2009 at 05:35 AM
The breadth chart page has been updated. There have been some changes with the sharp decline over the last two weeks. Highlights include: -The Nasdaq AD Line broke below its early October low. -Daily Net New Highs for the Nasdaq turned negative... Read More
Art's Charts October 30, 2009 at 04:58 AM
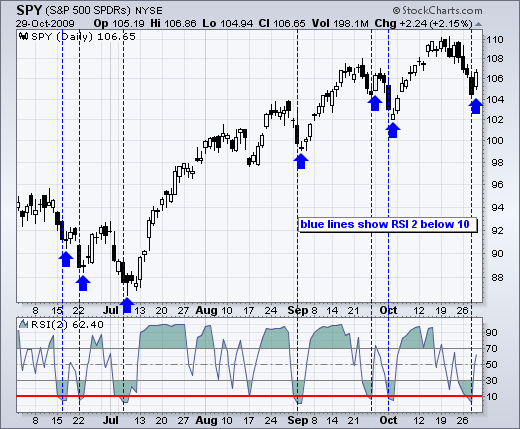
After a 5% decline from the October high, the S&P 500 ETF (SPY) surged back above 106 on Thursday. Is this just a dead-cat bounce or should we expect more strength? Technically, the medium-term trend is still up... Read More
Art's Charts October 29, 2009 at 08:36 AM
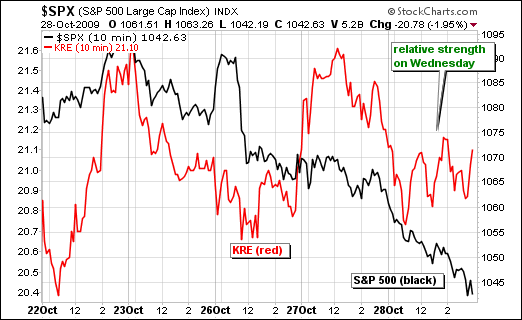
I was quite impressed with the ability of the Regional Bank SPDR (KRE) to firm over the last few days. The S&P 500 is down around 4.5% in four days and KRE is down only 2.3%. The first chart shows KRE and the S&P 500 over the last five days... Read More
Art's Charts October 29, 2009 at 04:46 AM
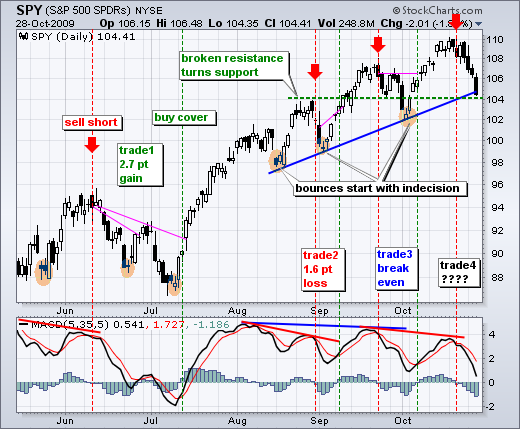
The S&P 500 ETF (SPY) is now down over 5% in the last seven days. With the medium-term trend still technically up and the ETF oversold, traders should be on guard for a bounce or consolidation. Bouncing usually begin with indecision... Read More
Art's Charts October 28, 2009 at 11:00 AM
Should the S&P 500 ETF (SPY) continue weak and close lower again today, it would mark the sixth lower close in the last eight days. Late September-early October was the last such occasion. With the ETF down around 4% from its highs, it is already getting short-term oversold... Read More
Art's Charts October 27, 2009 at 07:40 AM
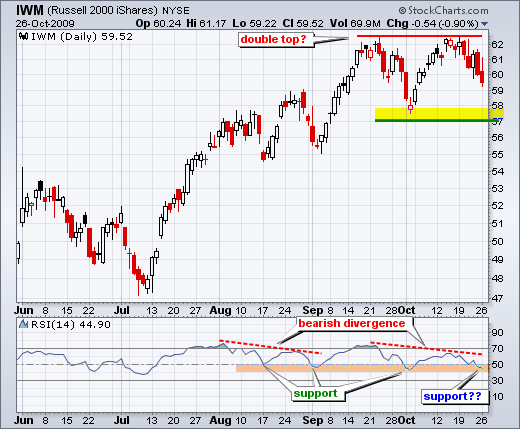
-Intermarket chart page updated (here) -Short-Term SPY analysis in separate post below -Small-caps show relative weakness -Regional Banks hold support -Healthcare Providers ETF breaks support -Cigna shows relative weakness -Semiconductors HOLDRS pullback after higher high -Intel ... Read More
Art's Charts October 27, 2009 at 05:49 AM
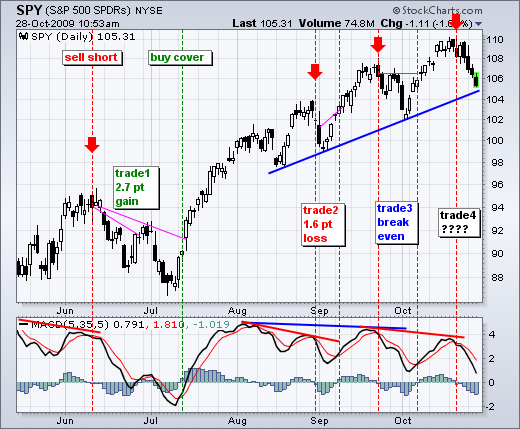
After a big surge in July, the S&P 500 ETF (SPY) has been zigzagging higher since early August. Consider the zigs as advances and the zags as declines. Each advance (zag) forges a higher high, while each decline (zig) reverses above its prior low... Read More
Art's Charts October 27, 2009 at 05:05 AM
Intermarket chart highlights include: -Bonds plunge as Dollar bounces -Dollar breaks short-term resistance as RSI approaches 50 -Gold breaks pennant/triangle support -Oil declines as Dollar bounces -Bonds test important support zone Click here for the intermarket chart page... Read More
Art's Charts October 27, 2009 at 01:43 AM
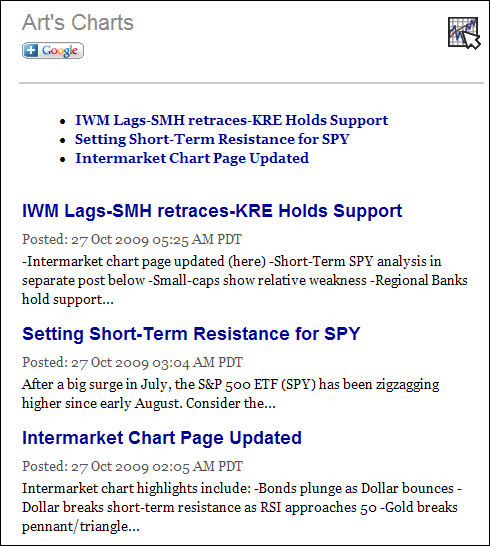
The image below shows the email alert for, Tuesday, October 27th. Each email contains the titles and the opening sentences for the day's blog entries. Alerts are sent out once per day around 12PM ET... Read More
Art's Charts October 26, 2009 at 10:50 AM
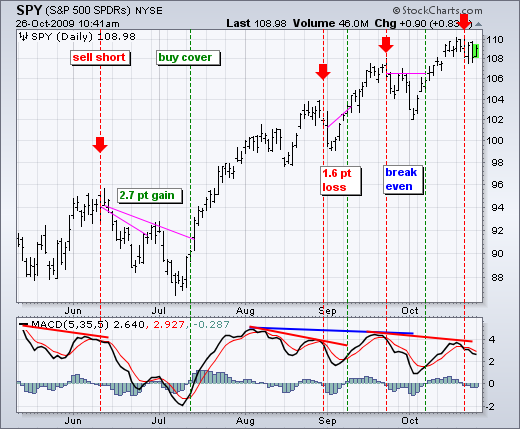
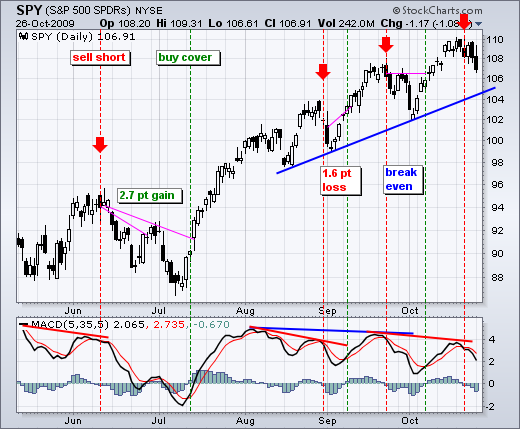
This is just a quick update on the short-term trend for SPY and last week's MACD signal. On the daily chart, MACD(5,35,5) formed a bearish divergence and moved below its signal line last Wednesday for a bearish signal... Read More
Art's Charts October 23, 2009 at 07:31 AM
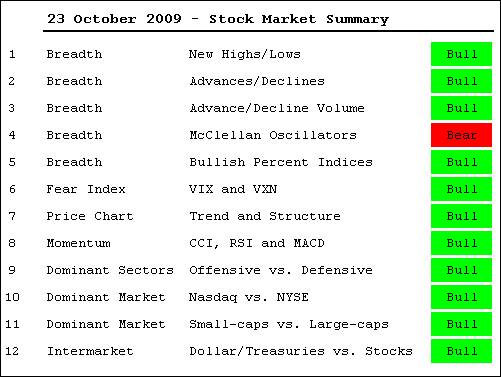
-Bulk of the evidence remains bullish -Weak upside breadth on Monday and Thursday -SPY and IWM reverse short-term uptrends -A MACD(5,35,5) signal for SPY -SPY remains in Wave 4 target zone -NYSE AD Volume Line does not confirm -Nasdaq AD Line fails to exceed September high -Dolla... Read More
Art's Charts October 21, 2009 at 05:53 AM
-Stocks and the Dollar remain inversely correlated. -Short-term interest rates are edging higher and this could lift the Dollar. -Gold remains at high levels as the breakouts hold. -Broken resistance turns into support for oil. -Bonds bounced off a key support zone... Read More
Art's Charts October 20, 2009 at 07:29 AM
-Bulk of the evidence remains bullish -IWM leads the pack -SPY extends short-term uptrend -Past MACD divergences in SPY -MACD diverges for QQQQ -Autozone (AZO) firms at support -Oracle (ORCL) recovers after sharp decline -Qualcom (QCOM) bounces after hammer -Comcast (CMCSA) firms... Read More
Art's Charts October 16, 2009 at 07:48 AM
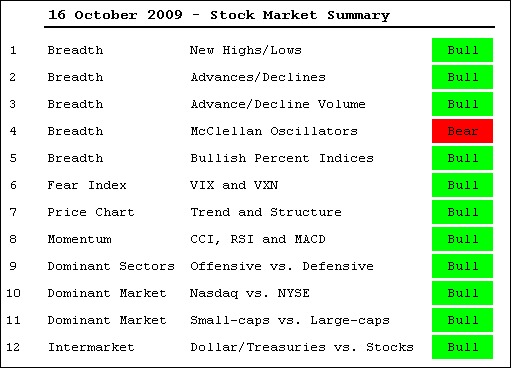
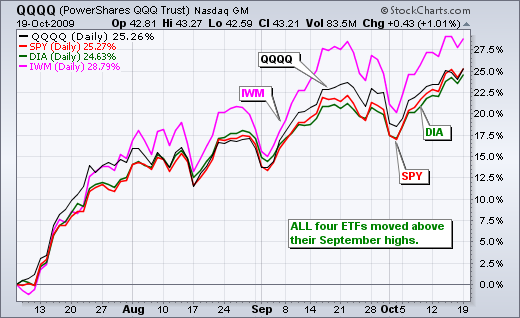
-Bulk of the evidence remains bullish -SPY surges to new highs in October -S&P 500 enters retracement zone on weekly chart -NYSE AD Line hits new high -VIX moves to new low -MACD stays bullish despite divergences -Russell 2000 and S&P 100 exceed September highs -Bullish percent i... Read More
Art's Charts October 13, 2009 at 07:36 AM
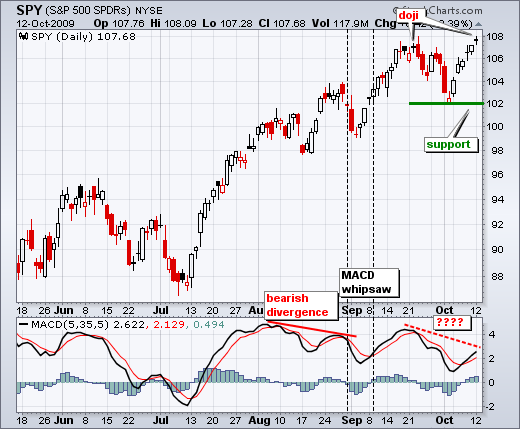
-SPY forms doji near September highs -Short-term uptrend remains in place for SPY -Treasury yields surge over the last two days -Dollar ETF forms doji near September lows -Homebuilders SPDR bounces off support -Regional Bank SPDR breaks channel resistance -Transport iShares hits ... Read More
Art's Charts October 09, 2009 at 07:21 AM
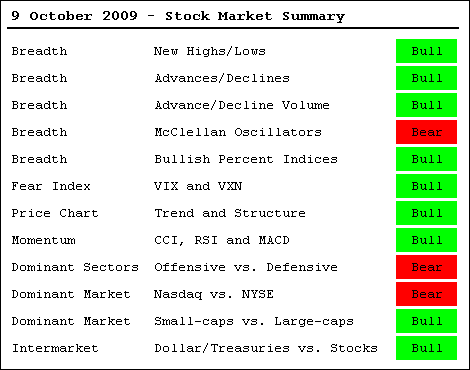
-Medium-term evidence remains bullish for stocks -SPY turns indecisive after sharp advance -Using CCI for short-term signals in SPY -Another bottom picking opp in the Dollar -Oil advances to channel resistance -Gold becomes overbought as GLD assets surge -Bonds feel the heat of r... Read More
Art's Charts October 06, 2009 at 07:24 AM
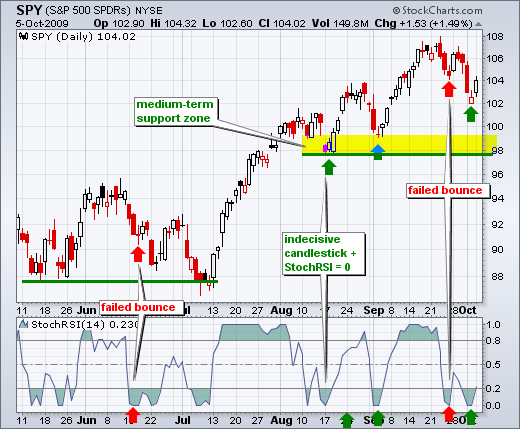
-Attempting a short-term low -Setting short-term support for SPY -Low Volume the last two Mondays -Finance Sector Leads -Regional Banks Lag -Gold Miners ETF bounces off support -AMAT forms hammer at support -BG firms near key retracement -CPWR forms bullish engulfing at support -... Read More
Art's Charts October 02, 2009 at 07:45 AM
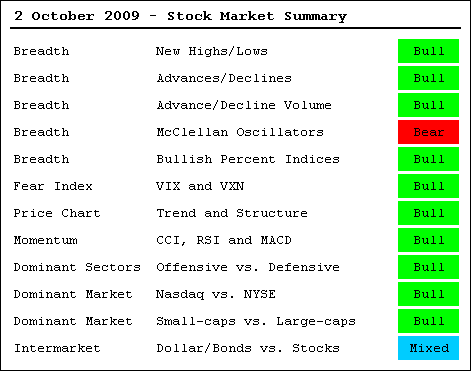
-Medium-term evidence remains bullish -Wave 4 Hits the 50% Retracement -Key Supports for SPY, QQQQ and IWM -SPY is Already Short-term Oversold -Volatility Indices Surge to Resistance -Momentum Indicators Remain Bullish Overall -McClellan Oscillators Turn Bearish -Stocks and Bonds... Read More