Art's Charts June 30, 2010 at 03:43 AM
At this point the medium-term trends (daily charts) are clearly in bear mode (downtrends). However, the major index ETFs are short-term oversold after sharp declines. In addition, many are trading near potential support from their May lows. "Potential" is the key word here... Read More
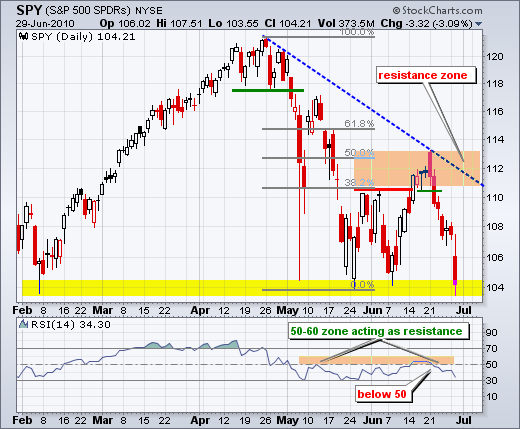
Art's Charts June 29, 2010 at 03:41 AM
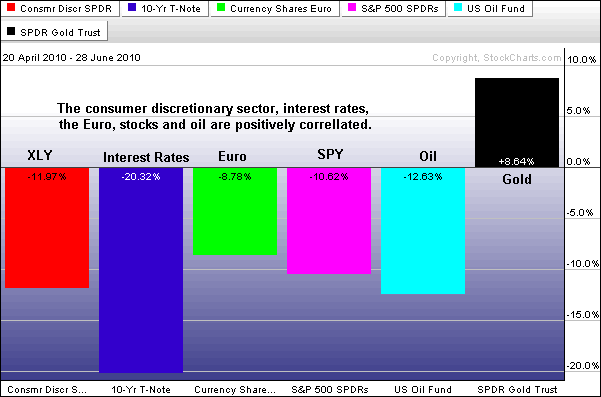
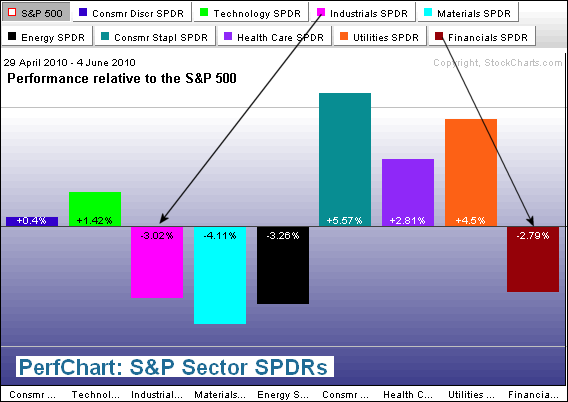
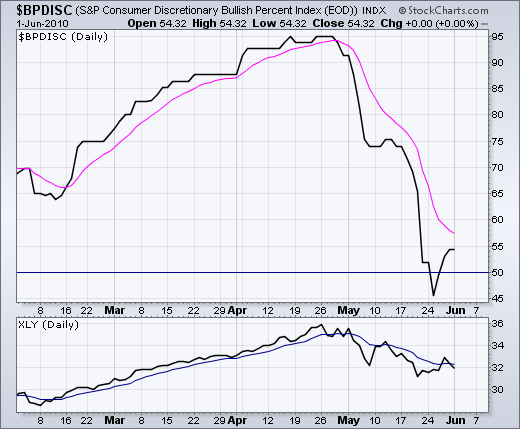
The demise of the consumer discretionary remains the most important event of the last few weeks. The Consumer Discretionary SPDR (XLY) was holding up fine in May, but came down hard in June and is the weakest of the eight sectors this month... Read More
Art's Charts June 28, 2010 at 04:08 AM
After a four day decline, SPY formed a big spinning top to establish a potential support zone around 107-108. These candlesticks have small bodies and long upper/lower shadows. The small bodies reflect little change from open to close... Read More
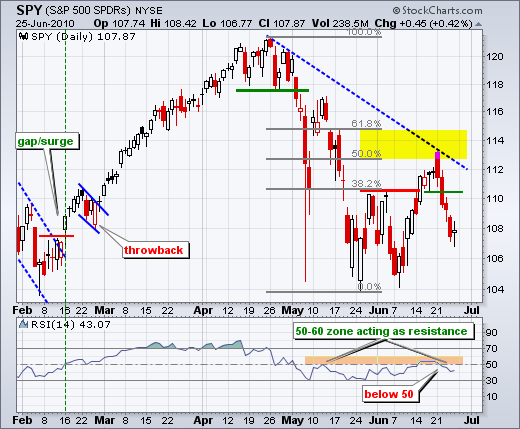
Art's Charts June 25, 2010 at 05:11 AM
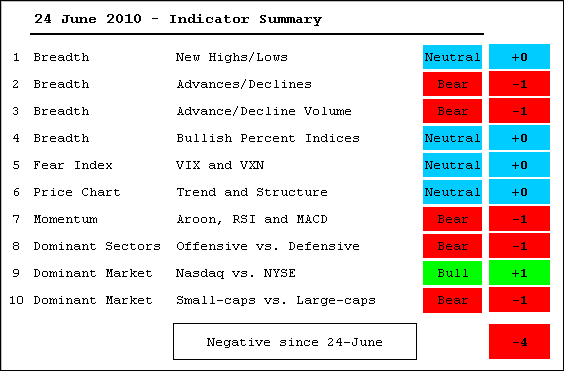
There have been three changes in the last three weeks. The summary turned negative on 11-June, positive on 18-June and negative again on 24-June. Interpretation of these indicators is somewhat subjective... Read More
Art's Charts June 25, 2010 at 04:21 AM
The daily chart is looking rather ugly. It all started with Monday's reversal day near the 50% retracement. Selling pressure continued on Tuesday with a move below the resistance breakout... Read More
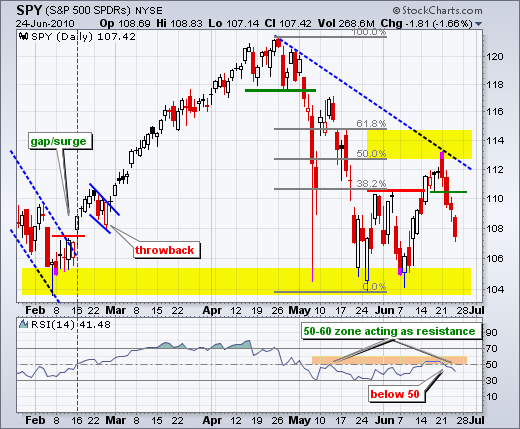
Art's Charts June 24, 2010 at 03:58 AM
On the daily chart, SPY failed to hold the breakout at 110.5 and remains below support from broken resistance. Is this just a pullback or the start of a bigger decline? Ideally, a pullback should be a little tamer... Read More
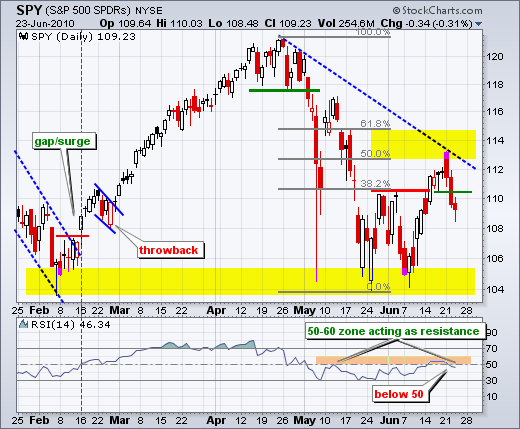
Art's Charts June 23, 2010 at 04:05 AM
Stocks took it on the chin Tuesday with big losses in the major index ETFs. The Russell 2000 ETF (IWM) and S&P 400 MidCap ETF (MDY) led the way lower with losses greater than 2%... Read More
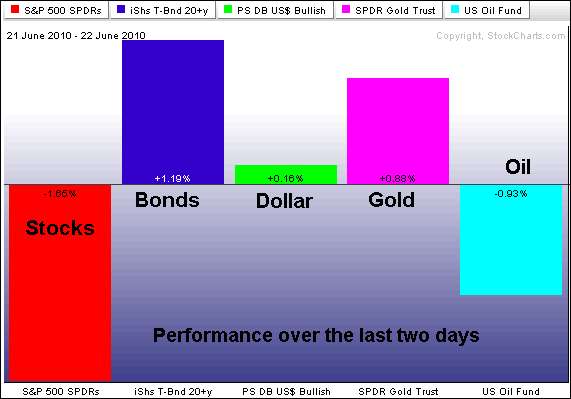
Art's Charts June 22, 2010 at 04:13 AM
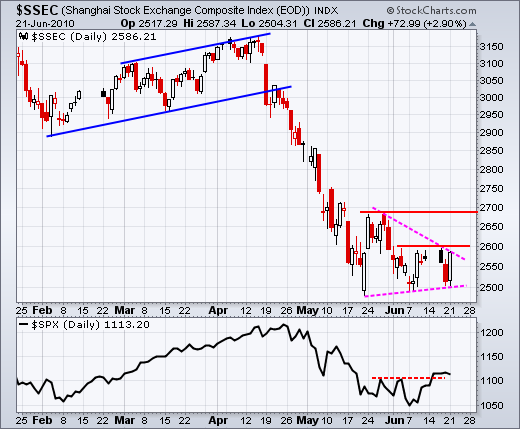
It was a pretty crazy day on Wall Street - and in the rest of the markets. Stocks surged in early trading on news that China would allow the Yuan to strengthen for the first time since July 2005. Obviously, China is not in any hurry to let its currency rise... Read More
Art's Charts June 21, 2010 at 04:07 AM
Stocks held their ground on Friday and most major indices ended with small gains, very small gains. Sectors were mixed with three down, five up and one unchanged (tech)... Read More
Art's Charts June 18, 2010 at 05:09 AM
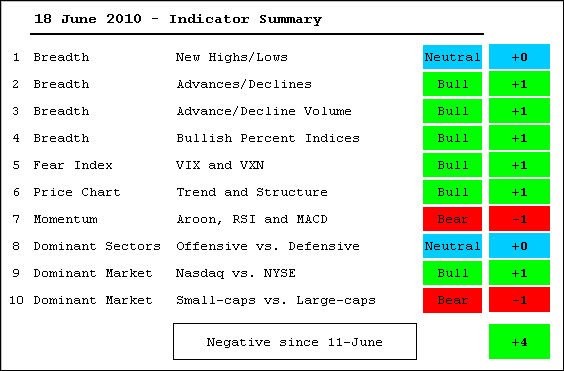
After one week in negative territory, the indicator summary flipped back into positive territory on Friday, 18-June... Read More
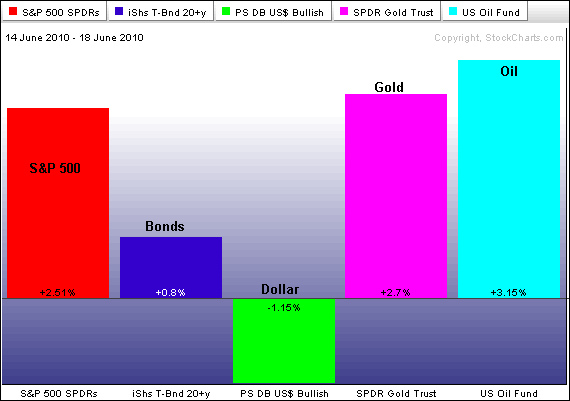
Art's Charts June 18, 2010 at 04:42 AM
Stocks traded mixed most of the day, but a late rally pushed the S&P 500, Nasdaq and Dow into positive territory for the close. The final gain was small though. In addition, the Russell 2000 and S&P 600 SmallCap Index both finished with small losses... Read More
Art's Charts June 17, 2010 at 04:50 AM
After a big advance the prior six days, trading turned mixed as the market consolidated its gains. Over the last seven days, IWM is up 7.74%, MDY is up 7.2%, QQQQ is up 6.13%, SPY is up 5.01% and DIA is up 4.88%... Read More
Art's Charts June 16, 2010 at 04:08 AM
Stocks surged on Tuesday with the major index ETFs gaining over 2%. The gains were rather uniform with a range from 2.27% in the S&P 100 to 2.82% in the Nasdaq 100... Read More
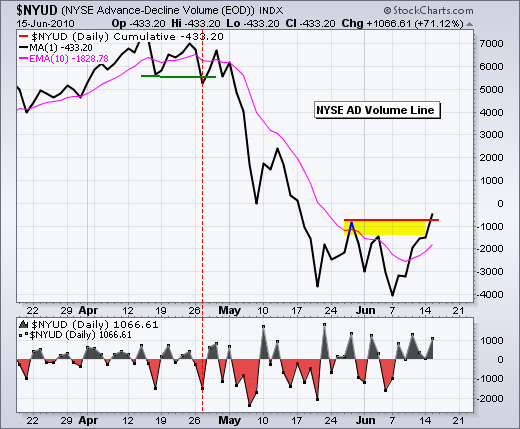
Art's Charts June 15, 2010 at 04:23 AM

Trading turned mixed as the Dow and S&P 500 tested important resistance levels. The S&P 500 and Nasdaq finished with small gains, but the Dow and Nasdaq 100 finished with small losses... Read More
Art's Charts June 14, 2010 at 04:16 AM
The surge over the last two days did not occur on the strongest breadth or volume, but support from the February low held and the bigger uptrend remains in place. As long as the bigger trend is up, the odds favor the bulls as SPY surges off support... Read More
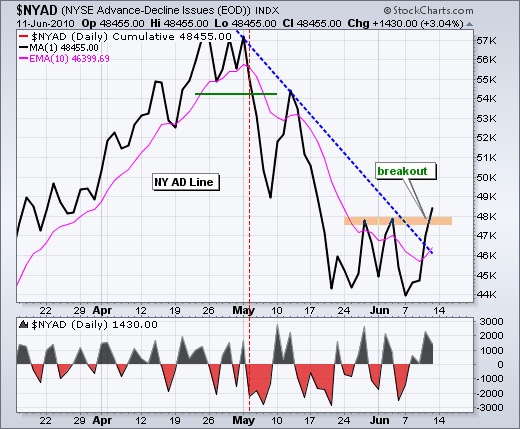
Art's Charts June 11, 2010 at 04:54 AM
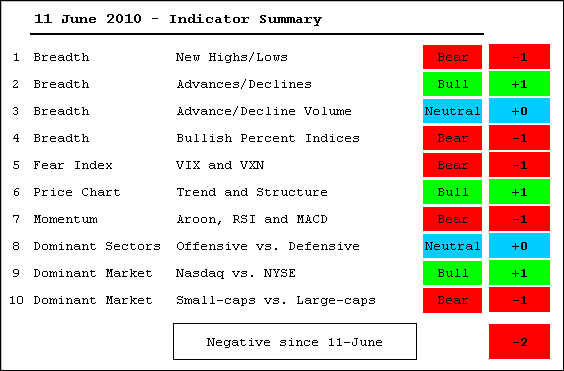
Small-caps broke down this week and the Bullish Percent Index indicator turned bearish. These two were enough to turn the indicator summary negative for the first time since March 5th. Techs were also hit hard this week, but the $COMPQ:$NYA ratio remains in an uptrend... Read More
Art's Charts June 11, 2010 at 03:35 AM
Stocks surged with a broad rally that lifted most boats. All major indices were up 3% or so. The Russell 2000 (+3.48%) slightly outperformed the S&P 500 (+2.95%). The Russell 2000 should have been up 5% on a day like today (damper number 1)... Read More
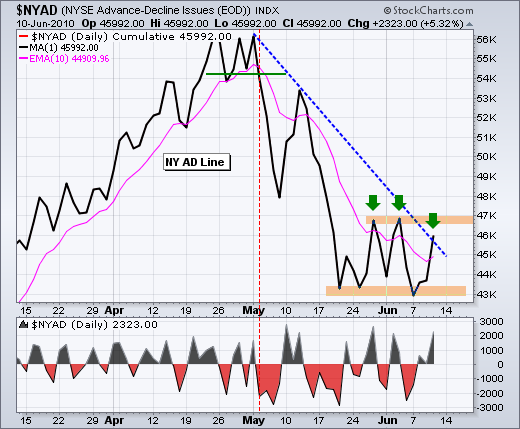
Art's Charts June 10, 2010 at 04:00 AM
Stocks surged in early trading with SPY moving above 108 in the morning, but gave back these gains, and more, with an afternoon plunge. There it is again: another late round of selling pressure... Read More
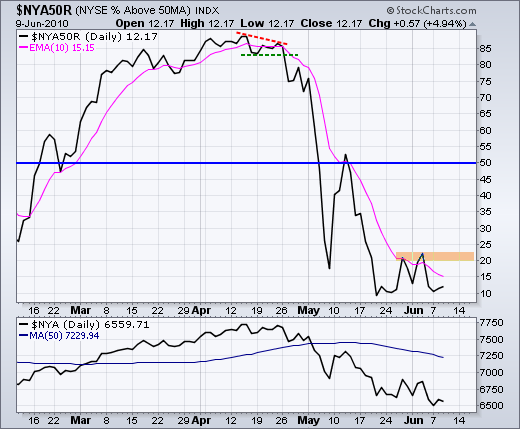
Art's Charts June 09, 2010 at 04:55 AM
The stock market rebounded on Tuesday, but the bounce was rather lopsided as techs lagged significantly. The S&P 500 and the Dow gained over 1%, but the Nasdaq and Russell 2000 finished slightly negative... Read More
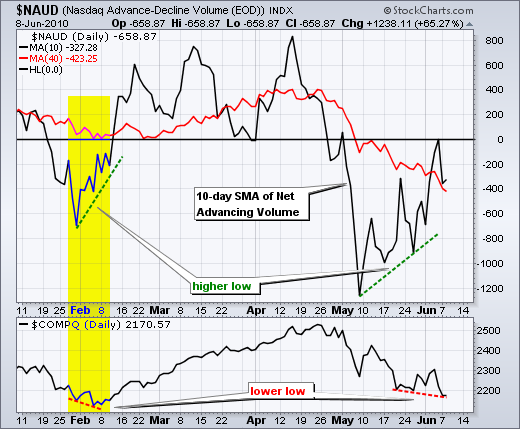
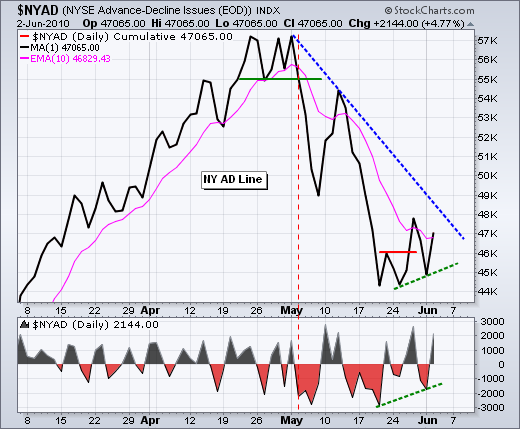
Art's Charts June 08, 2010 at 04:18 AM
It was another day of heavy selling pressure, but not as heavy as Friday. The AD Lines and AD Volume Lines for the Nasdaq and NYSE all moved to new lows for the move. Even with these new lows, selling pressure is less than it was in May... Read More
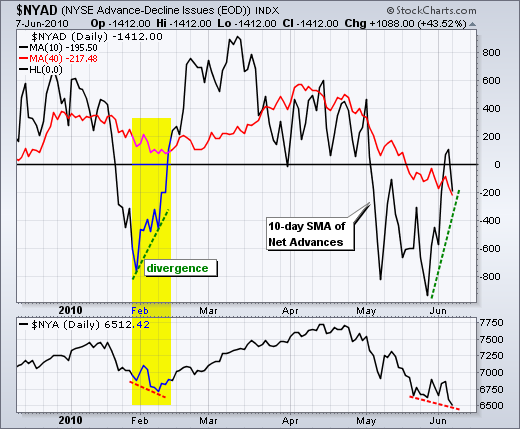
Art's Charts June 07, 2010 at 05:23 AM
Stocks were hit hard on Friday with the major indices losing 3-5%. The Dow held up the best with a 3.15% loss, while the Russell 2000 fared the worst with a 5% loss. Stocks started with a sharp gap down and continued lower throughout the day... Read More
Art's Charts June 04, 2010 at 05:55 AM
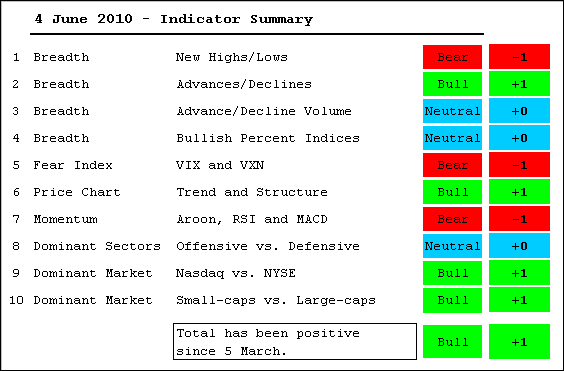
There is no real change in the indicator summary. The market remains split with some bearish indicators and some bullish indications. This is normal after a severe correction that tests the viability of the long-term bull market (March 2009 to present)... Read More
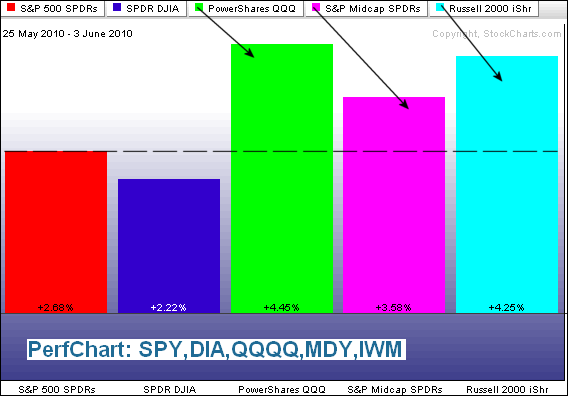
Art's Charts June 04, 2010 at 04:21 AM
Even though the Dow gained just .06% and the S&P 500 was up .46%, the Nasdaq gained .96% and the Russell 2000 was up 1.05%. Techs and small-caps doubled the gains seen in the large-cap dominated S&P 500... Read More
Art's Charts June 03, 2010 at 04:33 AM
After declining on Friday and Tuesday, stocks rallied throughout the day on Wednesday. This is especially impressive when we consider that European stocks were down sharply and the Euro was getting hit on Wednesday morning... Read More
Art's Charts June 02, 2010 at 04:54 AM
Weakness in Asia and Europe led to a weak open on Wall Street, but stocks managed to firm in the first hour and tech stocks led a morning rebound. These gains were holding in the early afternoon, but selling pressure in the final hour pushed stocks sharply lower... Read More
Art's Charts June 01, 2010 at 04:44 AM
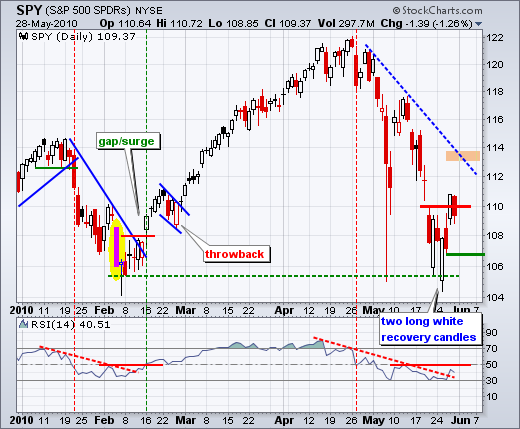
Last week's reversal and breakout at 110 were positive, but the five week trend remains down. Participants got cold feet on Friday as SPY moved back below 110 by the close. Nevertheless the ETF is holding the majority of last Thursday's gains. A move below 106... Read More