Art's Charts February 28, 2011 at 04:14 AM
On the 60-minute chart, the S&P 500 ETF (SPY) firmed at support around 130 mid-week and bounced back above 132 on Friday. The 62% retracement and broken resistance marked this support zone... Read More
Art's Charts February 25, 2011 at 05:41 AM
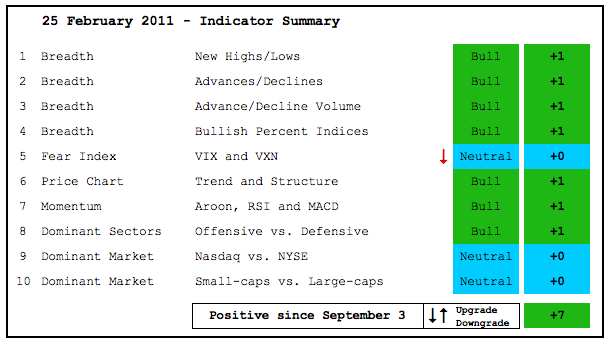
Despite a sharp decline in stocks this week, the indicator summary remains firmly positive. Don't forget that the major index ETFs, most sector SPDRs, the AD Lines and the AD Volume Lines all recorded new 52-week highs just last week... Read More
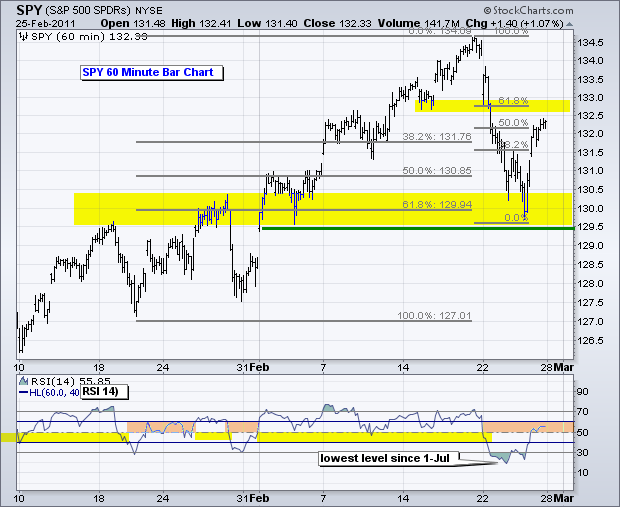
Art's Charts February 25, 2011 at 03:58 AM
On the 60-minute chart, SPY continues to firm at support around 130. This support zone stems from broken resistance levels and a 62% retracement of the advance from the late January lows to the mid February highs... Read More
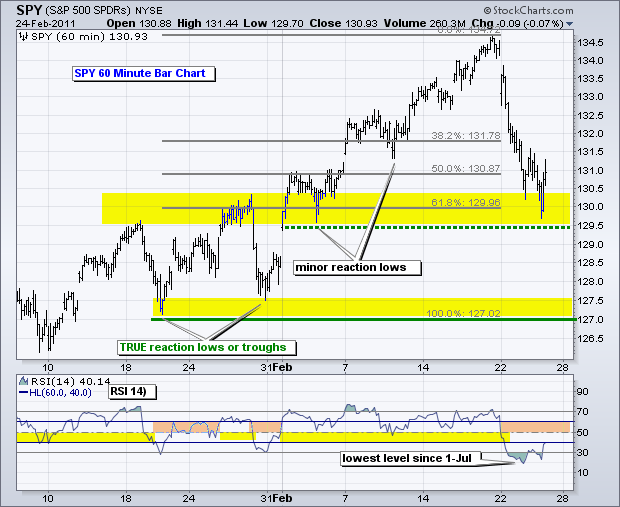
Art's Charts February 24, 2011 at 04:36 AM
On the 60-minute chart, the S&P 500 ETF (SPY) hit the main support zone around 130 on Wednesday afternoon and bounced. This bounce does not look that strong though as stocks sold off in the final 30 minutes of trading. A strong bounce would have finished strong... Read More
Art's Charts February 24, 2011 at 04:24 AM
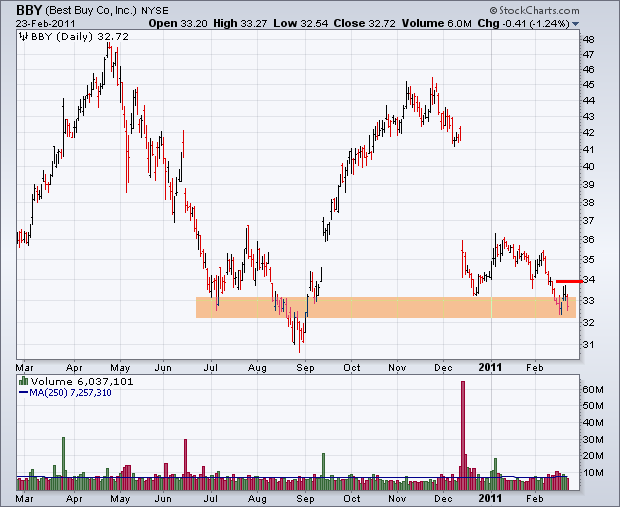
BBY Hits Long-term Support Zone. CL Forms Triangle Consolidation. IMB Forms Bull Wedge. Plus MHS, RTH and T. This commentary and charts-of-interest are designed to stimulate thinking... Read More
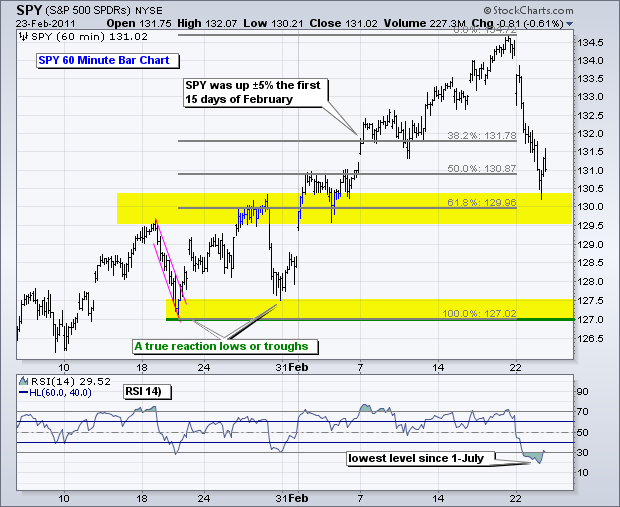
Art's Charts February 23, 2011 at 05:53 AM
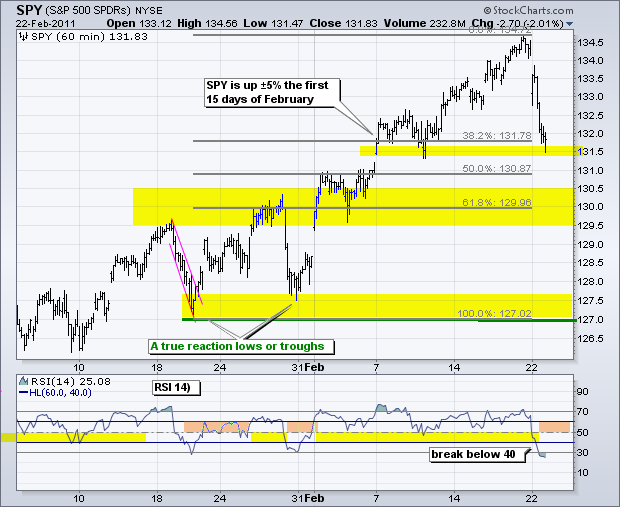
On the 60-minute chart, the S&P 500 ETF (SPY) hit its first support zone in the 131.5 area. This zone stems from the consolidation the second week of February. It is important to note that the gap down held and the ETF continued lower after the first wave of selling pressure... Read More
Art's Charts February 22, 2011 at 05:07 AM
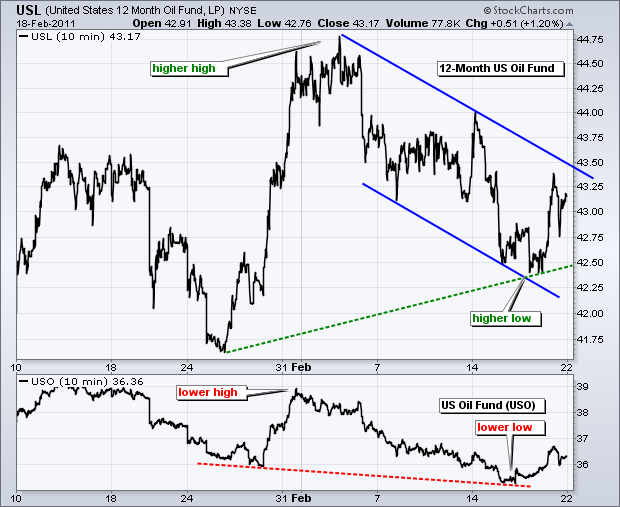
Unrest in Libya is sparking the flight to safety trade in a big way. Libya produces around 1.8 million barrels of oil per day and accounts for a 2% of global output... Read More
Art's Charts February 18, 2011 at 04:48 AM
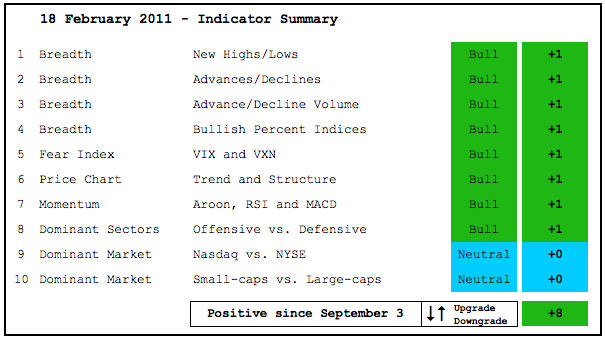
There is no change in the indicator summary. The AD Lines and AD Volume Line both surged to new 52-week highs this week. Major bearish reversals in the stock market are often preceded by bearish divergence in one or more of these indicators... Read More
Art's Charts February 18, 2011 at 03:47 AM
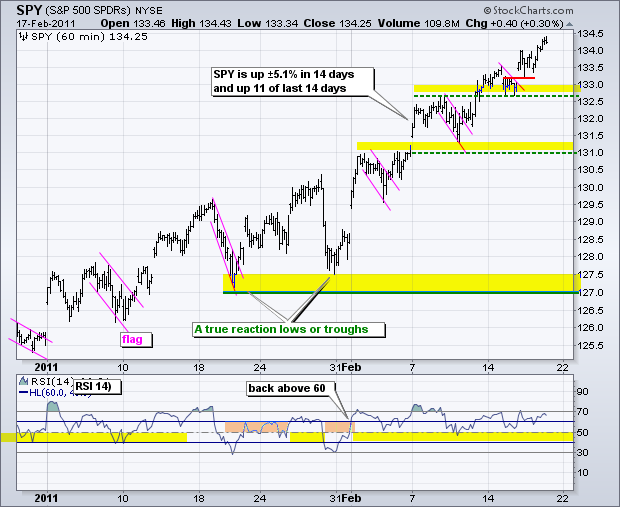
As you might expect, there is no change in the medium-term trend (daily chart) or short-term trend (60-minute chart). SPY is now up over 5% this month with gains on 11 of the last 14 days. In January, the index zigzagged higher with a choppy advance from ±125.5 to ±128... Read More
Art's Charts February 17, 2011 at 05:24 AM
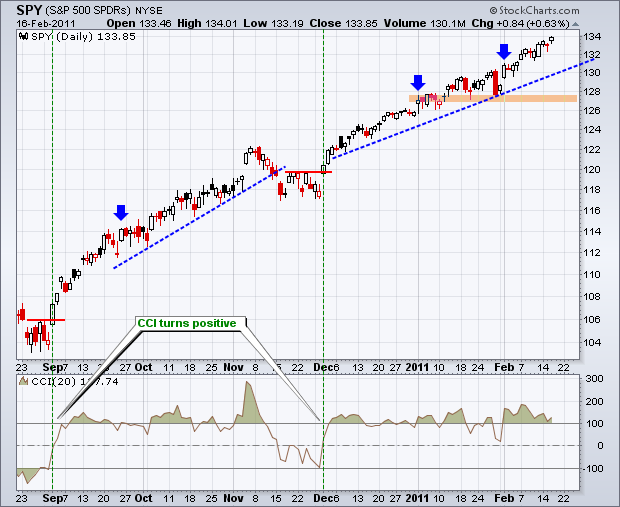
On the daily chart SPY surged on 1-Feb with a gap and long white candlestick that closed above 130. The advance continued after this surge with a grind higher... Read More
Art's Charts February 17, 2011 at 05:21 AM
CHRW consolidates at support. NEM breaks short-term resistance. KSS breaks wedge resistance with volume... Read More
Art's Charts February 16, 2011 at 05:31 AM
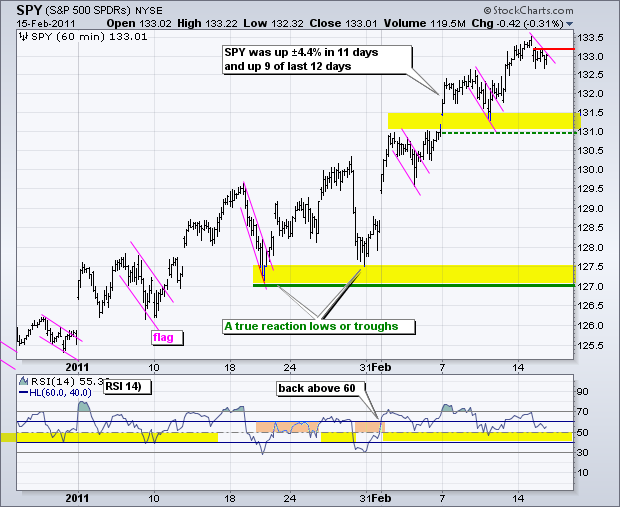
There is no change in the analysis for the 60-minute chart and daily chart. SPY gapped up the last two Monday's and both gaps held. The advance appears to be accelerating in February. Notice the sharp advances followed by short pullbacks this month... Read More
Art's Charts February 15, 2011 at 04:38 AM
There are dueling wedges for the Euro Currency Trust (FXE) and the Gold SPDR (GLD). FXE remains in a downtrend with a falling wedge, while GLD remains in an uptrend with a rising wedge... Read More
Art's Charts February 15, 2011 at 04:34 AM
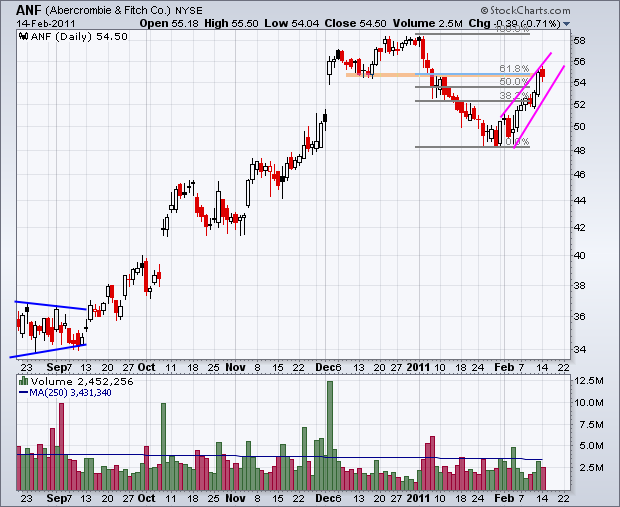
ANF stalls near key retracement. BRCM shows relative weakness. INTC forms harami near resistance... Read More
Art's Charts February 14, 2011 at 03:40 AM
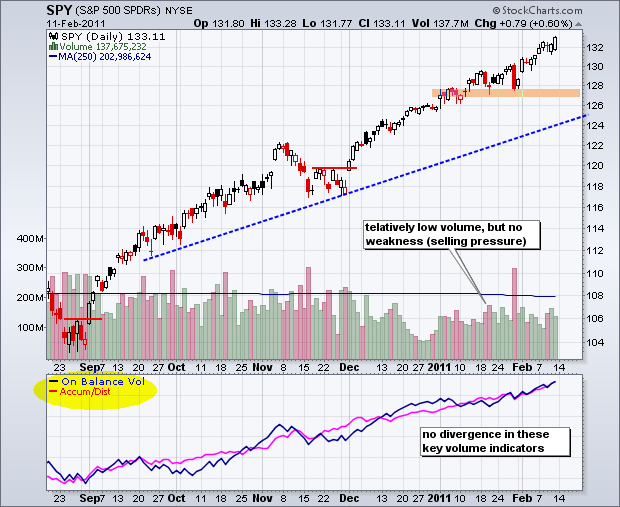
Despite low volume the last few months, the stock market continues to move higher. Let this be a lesson. Volume is an indicator that comes second to price action. In addition, overall volume is not as important as the balance of volume... Read More
Art's Charts February 11, 2011 at 05:06 AM
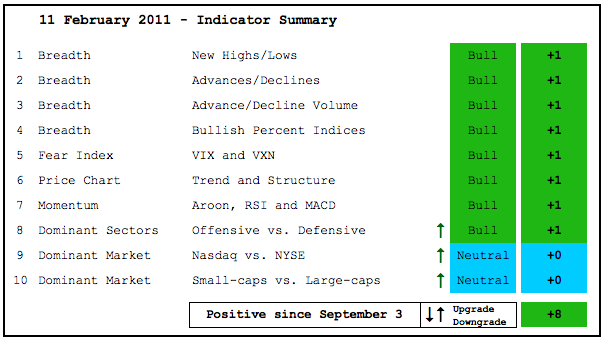
Three indicators were upgraded this week. With the three of the four key offensive sectors recording 52-week highs this week, I can hardly be bearish on this indicator. XLY, XLI and XLK hit new highs, while XLF remains close to its April high... Read More
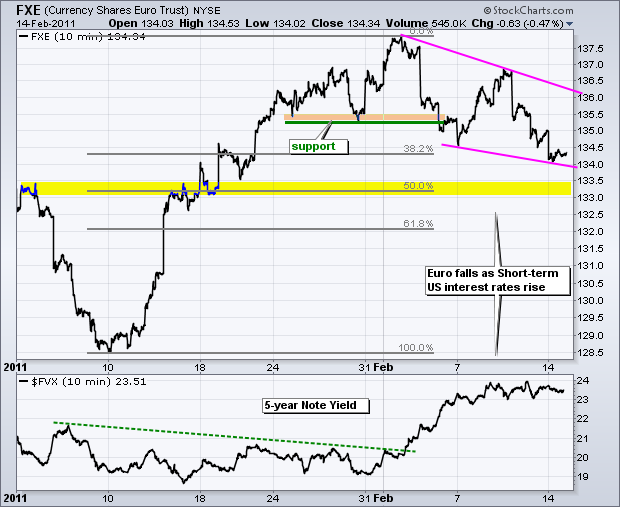
Art's Charts February 11, 2011 at 04:19 AM
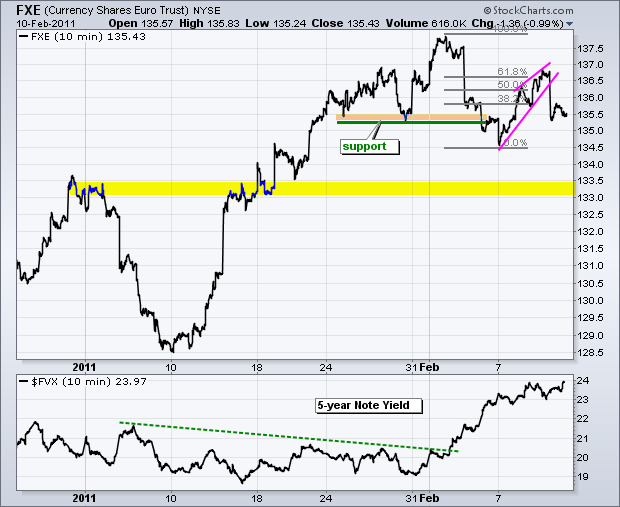
The Euro Currency Trust (FXE) broke down with a sharp decline, but the Gold SPDR (GLD) bounced after early weakness to hold well above support. I suspect that the Dollar is strengthening for a number of reasons. First, US interest rates surged in February... Read More
Art's Charts February 10, 2011 at 04:47 AM
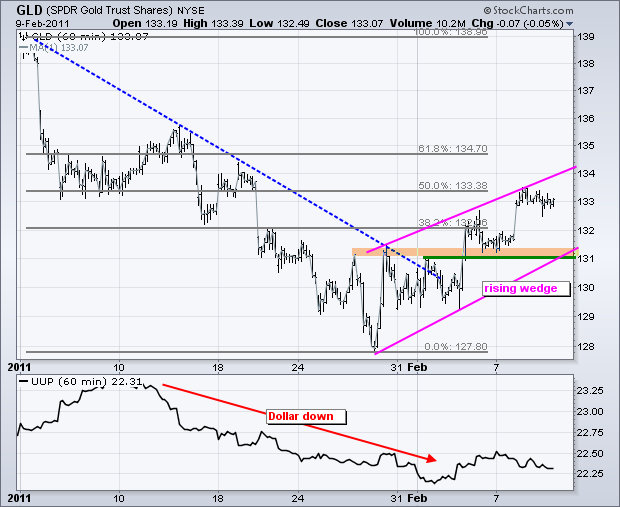
The Gold SPDR (GLD) remains in an uptrend, but this bullion ETF warrants a close watch as it trades near the 50% retracement with a rising wedge. I identified the inverse head-and-shoulders and breakout last week and GLD remains in an uptrend as long as the wedge rises... Read More
Art's Charts February 10, 2011 at 04:43 AM
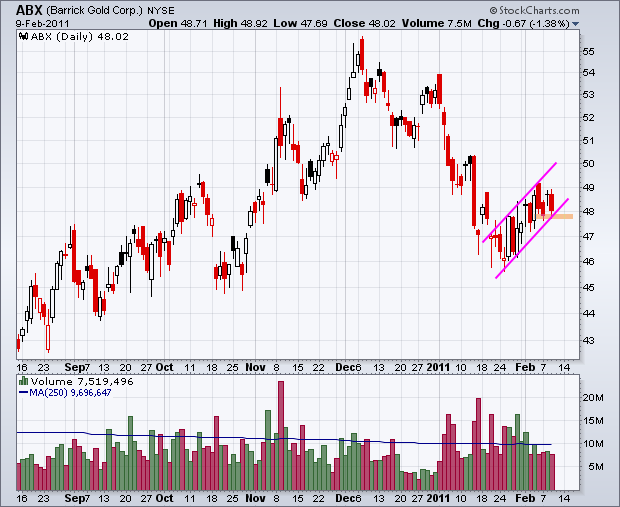
ABX forms rising flag. SWY breaks P&F trendline. X forges bearish engulfing at resistance. Plus FCX,HRB,MHP. This commentary and charts-of-interest are designed to stimulate thinking... Read More
Art's Charts February 09, 2011 at 05:47 AM
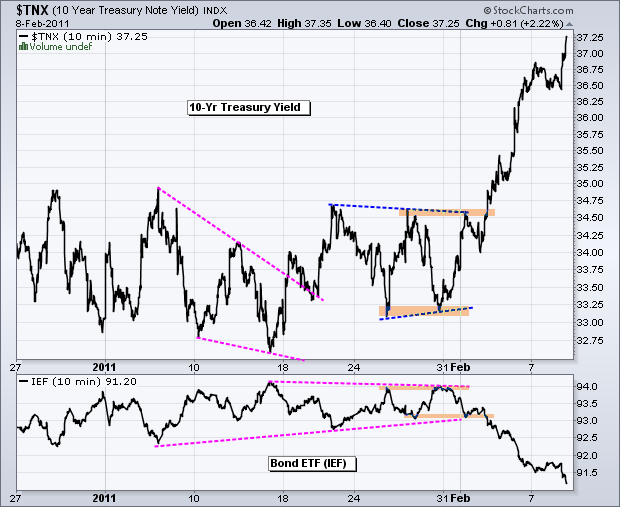
A virtual free fall in bonds is fueling a rally in stocks, and possibly gold. The first chart shows the 10-year Treasury Yield ($TNX) surging from 33.25 to 37.25 (3.325% to 3.725%) over the last seven days. The corresponding bond ETF (IEF) has fallen from around 94 to 91 (3%)... Read More
Art's Charts February 08, 2011 at 04:50 AM
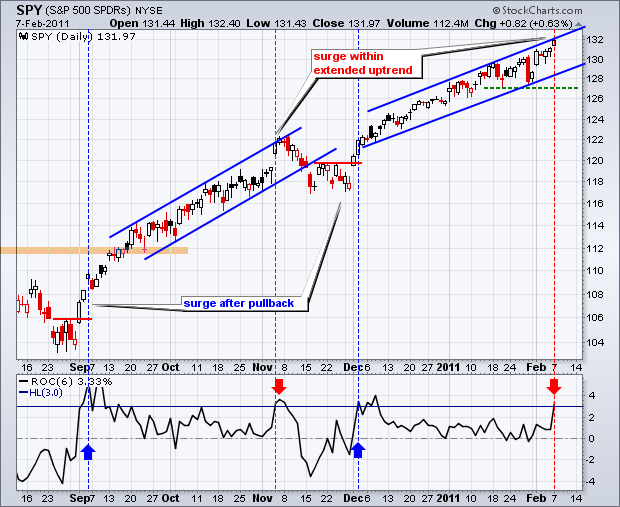
The S&P 500 ETF (SPY) is up 3.3% in the last six trading days or month-to-date. This is the sharpest 6-day advance since early December. There is, however, a big difference between the early December surge and the current surge... Read More
Art's Charts February 08, 2011 at 04:46 AM
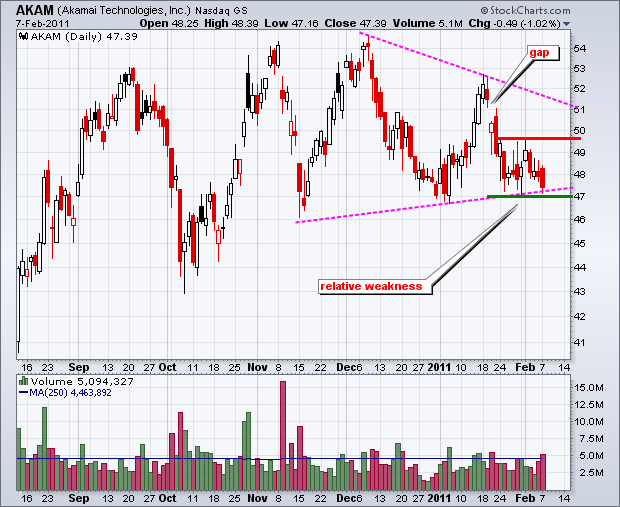
AKAM shows relative weakness. APD breaks flag resistance with gap. S consolidates with triangle. Plus CAKE, FDX, GTIV, MHP, URBN, USG This commentary and charts-of-interest are designed to stimulate thinking... Read More
Art's Charts February 07, 2011 at 04:04 AM
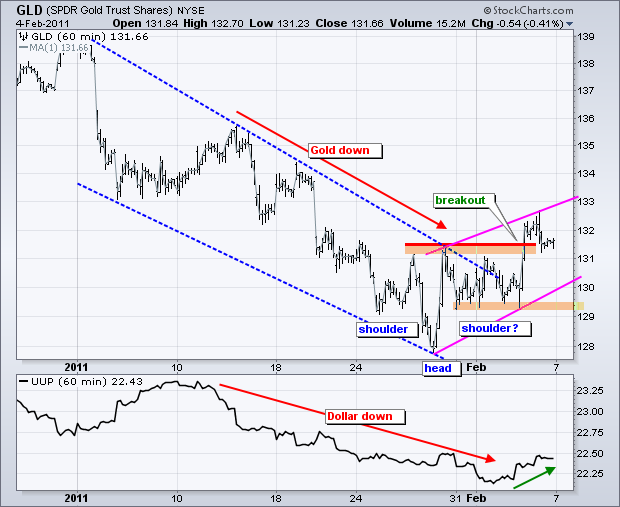
The Dollar/Gold relationship is a tough one to figure out these days. 2011 has seen both decline in January and bounce in February. The correlation this year appears to be largely positive, which is counter to the historically negative correlation... Read More
Art's Charts February 04, 2011 at 06:55 AM
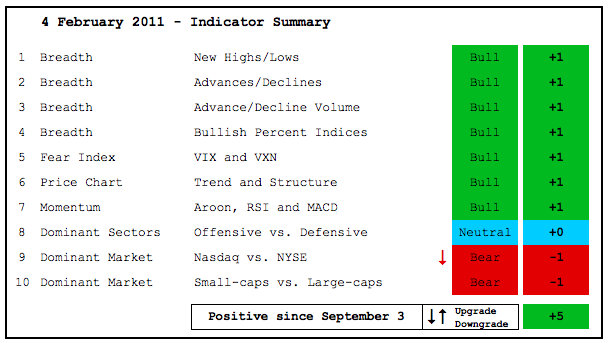
Despite relative weakness in small-caps, the consumer discretionary sector and the Nasdaq, the bulk of the evidence remains bullish for stocks. Moreover, this indicator summary has been positive since 3-September, five months now. The NYSE AD Line hit a new high this week... Read More
Art's Charts February 04, 2011 at 03:36 AM
There is not much change on the charts as we head into the employment report. This is kind of like a Fed announcement, expect most action occurs before the NYSE and Nasdaq actually open. The report is issued at 8:30 AM ET and the stock exchanges open an hour later... Read More
Art's Charts February 03, 2011 at 05:16 AM
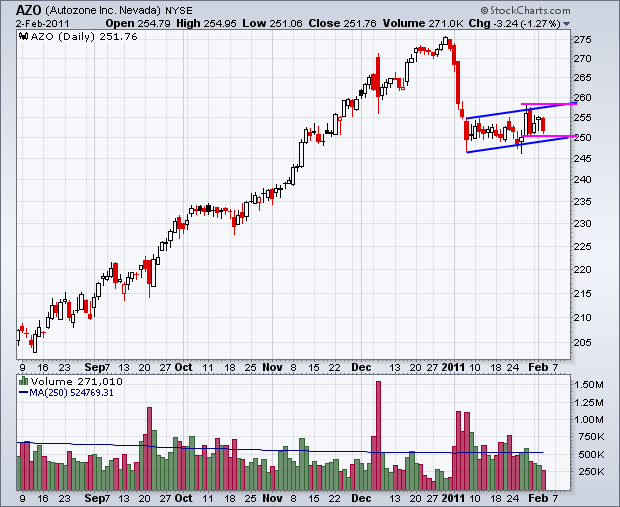
CHS forms bearish flag. FFIV firms in gap zone. SPWRB forms continuation HS pattern. Plus AZO, BBBY, EXP, SOL This commentary and charts-of-interest are designed to stimulate thinking... Read More
Art's Charts February 03, 2011 at 04:05 AM
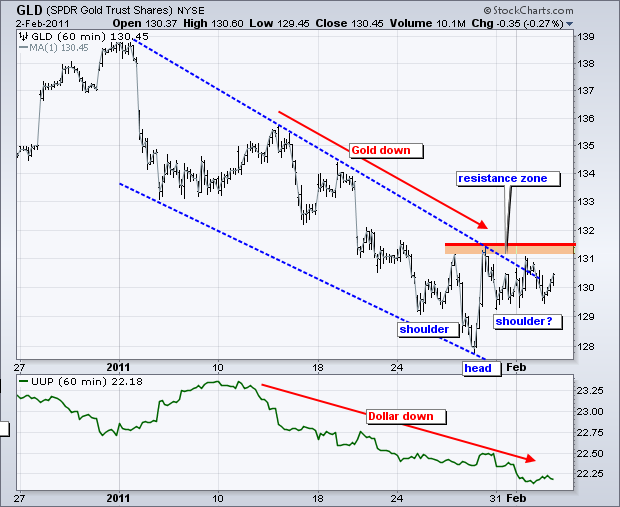
The Gold SPDR (GLD) is trying to stabilize with a small inverse head-and-shoulders pattern. Gold has been one of the weakest instruments in 2011. The chart below shows GLD peaking around 139 and moving below 129 last week for a ±7.1% decline... Read More
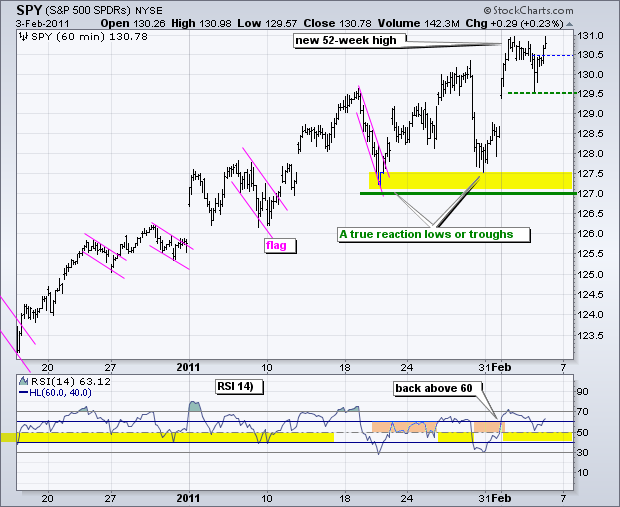
Art's Charts February 02, 2011 at 06:41 AM
A downtrend is impossible when an index hits a new high. Monday's short-term trend reversal has become a whipsaw or simply a bad call. With a gap up and break above 130, SPY re-established its short-term uptrend. A postmortem reveals four reasons for the errant trend reversal... Read More
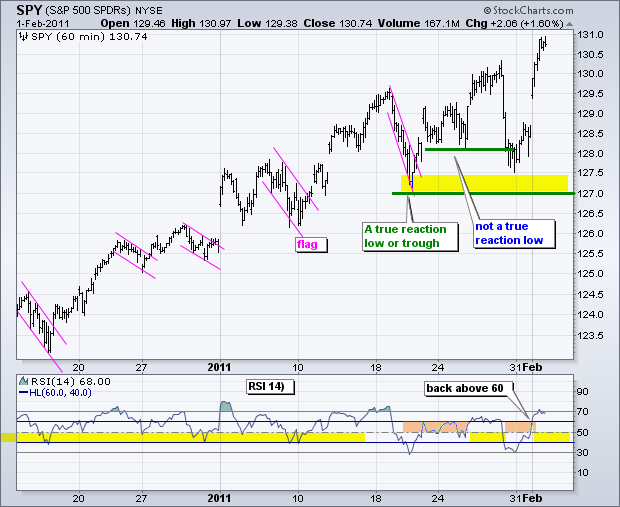
Art's Charts February 01, 2011 at 04:11 AM
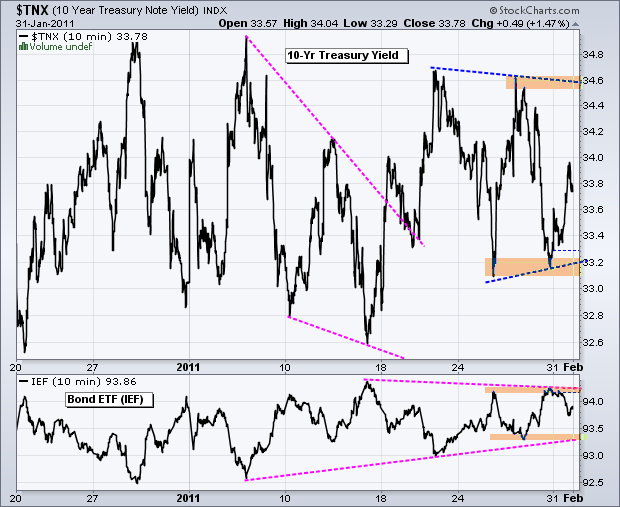
Interest rates and bonds remain stuck in a never-ending trading range. Calling it "never-ending" will hopefully bring a quicker end to this consolidation. Bonds have been weighed down by rising commodity prices and strength in the economy... Read More
Art's Charts February 01, 2011 at 04:07 AM
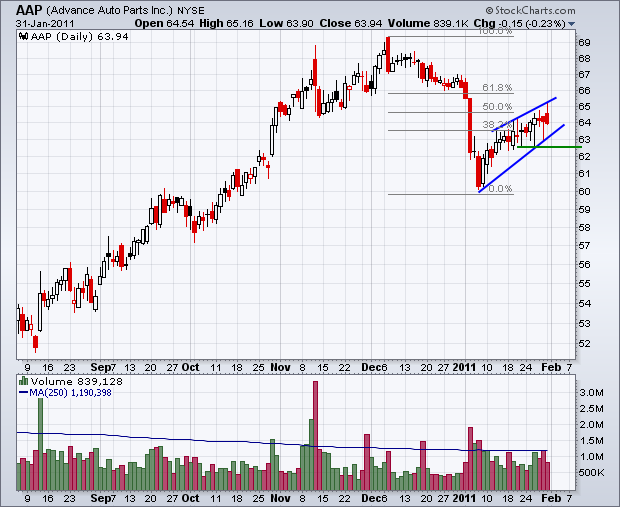
AAP forms rising wedge, ERTS surges off support. INTU forms small triangle. Plus INTU,M,MMM,PBR. This commentary and charts-of-interest are designed to stimulate thinking... Read More