Art's Charts September 30, 2011 at 06:10 AM
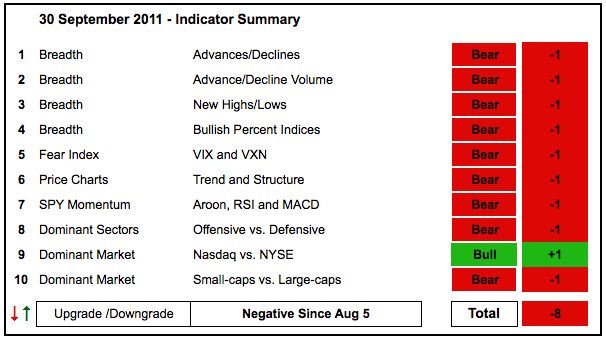
There is no change in the indicator summary. Nine of ten indicator groups are in bear mode. The NYSE AD Volume Line broke down last week. Small-caps show relative weakness as the $RUT:$OEX ratio hit a new low this month... Read More
Art's Charts September 30, 2011 at 04:47 AM
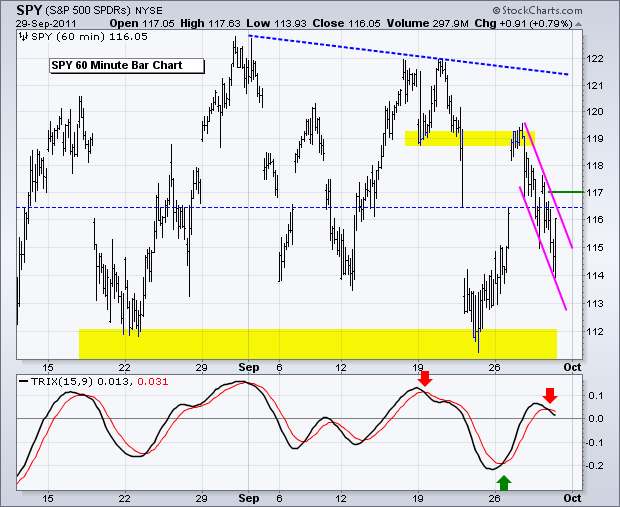
Despite a pop, drop and pop on Thursday, the short-term trend for stocks remains down. SPY opened above 117, but these gains did not last long as the ETF quickly dropped below 115. Selling pressure was actually pretty intense during the afternoon selloff... Read More
Art's Charts September 29, 2011 at 06:16 AM
Stocks continued their choppy ways with small and mid-caps leading the market lower on Wednesday. Oil, industrial metals and gold were also down sharply. The Dollar moved higher and US Treasuries were flat... Read More
Art's Charts September 29, 2011 at 06:11 AM
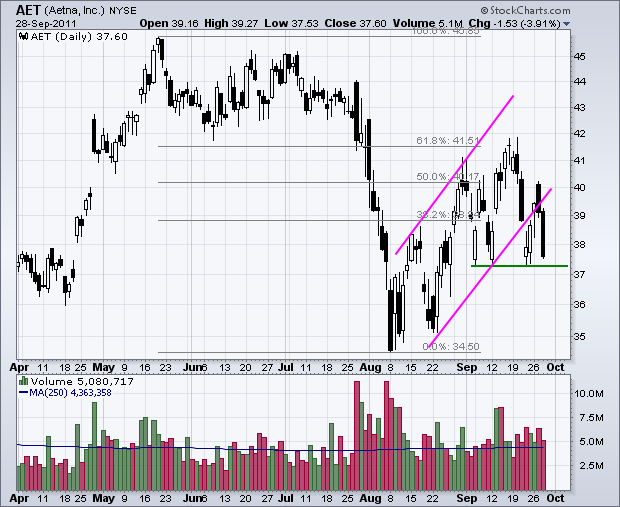
AET Reverses at Key Retracement. ANF Stalls after Gap. LULU Breaks Trendline with Gap Down. Plus JWN and MDT. This commentary and charts-of-interest are designed to stimulate thinking... Read More
Art's Charts September 28, 2011 at 04:39 AM
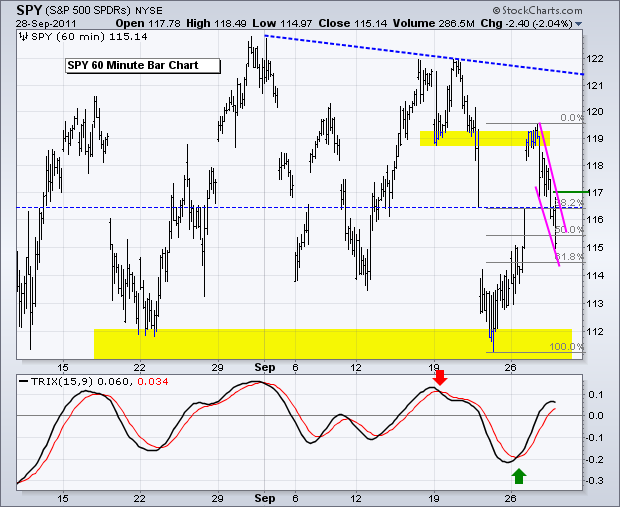
What a mess. The S&P 500 ETF (SPY) has been trading between 110 and 123 since early August (seven weeks). During this timeframe, the ETF has crossed the midpoint (116.50) at least 11 times. There have also been nine swings of at least five percent... Read More
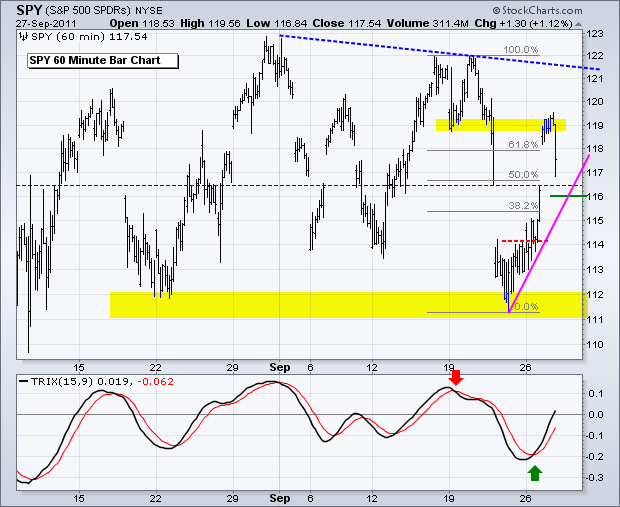
Art's Charts September 27, 2011 at 05:30 AM
Stocks surged on Monday with the finance, energy and materials sectors leading the way. These three were also the most oversold. While Net Advancing Volume was fairly strong, Net Advances for the Nasdaq and NYSE were not that strong... Read More
Art's Charts September 27, 2011 at 05:26 AM
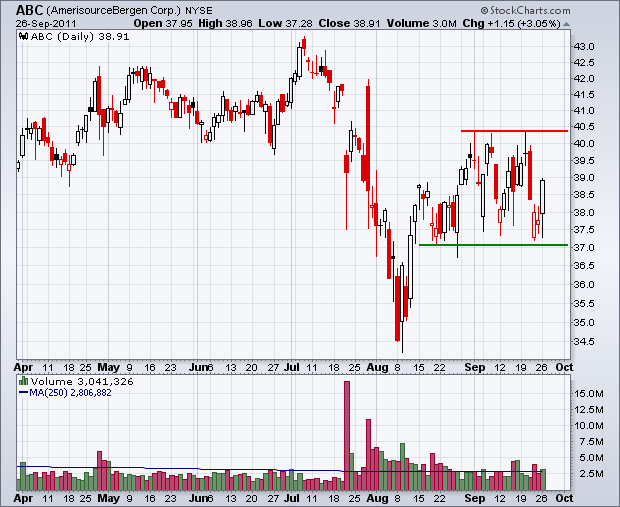
CSCO Forms Inverse HS Pattern ELN Breaks Resistance with Volume. NVDA Declines to 61.80% retracement. Plus ABC, LRCX and WM This commentary and charts-of-interest are designed to stimulate thinking... Read More
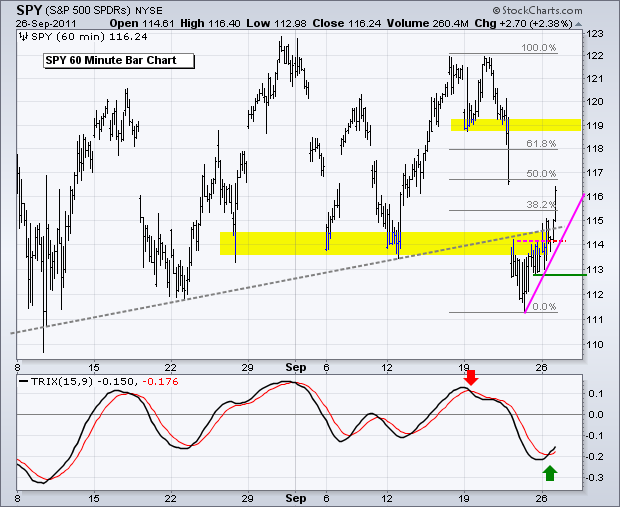
Art's Charts September 26, 2011 at 05:21 AM
After a broad decline last week, stocks became short-term oversold and consolidated most of Thursday and Friday. This does nothing to change the short-term or medium-term downtrends. Overall, the medium-term trend is clearly down after a break below the September lows... Read More
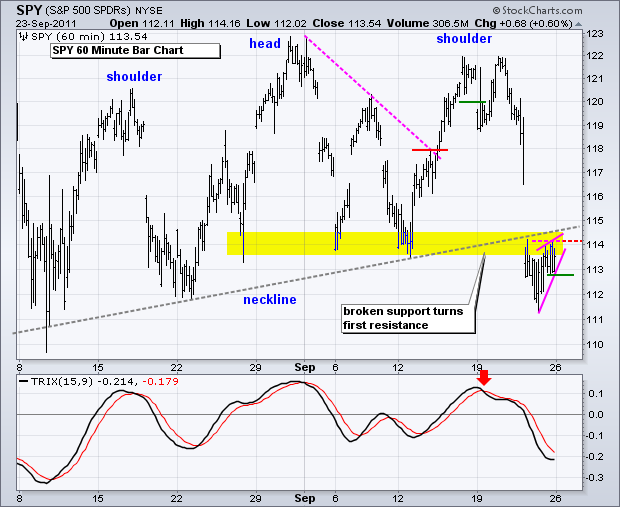
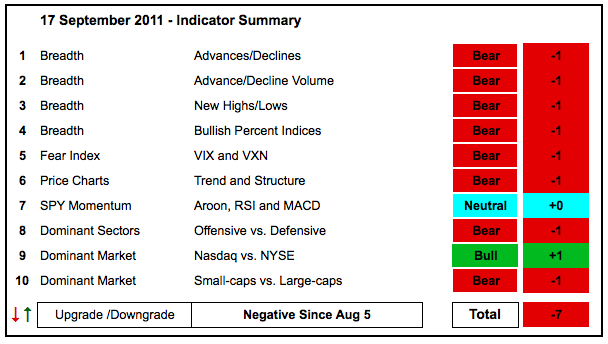
Art's Charts September 23, 2011 at 06:20 AM
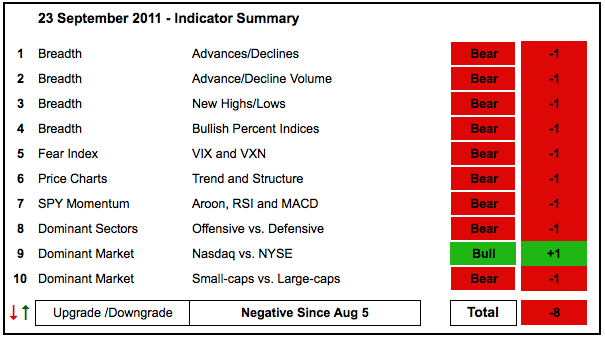
Needless to say, the indicator summary remains decidedly negative. With another sharp move lower this week, the SPY momentum indicators moved from neutral to bearish. The Nasdaq AD Line and NYSE AD Volume Line hit new lows this week... Read More
Art's Charts September 23, 2011 at 05:02 AM
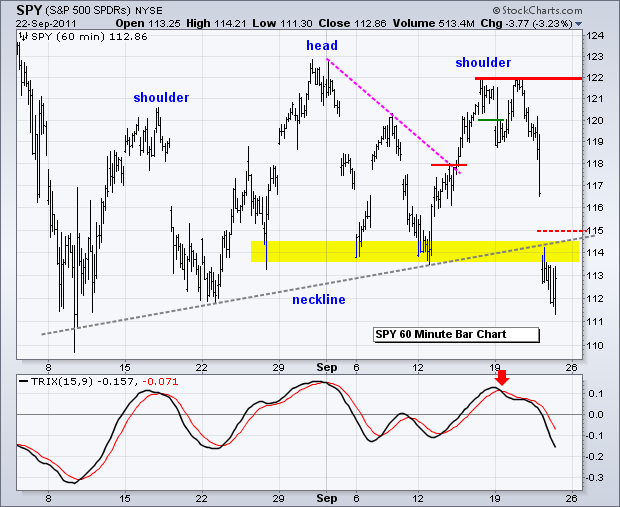
Looks like everyone ran for the exit at the same time, whatever the reason. The S&P 500 ETF (SPY) broke below the early September lows with a plunge below 112 intraday. There was a big gap below 114, an intraday dip below 112 and a last hour surge to around 113... Read More
Art's Charts September 22, 2011 at 04:11 AM
It is getting ugly. Asian and European stocks are down sharply. Gold, the Euro and oil are also down. The Dollar and US Treasuries are the only positive spots. It is a classic flight to safety or move to the risk-off trade... Read More
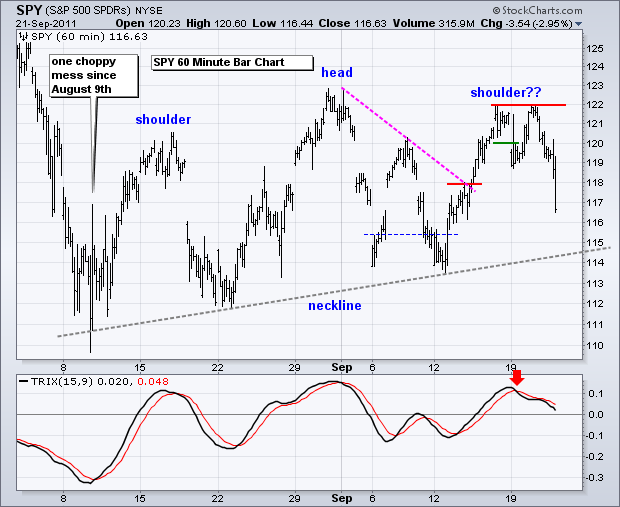
Art's Charts September 21, 2011 at 05:20 AM
In an about face, stocks started the day strong and sold off in the final hour. Perhaps even more telling, small-caps led the way lower with the Russell 2000 ETF (IWM) loosing 1.55% on the day. This is a negative sign to see small-caps lead lower... Read More
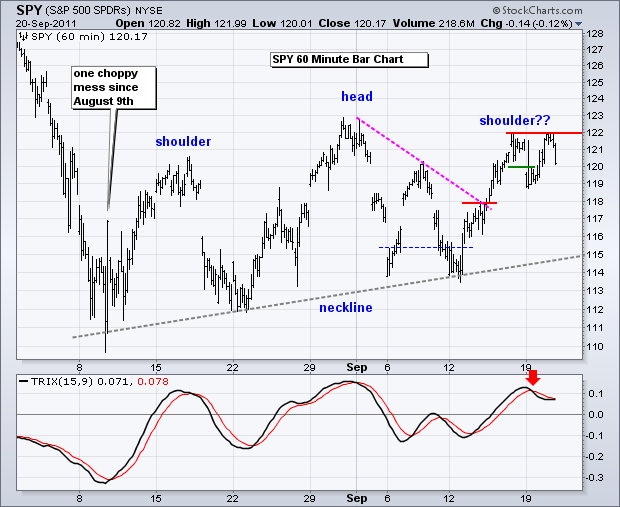
Art's Charts September 20, 2011 at 04:44 AM
Stocks started the day weak, but surged in the final hour on rumors of a Greek debt deal involving the European Central Bank (ECB), IMF and the European Commission. Gee, maybe we can find a few more organizations to throw into this rumor... Read More
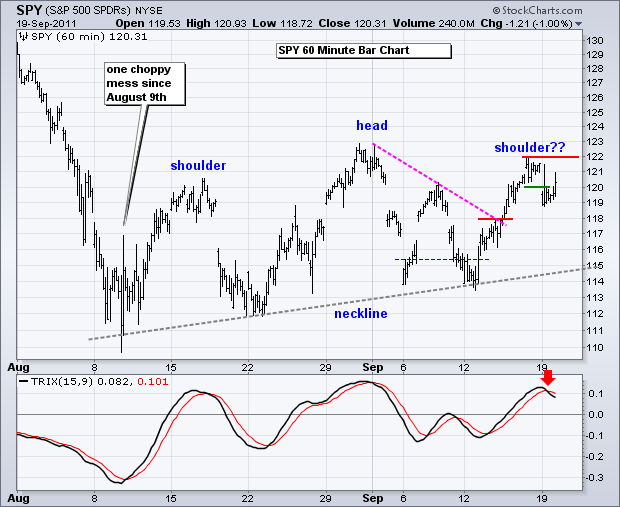
Art's Charts September 19, 2011 at 04:04 AM
It could be a wild week in the markets. First, stock futures are pointing to a sharply lower open. The Euro and oil are trading lower, while bonds and the Dollar are trading higher... Read More
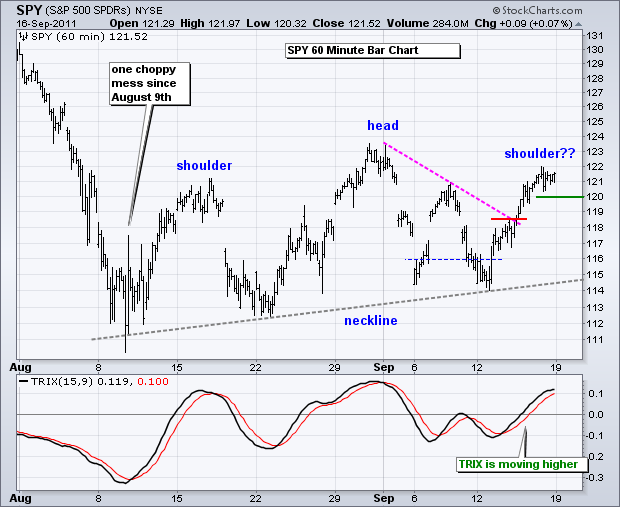
Art's Charts September 16, 2011 at 07:06 AM
The indicator summary remains unchanged. Except for the Nasdaq 100 ETF (QQQ) and large techs, stocks have been moving sideways the last several weeks. QQQ is trading at its highest level since August 3rd, but the other major index ETFs remain below their August 31st highs... Read More
Art's Charts September 16, 2011 at 03:51 AM
As noted earlier, I view the decline from late July to early August as an impulse move. This means it is a strong move that is part of a bigger trend. In this case it is down. The choppy advance since the second week of August looks like a corrective move... Read More
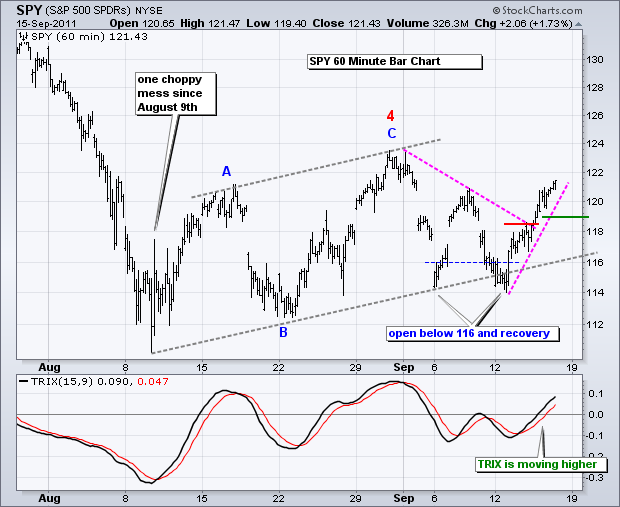
Art's Charts September 15, 2011 at 06:41 AM
The market is getting knee-deep in hollow rhetoric. Yesterday, Sarkozy and Merkel said they are "convinced that the future of Greece is in the euro zone". Gee, what a surprise... Read More
Art's Charts September 15, 2011 at 06:29 AM
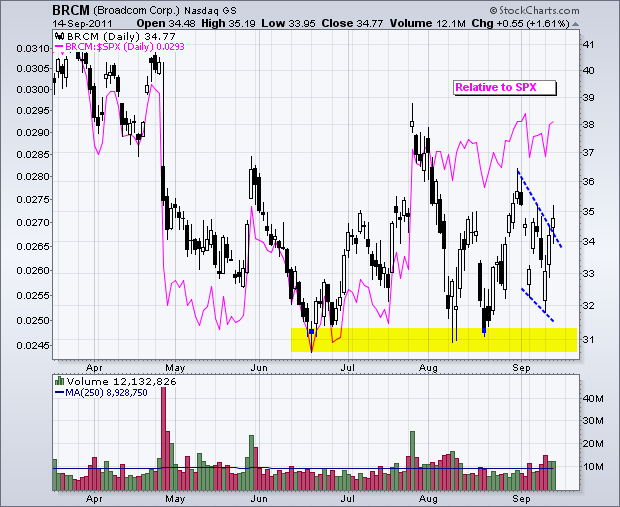
BRCM Shows Relative Strength. DE Forms Falling Wedge Correction. SVU Forms Bullish Pennant after Surge. Plus CVX, DDS, GFI This commentary and charts-of-interest are designed to stimulate thinking... Read More
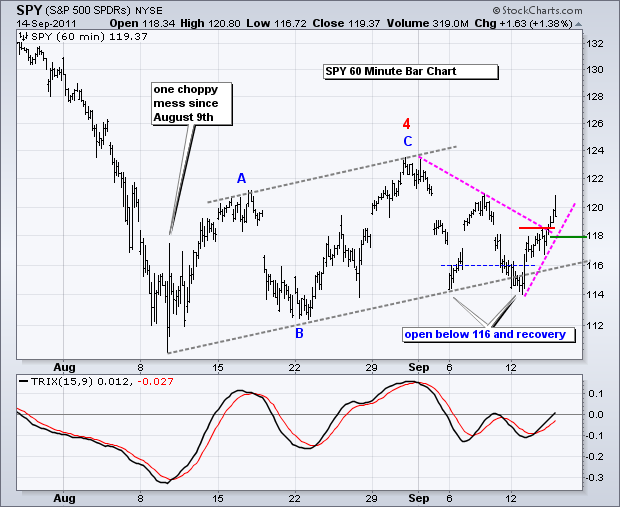
Art's Charts September 14, 2011 at 04:22 AM
Stocks managed a half-hearted bounce on Tuesday for the second up day in a row. This is not bad considering the news backdrop (European debt and banks). Technical analysts are not so much interested in the news, but rather the market's reaction to the news... Read More
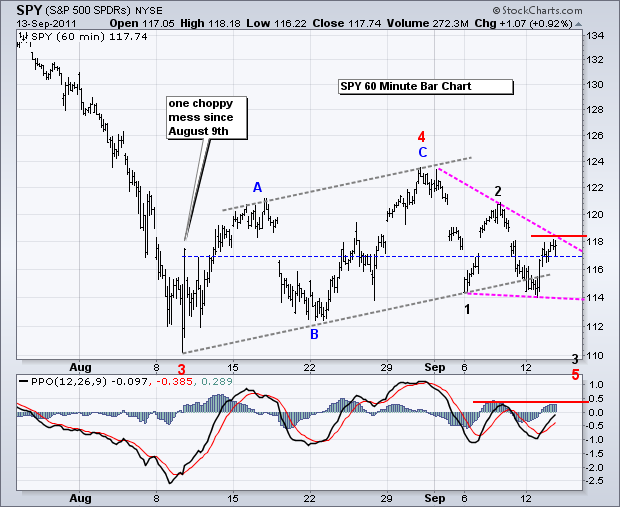
Art's Charts September 13, 2011 at 06:31 AM
After meandering in negative territory most of the day, stocks surged in the final hour to close with small gains. Rumors were swirling that China was going to buy Greece. That's a joke. Expect more market moving rumors as this crisis unfolds... Read More
Art's Charts September 13, 2011 at 06:25 AM
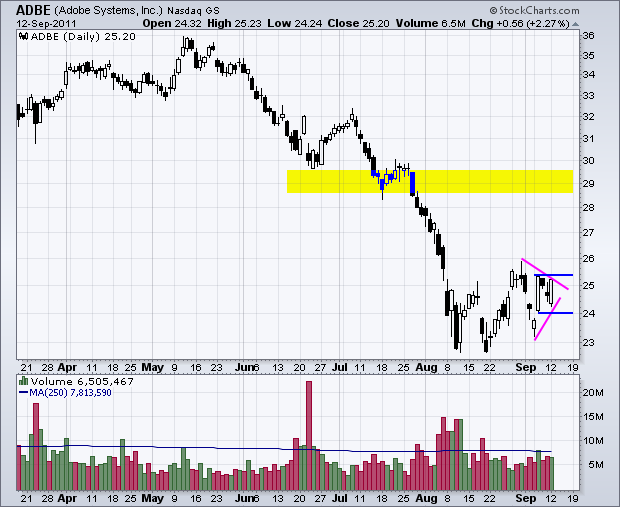
ADBE Consolidates after Gap Up. DELL Forms Piercing Line at Support. JWN Hits Resistance at Key Retracement. Plus AES, ARUN, LTD, LULU, PG This commentary and charts-of-interest are designed to stimulate thinking... Read More
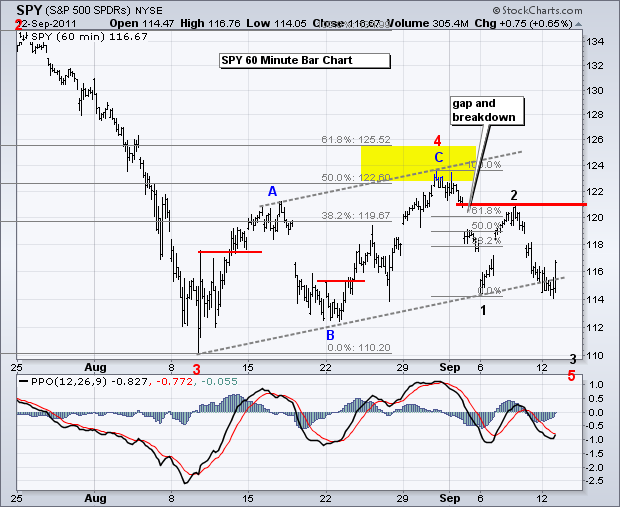
Art's Charts September 12, 2011 at 04:53 AM
European banks are in the spot light on Monday. First, speculation is rising that Greece will finally default. Second, the debt agencies are poised to downgrade a number of European (mainly French) banks... Read More
Art's Charts September 09, 2011 at 04:52 AM
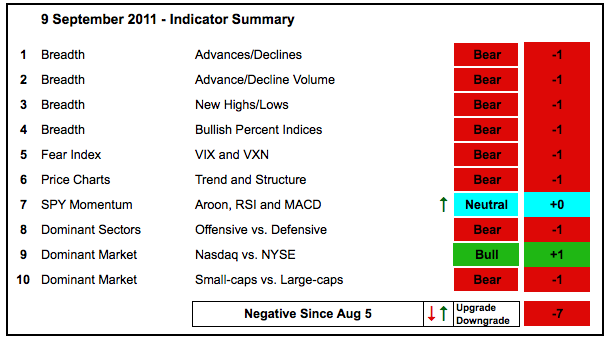
One indicator group was upgraded in the indicator summary. With a surge in the Aroon Oscillator (20), SPY momentum was upgraded from bearish to neutral. The rest remains unchanged, very unchanged. Stocks have been edging higher with choppy trading the last five weeks... Read More
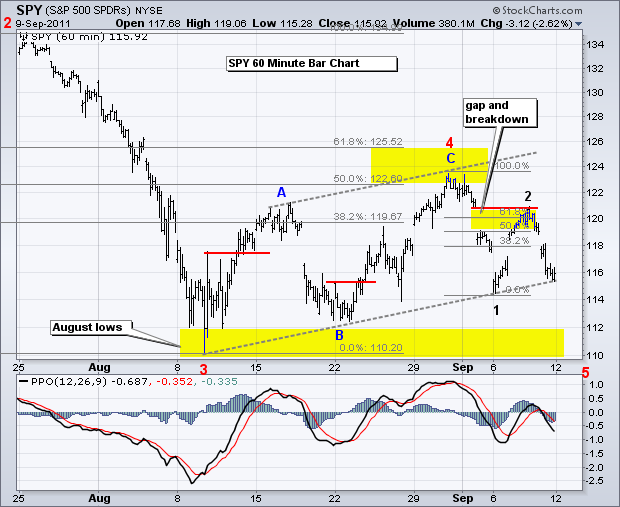
Art's Charts September 09, 2011 at 03:39 AM
Stimulus-response. The stock market is like an ameba reacting to stimulus pokes from Washington, the Fed and the European Central Bank. Even though nothing is concrete, the market is certainly expecting some stimulus down the road... Read More
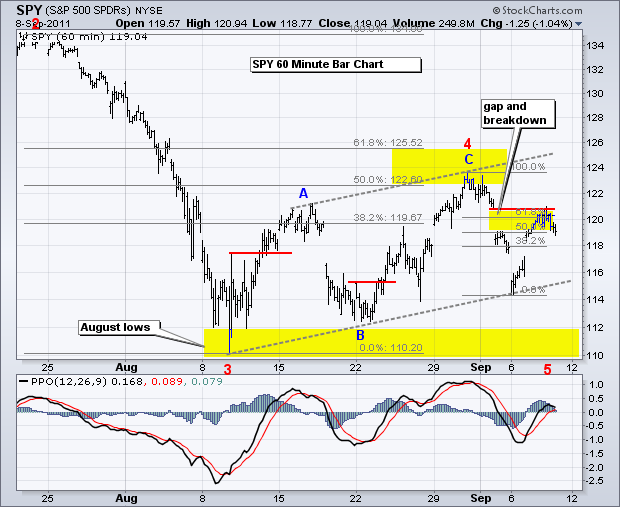
Art's Charts September 08, 2011 at 06:34 AM
All this stimulus talk has stimulated the bulls. Charles Evens, head of the Chicago Fed, called on stimulus to cut the unemployment rates. Obama will no doubt offer some sort of stimulus plan to create more jobs... Read More
Art's Charts September 08, 2011 at 06:22 AM
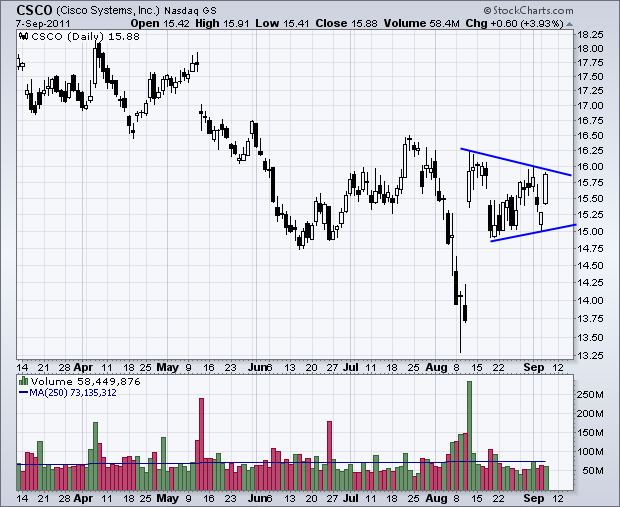
CSCO Forms Pennant after Early August Surge. MA Breaks Triangle Resistance. NVDA Gaps above Resistance on Big Volume. Plus GGB, SVU and WFR. This commentary and charts-of-interest are designed to stimulate thinking... Read More
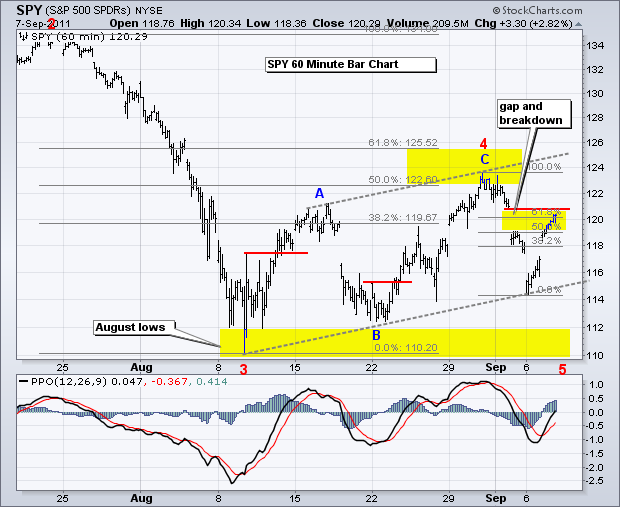
Art's Charts September 07, 2011 at 05:36 AM
A better-than-expected ISM Services report and oversold conditions gave way to a post-open bounce on Monday. The Nasdaq 100 ETF (QQQ) closed a penny higher, but the rest of the major index ETFs closed with small losses. Eight of the nine sectors were down... Read More
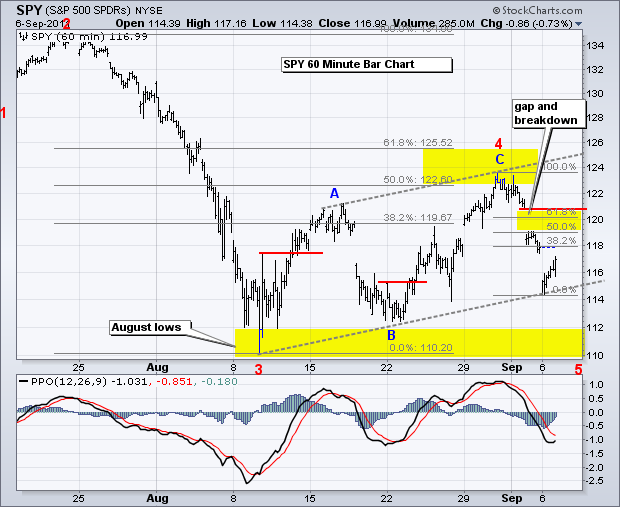
Art's Charts September 06, 2011 at 06:11 AM
The financial markets are rather chaotic this morning. I say this because there was a dramatic about-face around 4AM ET when the Swiss National Bank announced a "floor" for the Euro. In effect, the Swiss said they would not tolerate a Euro/Swiss rate below 1.20 (1... Read More
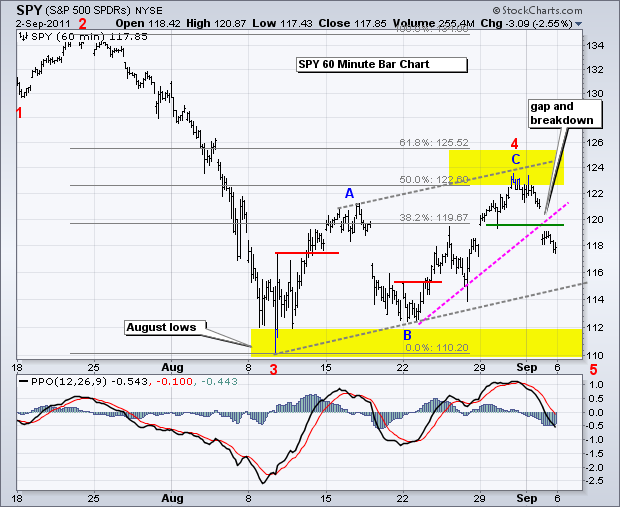
Art's Charts September 02, 2011 at 06:12 AM
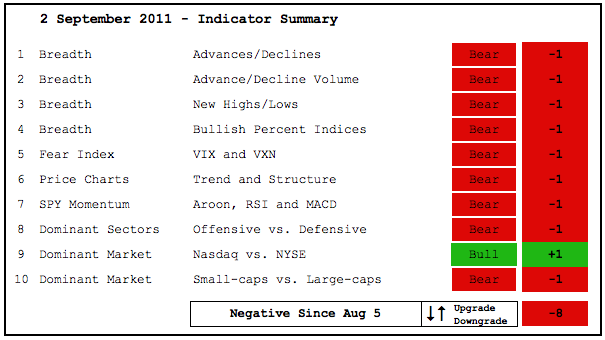
There is no change in the indicator summary. Many indicators improved over the last few weeks as the major index ETFs broke above their mid August highs. However, this improvement looks like a bear market rally. Net New Highs recovered with a move back to the zero lines... Read More
Art's Charts September 02, 2011 at 04:33 AM
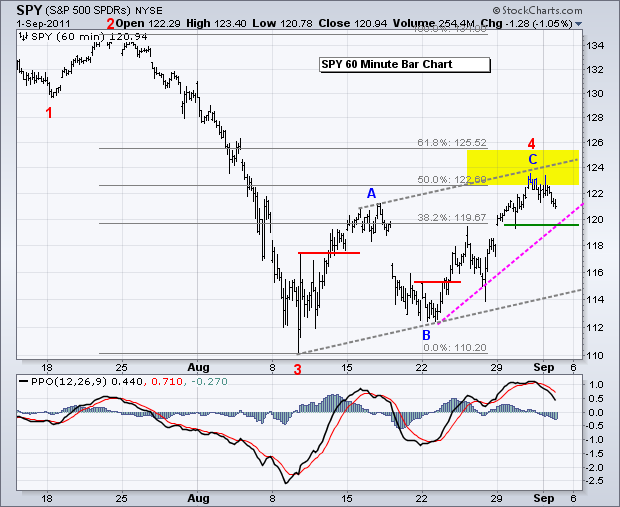
After an ISM pop in the morning, stocks were hit with a dose of selling pressure and closed weak. Even though the ISM Index was better-than-expected, it was still weak overall and at a two year low. Anything above 50 indicates expansion, but a reading of 50... Read More
Art's Charts September 01, 2011 at 08:22 AM
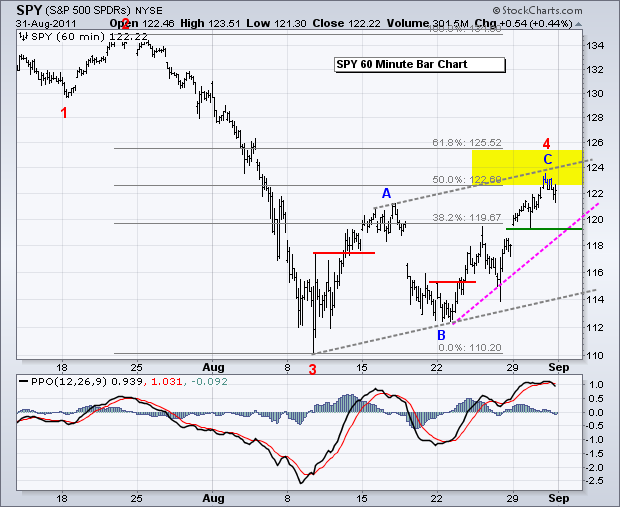
The bulls weakened a bit on Wednesday, but stocks still managed gains overall. There were pockets of weakness with the Russell 2000 ETF (IWM) and Technology ETF (XLK) edging lower. The Finance SPDR (XLF) continued its run with a 1.29% gain to lead all sectors... Read More
Art's Charts September 01, 2011 at 08:17 AM
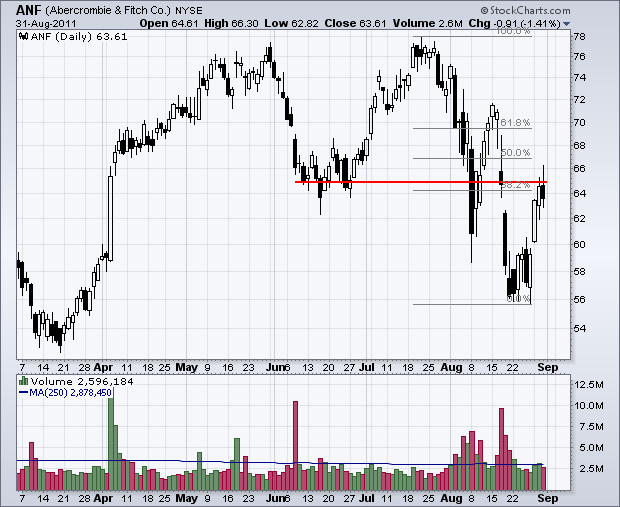
CHS Retraces 50% with Rising Wedge. IBM Stalls Near Mid August High. KSS Forms Triangle within Downtrend. Plus ANF, FL, MON This commentary and charts-of-interest are designed to stimulate thinking... Read More