Art's Charts October 31, 2011 at 08:13 AM
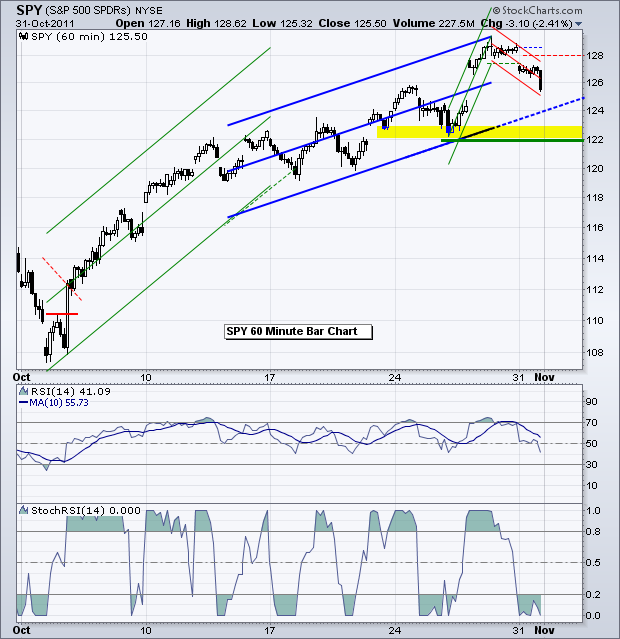
The market made a statement on Monday. After a big risk-on move last week, the market made a hard turn towards risk-off on Monday. It is just one day, but a bad week would likely suggest that the medium-term bullish signals seen over the last two weeks have been negated... Read More
Art's Charts October 31, 2011 at 08:08 AM
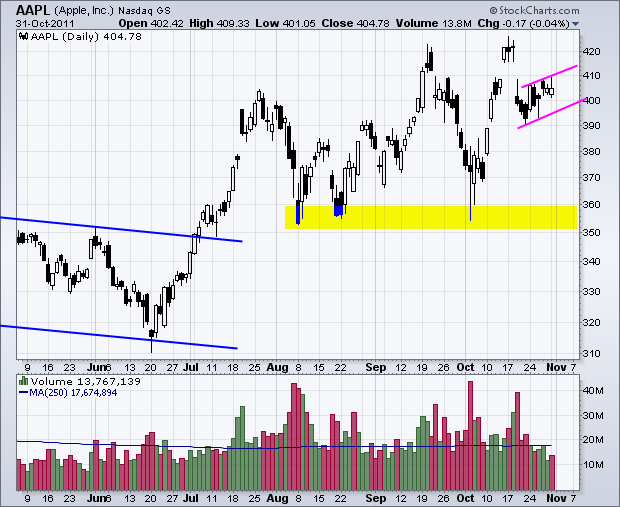
AAPL Forms Bear Flag. GME Forms Shooting Star Near Resistance. Upside Volume Surges for NXY. Plus BAX and SPLS This commentary and charts-of-interest are designed to stimulate thinking... Read More
Art's Charts October 30, 2011 at 04:42 AM
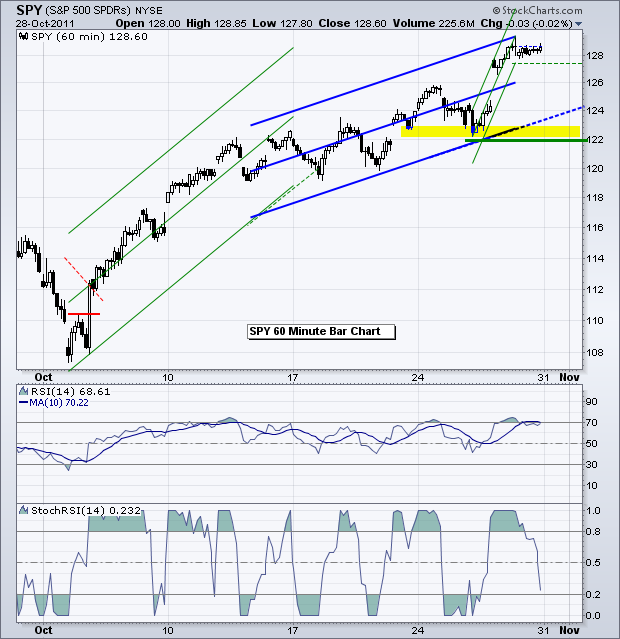
First, note that stocks remain in strong uptrends since the October 4th reversals. Second, the major index ETFs are quite overbought. IWM is up over 24% the last 19 days. SPY is up almost 17% and QQQ is up just over 15%. These are huge gains in just four weeks... Read More
Art's Charts October 27, 2011 at 11:47 AM
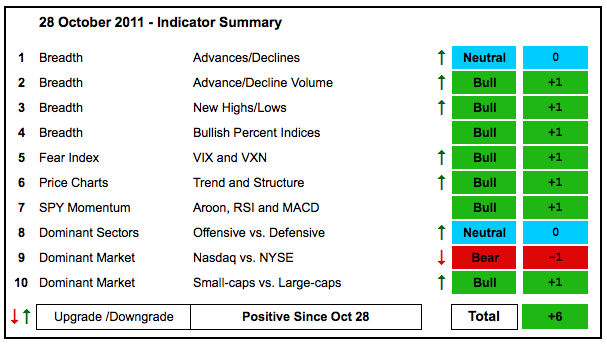
As noted last week, another strong move in the stock market would likely turn the indicator summary positive. That is indeed what we got, especially with Thursday's surge. The NYSE AD Line and Nasdaq AD Volume Line surged through resistance levels... Read More
Art's Charts October 27, 2011 at 11:24 AM
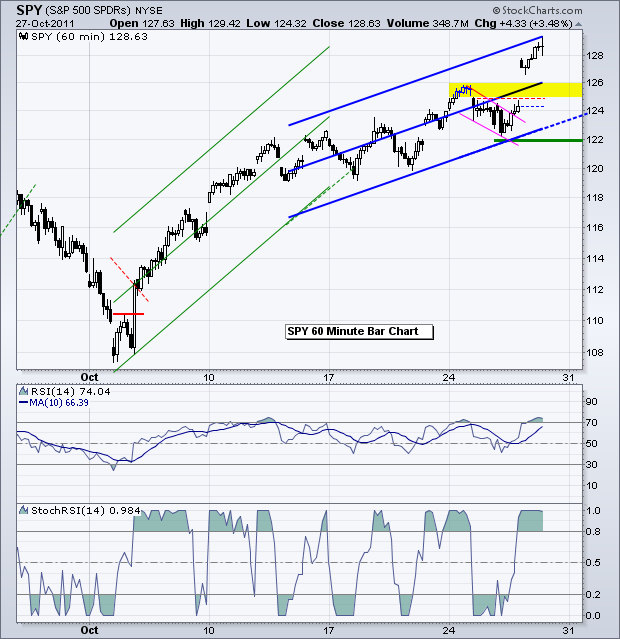
Stocks surged on the open and closed strong with all boats rising. Small-caps and mid-caps led the advance, which shows a strong appetite for risk. All sectors were up with the Finance SPDR (XLF) surging almost 6%... Read More
Art's Charts October 27, 2011 at 01:24 AM
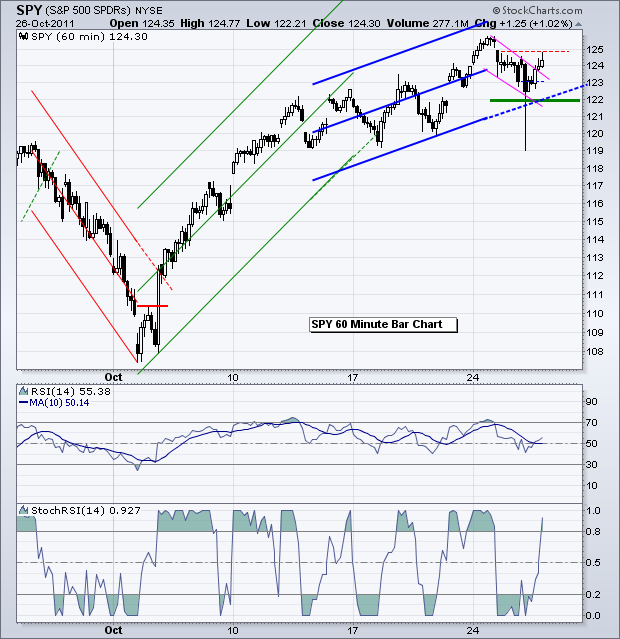
Stocks started the day weak with large-cap techs leading the way lower early Wednesday. QQQ opened with a move below 56.5 and was down some 1.7% at one point. However, the bulls showed their resilience as stocks rallied back by the close. QQQ returned to positive territory... Read More
Art's Charts October 27, 2011 at 01:23 AM
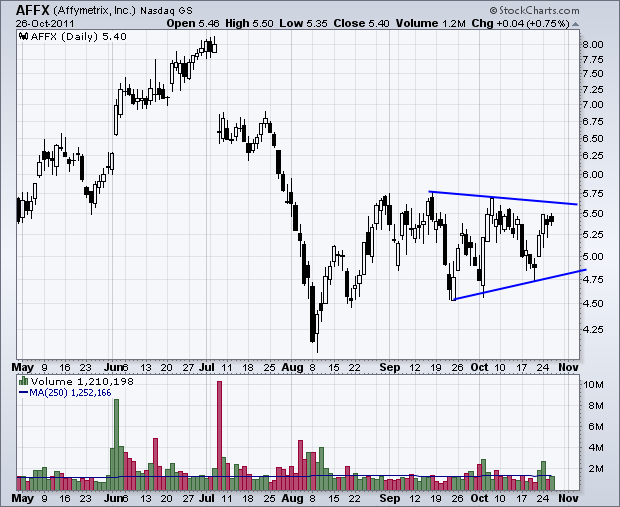
Careful, it is still earnings season. AKAM Forms Pennant after Big Surge. AMRK Consolidates with Triangle. SLB Forms Bull Flag after Trendline Break. Plus AFFX, MDR, WFT This commentary and charts-of-interest are designed to stimulate thinking... Read More
Art's Charts October 26, 2011 at 04:14 AM
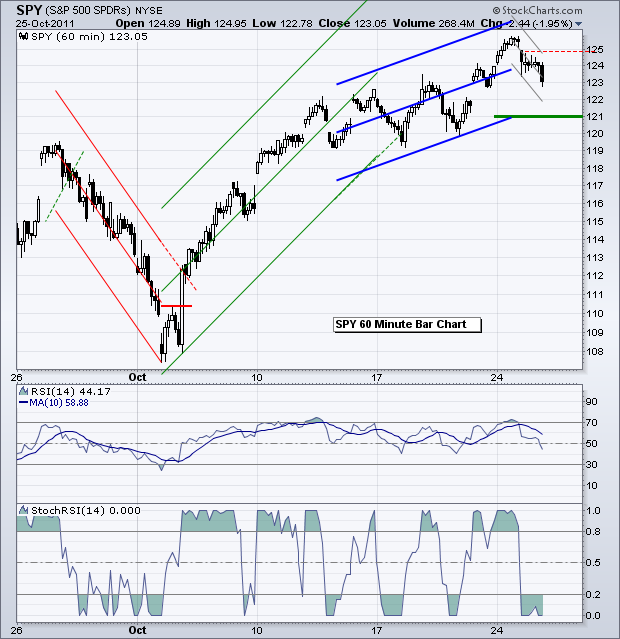
Do yourself a favor. Don't read about the EU summit. As Mickey Blue Eyes might say: Fuggedaboutit! Focus on the price charts. All known information is reflected in the charts. In fact, there is also likely a little bit of unknown information in the charts as well... Read More
Art's Charts October 25, 2011 at 05:07 AM
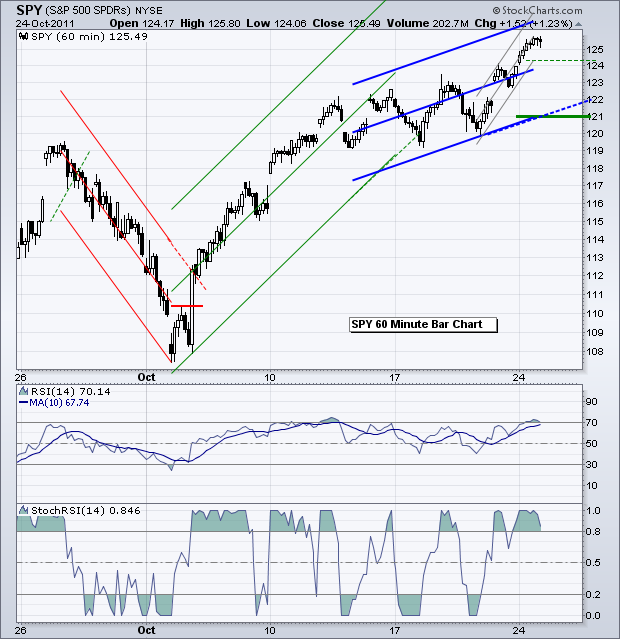
It is getting close to crunch time for the EU. How many times have we heard this before? Anyhow, yet another deadline is approaching and there are still rifts between Germany and France on the size, scope and leverage for the bailout fund... Read More
Art's Charts October 25, 2011 at 04:58 AM
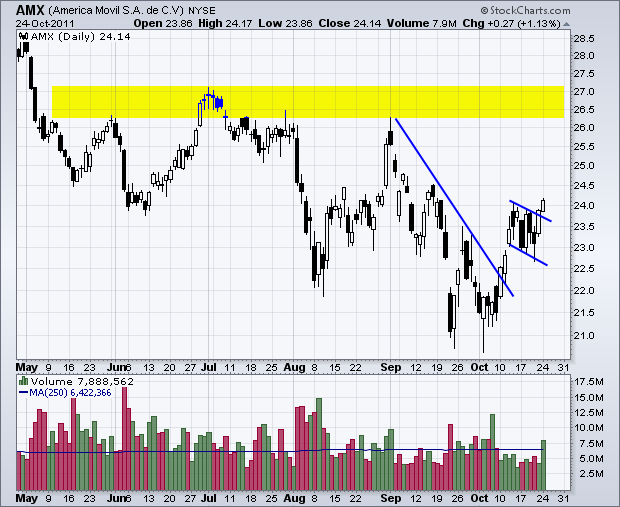
AMX Breaks Flag Resistance with Volume. CHS Bounces off Flag Support. STI Surges to Challenge Resistance. Plus NTAP, POT, SWKS, TMO This commentary and charts-of-interest are designed to stimulate thinking... Read More
Art's Charts October 24, 2011 at 05:22 AM
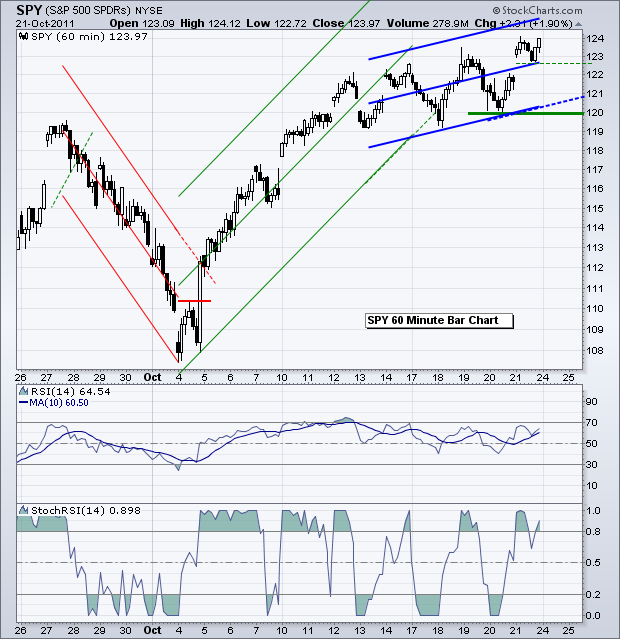
Stocks opened strong with a gap on Friday morning, consolidated and then closed strong. With another advance, the S&P 500 ETF (SPY) moved to a new high for the move as it broke above its mid October highs... Read More
Art's Charts October 21, 2011 at 05:52 AM
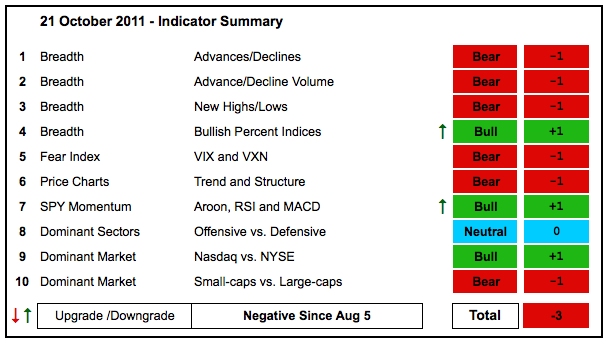
The October rally stalled over the last few days and many charts show that this stall is occurring at important levels. The S&P 500 ETF (SPY) and Dow Industrials SPDR (DIA) are both stalling at resistance from the late August highs... Read More
Art's Charts October 21, 2011 at 04:16 AM
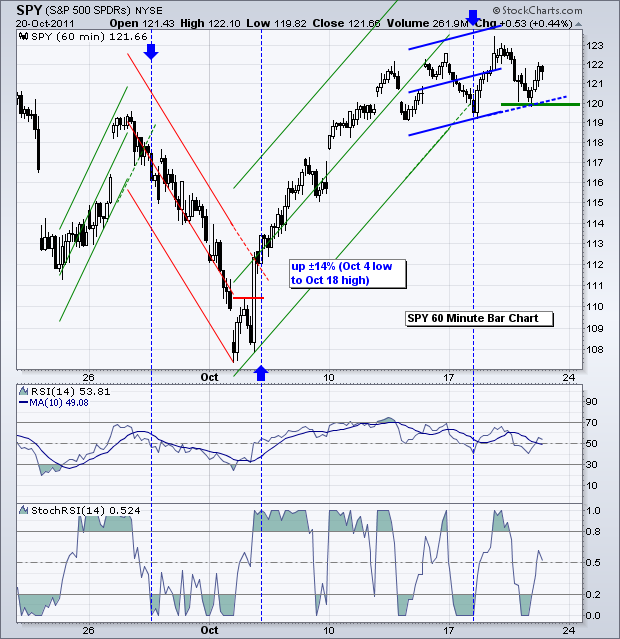
Short-term trading remains choppy as stocks bounce within a range. Playing the swings within this range is not suited for 60-minute charts. Chartists wishing to play these swings should turn to 10 or 15 minute charts... Read More
Art's Charts October 20, 2011 at 08:00 AM
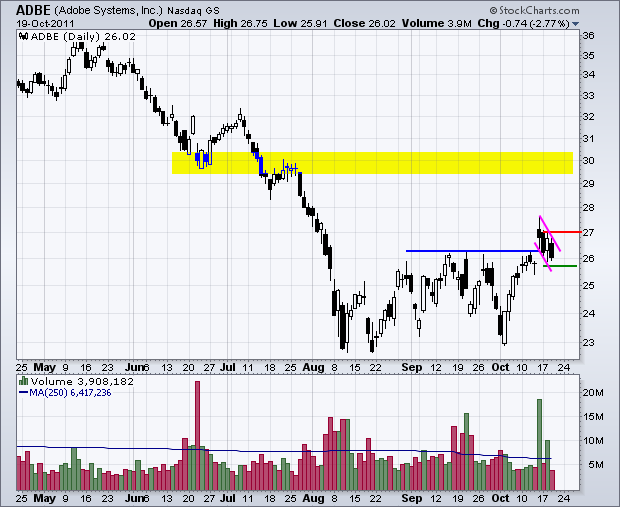
ADBE Forms Falling Flag after Surge. AGU Forms Bearish Engulfing in Resistance Zone. MDT Breaks Flag/Wedge Resistance with Volume... Read More
Art's Charts October 20, 2011 at 05:10 AM
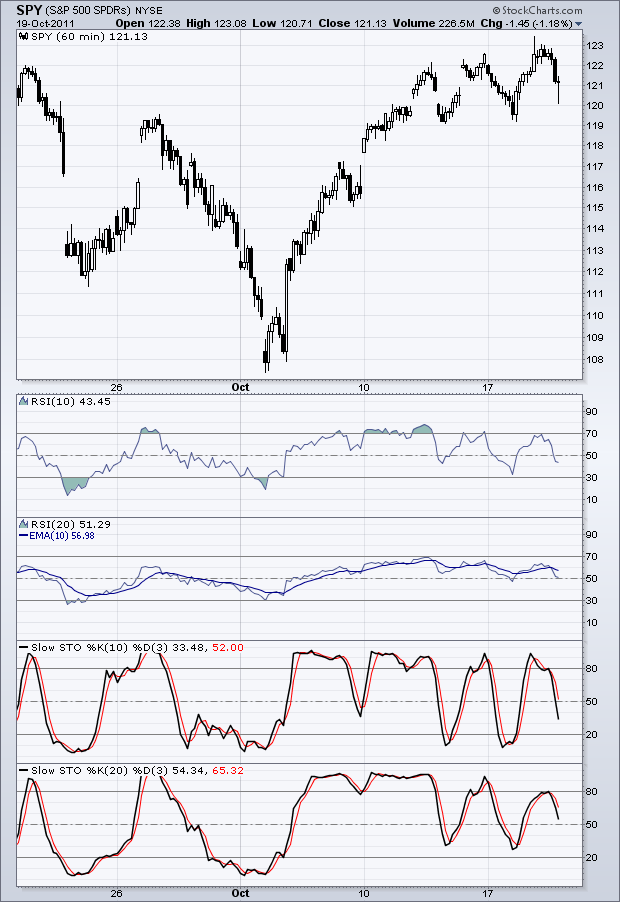
Indicators settings confront chartists with a conundrum. The number of periods used for an indicator affects the speed and the number of signals. For example, 20-period RSI will cross the centerline (50) fewer times than 10-period RSI... Read More
Art's Charts October 19, 2011 at 06:58 AM
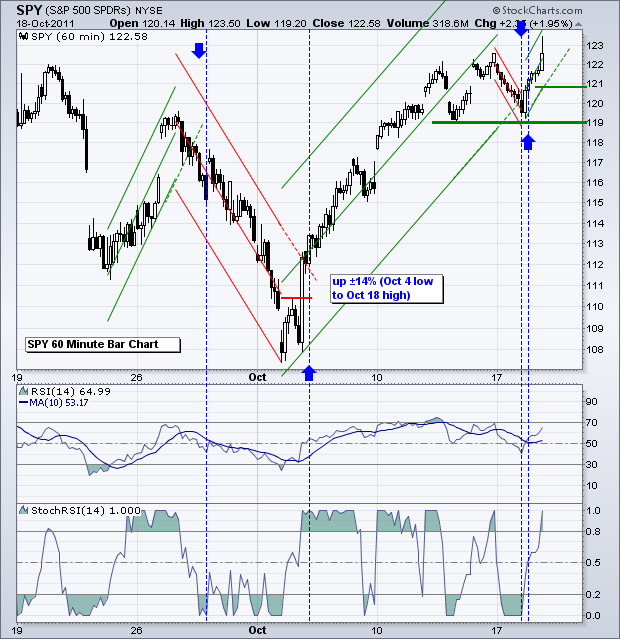
Stocks continued weak with a lower open on Tuesday, but quickly reversed and moved sharply higher the rest of the day. Selling pressure was limited to the first 30 minutes as the S&P 500 dipped below 1192 by 10AM. Things quickly changed... Read More
Art's Charts October 18, 2011 at 06:08 AM
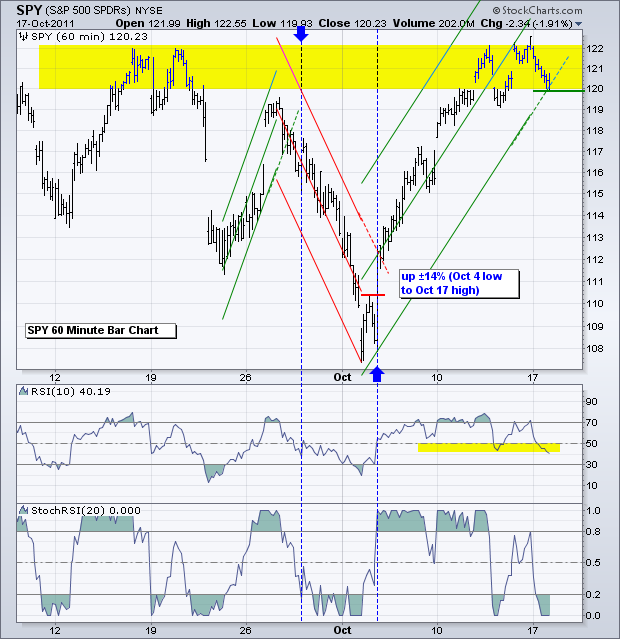
Momentum is changing as RSI and StochRSI moved into bear mode for IWM, QQQ and SPY. As noted last week, StochRSI is one of the most sensitive momentum oscillators, which means it is prone to false signals (whipsaws)... Read More
Art's Charts October 18, 2011 at 06:03 AM
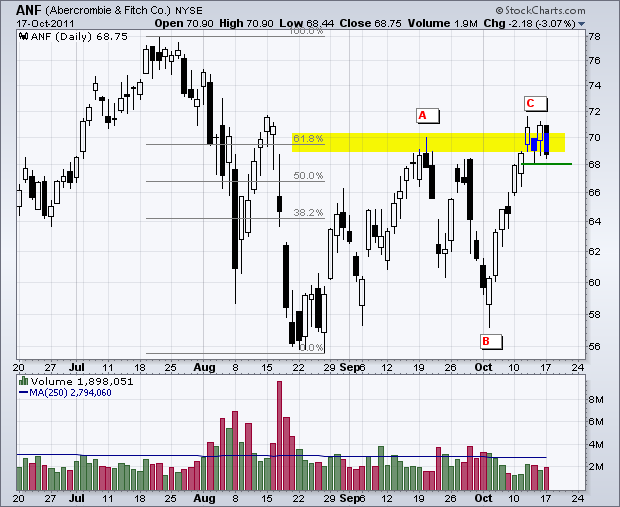
Careful out there. It is earnings seaon. CHRW Traces out ABC Zigzag Advance. ESRX Surges and Forms Bull Flag. FL Consolidates after Oversold Bounce. Plus ANF, CHS, PLCE, SKS This commentary and charts-of-interest are designed to stimulate thinking... Read More
Art's Charts October 17, 2011 at 04:52 AM
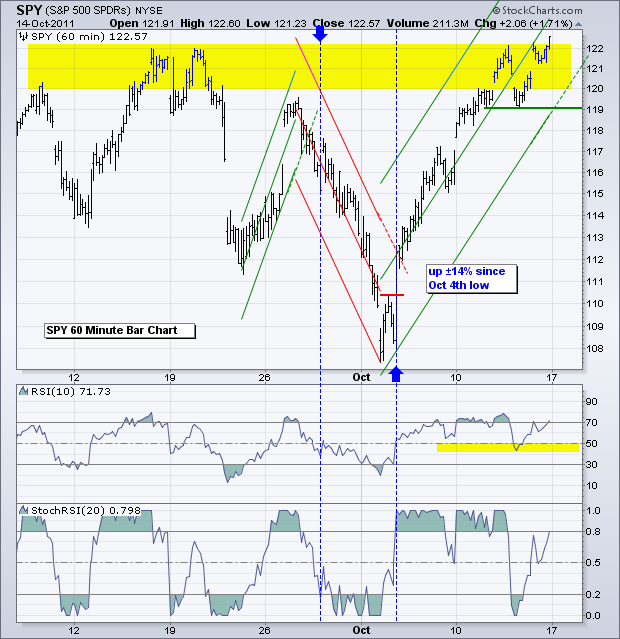
The markets remain in RISK-ON mode. This is bullish for the Euro, stocks, commodities and, perhaps, gold. This is bearish for the Dollar and Treasuries... Read More
Art's Charts October 14, 2011 at 06:22 AM
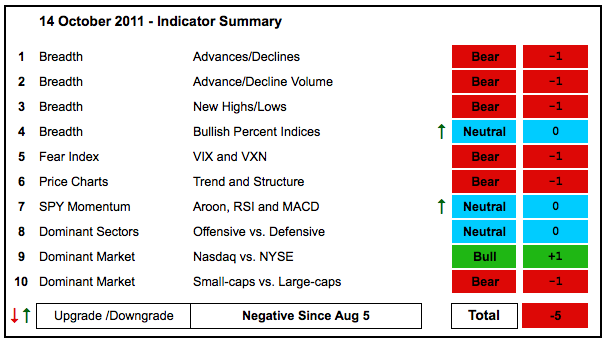
Stocks reversed last Tuesday and surged the last nine days, but this has not been enough to push the indicator summary into positive territory. Another week or two of strength would likely lead to resistance breakouts in the major index ETFs and some key breadth statistics... Read More
Art's Charts October 14, 2011 at 04:39 AM
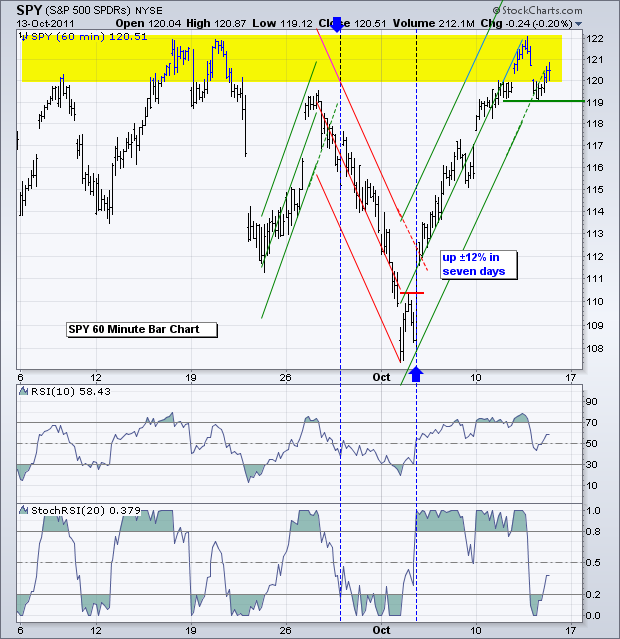
Upside momentum is weakening in the stock market, but the short-term swing remains up and we have yet to see an actual breakdown. There is often a pecking order to a trend reversal, even a short-term trend reversal... Read More
Art's Charts October 13, 2011 at 05:50 AM
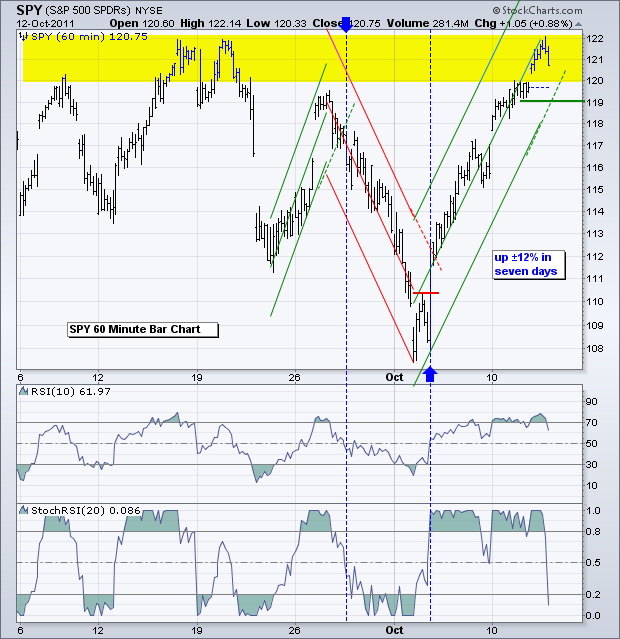
Stocks started the day with a bang, kept their gains most of the day and then sold off in the afternoon. With the S&P 500 ETF (SPY) up some 12% in seven days, the market is pricing in some pretty good news or some better-than-expected earnings reports... Read More
Art's Charts October 13, 2011 at 05:46 AM
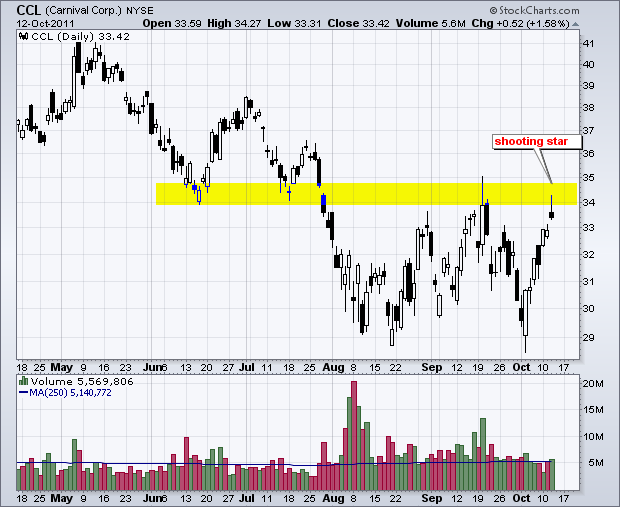
Careful, it is earnings season.... CCL Forms Shooting Star at Resistance. MCD Tracing out Bearish Engulfing with Uptick in Volume. WINN Consolidates after Bounce. Plus CHKP, FNSR, GRMN, SBUX This commentary and charts-of-interest are designed to stimulate thinking... Read More
Art's Charts October 12, 2011 at 04:25 AM
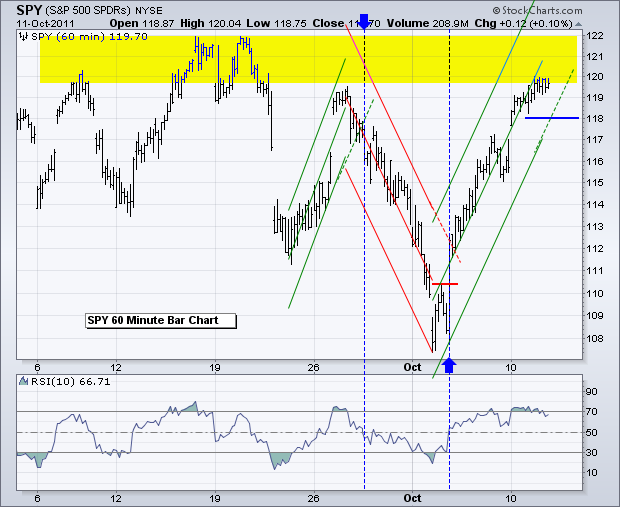
Earnings season kicked off on Tuesday and stocks stalled in mixed trading. A mere six days ago, the S&P 500 ETF (SPY) was trading around 108, just before the big Tuesday turnaround on October 4th... Read More
Art's Charts October 11, 2011 at 05:52 AM
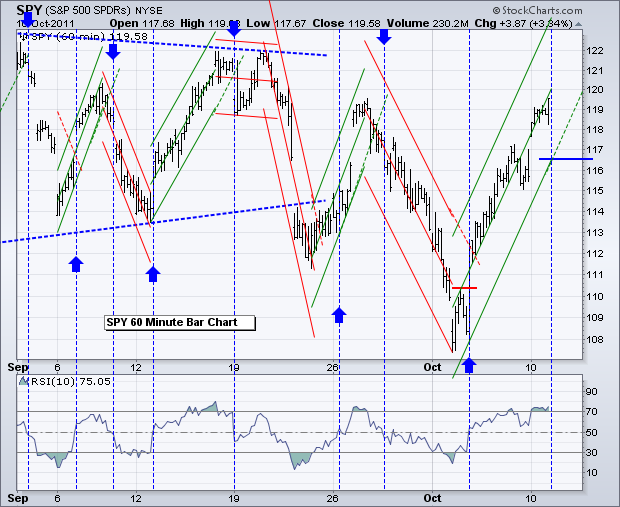
Stocks opened strong, remained strong and closed strong on Columbus Day. Unsurprisingly, volume was very light. This move keeps the short-term uptrends alive and allows for an extension of the rising channels... Read More
Art's Charts October 11, 2011 at 05:48 AM
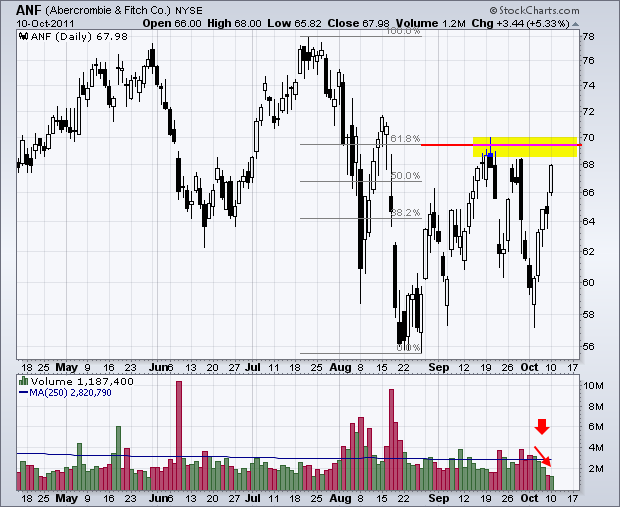
Careful, it is earnings season. ANF Surges to Resistance on Low Volume. EXPD Retraces 61.80% of Prior Decline. PX Surges into Resistance Zone. Plus LULU and MOLX. This commentary and charts-of-interest are designed to stimulate thinking... Read More
Art's Charts October 10, 2011 at 05:36 AM
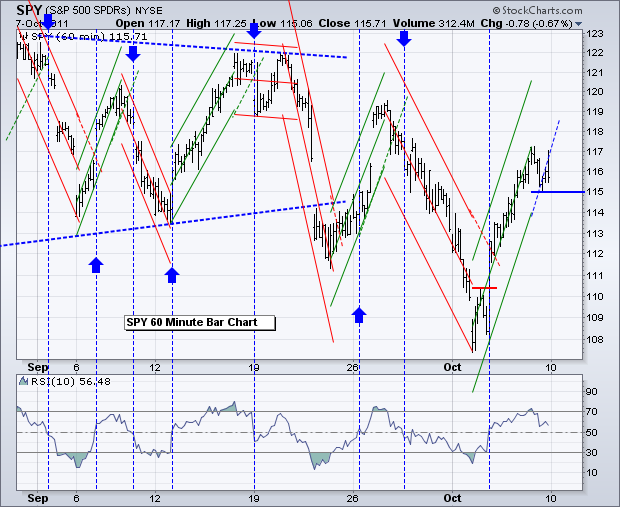
It is another week and we have yet another promise from EU leaders. Dexia Bank passed the European stress test a few months ago and went belly up last week. This weekend we saw another flurry of pledges and deadlines to fixed the European debt situation... Read More
Art's Charts October 07, 2011 at 07:05 AM
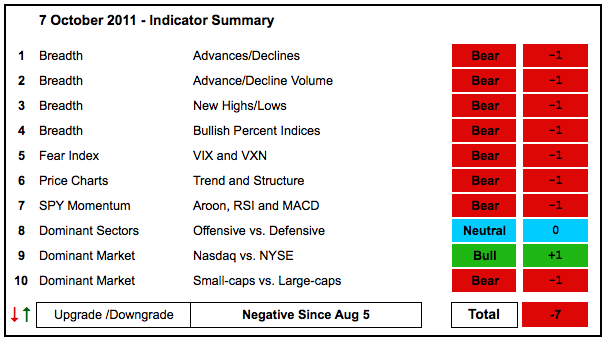
Despite a big reversal on Tuesday and good gains Wednesday-Thursday, the Indicator Summary remains decidedly negative. These gains simply erased the losses from Monday and the gain for the week is still modest compared to recent volatility... Read More
Art's Charts October 07, 2011 at 05:14 AM
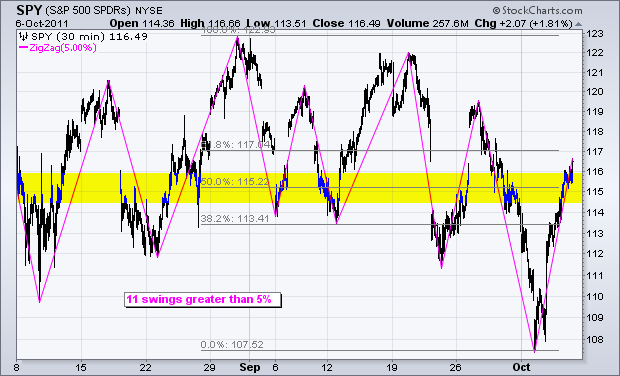
There is nothing to do now, but wait for the market's reaction to the employment report. The current swing for stocks remains up. Since early August, the S&P 500 ETF (SPY) has 11 swings that are at least 5 percent... Read More
Art's Charts October 06, 2011 at 05:45 AM
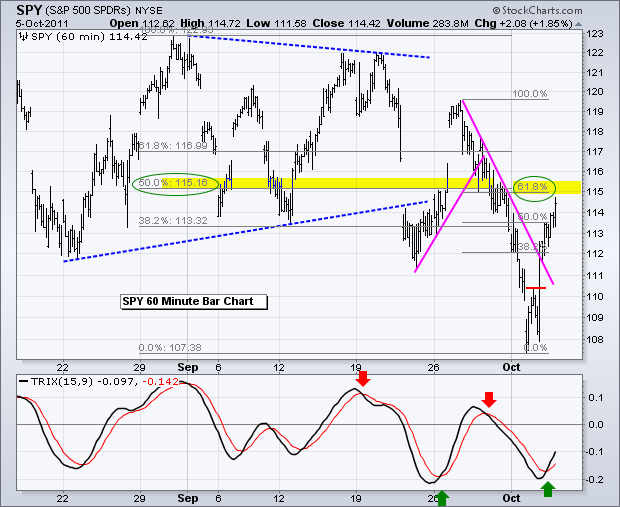
The current upswing continued as stocks added to Tuesday's gains. All major index ETFs were up over 1%, but the Russell 2000 ETF (IWM) lagged with the smallest gain. Unsurprisingly, the Nasdaq 100 ETF (QQQ) led the way higher with a 2.57% gain... Read More
Art's Charts October 06, 2011 at 05:37 AM
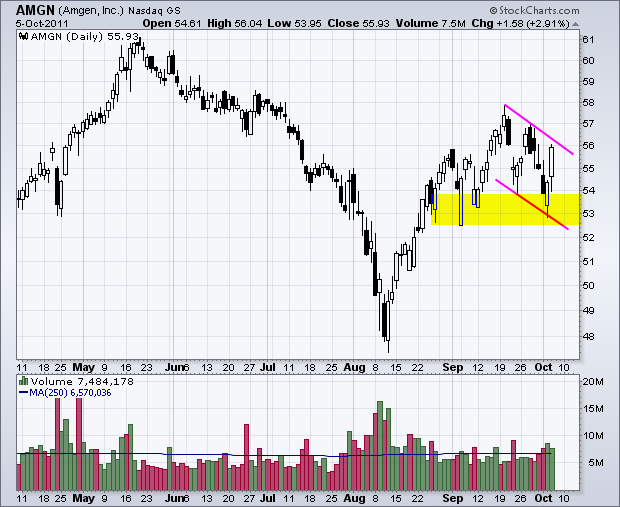
FLIR Forms Bullish Engulfing at Key Retracement. LRCX Breaks Triangle Resistance. PFE Breaks Channel Resistance with Volume. Plus AMGN, ASEI, LRCX, TTWO This commentary and charts-of-interest are designed to stimulate thinking... Read More
Art's Charts October 05, 2011 at 04:54 AM
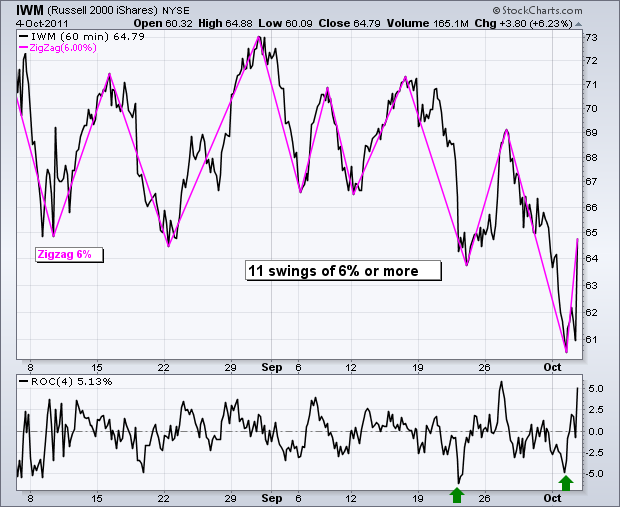
There it is again. Stocks were down sharply in afternoon trading and then mounted a spectacular advance in the final 50 minutes. Press reports attributed this turnaround to an article in the FT... Read More
Art's Charts October 04, 2011 at 05:10 AM
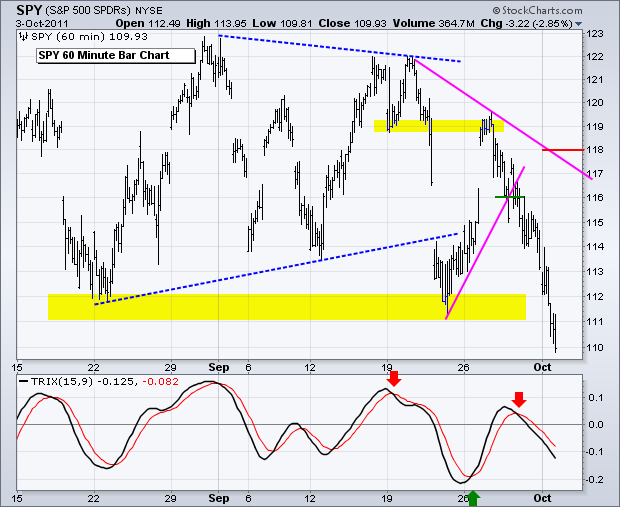
The S&P 500 ETF (SPY), Nasdaq 100 ETF (QQQ) and Russell 2000 ETF (IWM) all broke below their September lows on Monday. IWM led the market lower with a break below its early August lows... Read More
Art's Charts October 04, 2011 at 05:05 AM
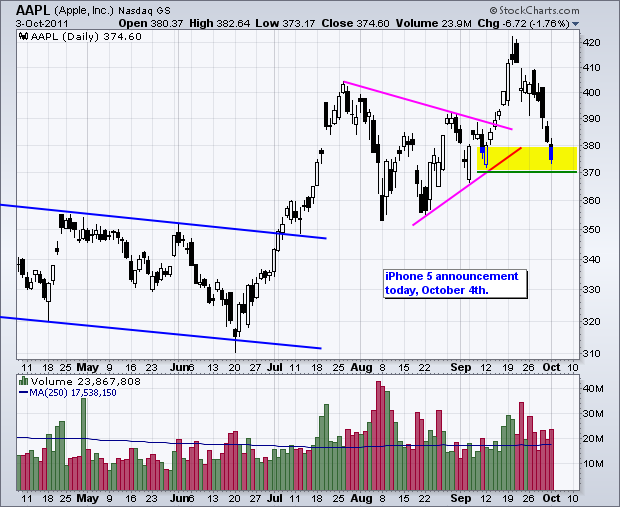
AAPL Hits Congestion Zone as iPhone Announcement Looms. CHRW Forms Triangle within Downtrend. PG Backs off Resistance Again. Plus CMCSA, HOG, PLCE This commentary and charts-of-interest are designed to stimulate thinking... Read More
Art's Charts October 03, 2011 at 06:31 AM
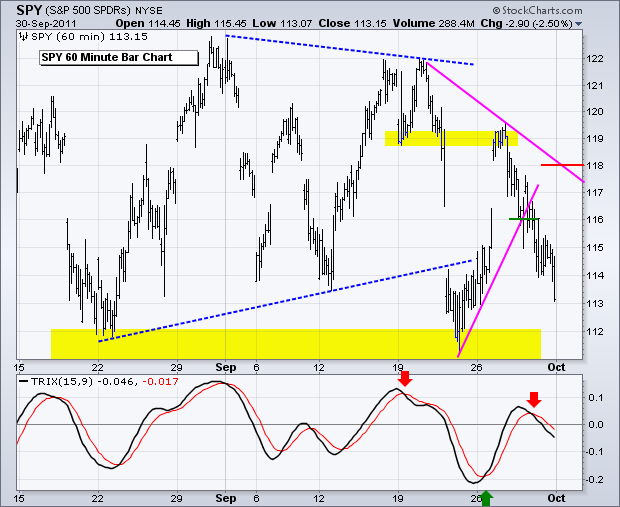
The S&P 500 ETF (SPY) broke down with a move below 114, but surged right back to broken support in the 119 area. Talk about a vicious bull trap. The ETF ultimately formed a lower high below 120 and moved sharply lower the last three days... Read More