Art's Charts September 28, 2012 at 05:46 AM
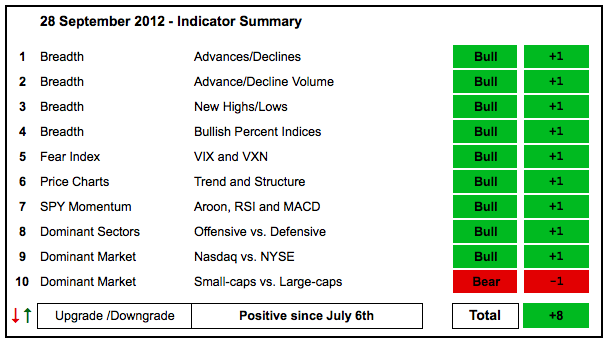
There is no change in the indicator summary, but the market is looking a bit tired and perhaps ripe for a correction or consolidation period. The Nasdaq AD Volume Line did not come close to its spring high and the NYSE AD Volume Line hit resistance from its spring high... Read More
Art's Charts September 28, 2012 at 04:26 AM
Stocks rebounded across the board with the hardest hit groups getting the biggest pops. The Nasdaq 100 ETF (QQQ) led the way with a 1.38% bounce. Eight of nine sectors were up with energy leading the way on the heels of a big oversold bounce in crude... Read More
Art's Charts September 27, 2012 at 05:08 AM
Stocks continued lower with modest losses in the major index ETFs. The Nasdaq 100 ETF (QQQ) led the way lower with a .81% decline. Eight of nine sectors moved lower with energy and technology leading the way... Read More
Art's Charts September 27, 2012 at 05:04 AM
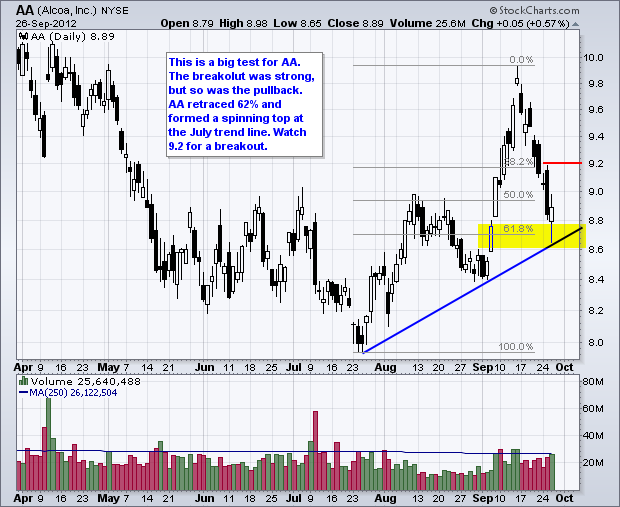
AA Returns to Breakout for Big Test. AMX Firms with Good Upside Volume. Plus DLTR, MMM, MSFT, NVDA This commentary and charts-of-interest are designed to stimulate thinking... Read More
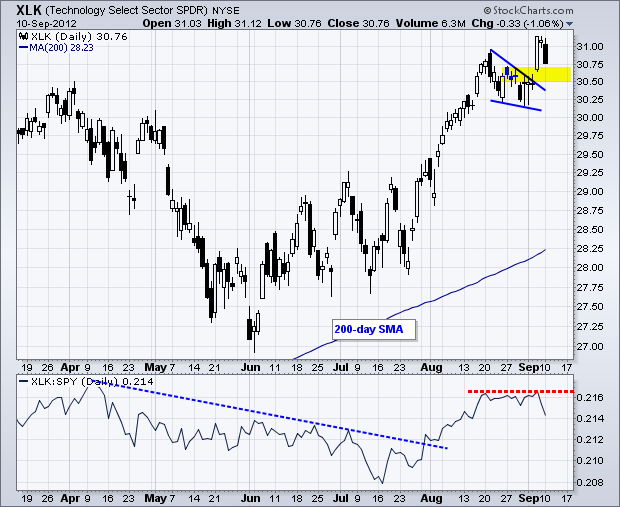
Art's Charts September 26, 2012 at 04:28 AM
Stocks ended their meandering ways with some downside direction on Tuesday. The Nasdaq 100 ETF (QQQ) and Russell 2000 ETF (IWM) led the way lower with losses around 1.4%. All nine sectors were lower with the Technology SPDR (XLK) and Finance SPDR (XLF) leading the way... Read More
Art's Charts September 25, 2012 at 05:02 AM
Stocks continued their meandering ways on Monday. There is, however, a slight downward slant in this meandering. IWM and SPY peaked on 14-Sept and worked their way lower the last six days... Read More
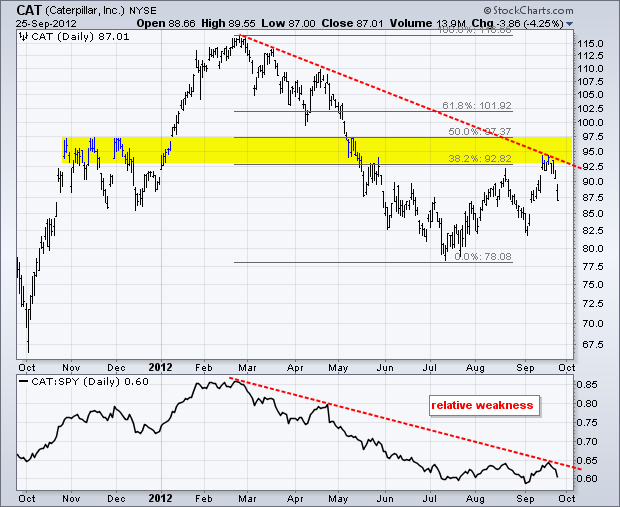
Art's Charts September 25, 2012 at 04:55 AM
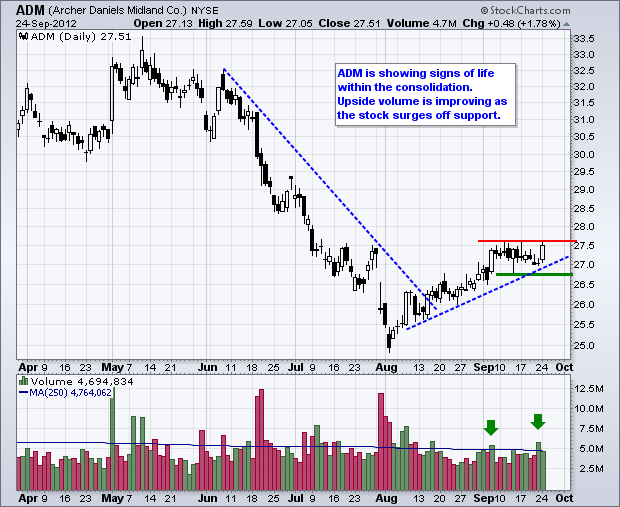
AMAT Breaks Support with Gap. TE Surges on Good Volume. Plus ADM, APOL, CMS, CNL, TEVA, TYC, WCRX, XRAY This commentary and charts-of-interest are designed to stimulate thinking... Read More
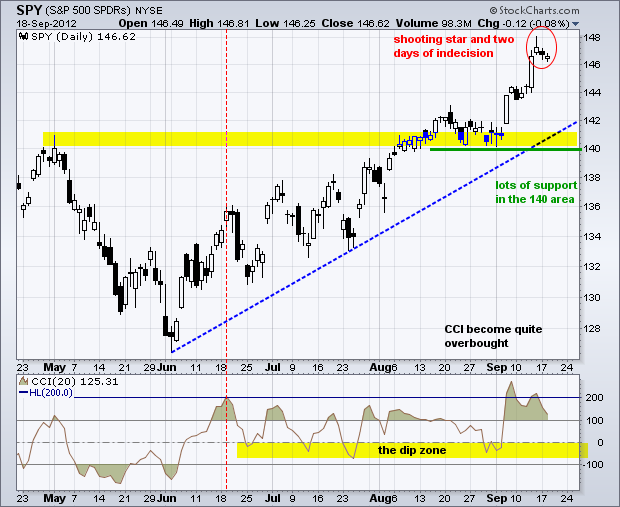
Art's Charts September 24, 2012 at 06:12 AM
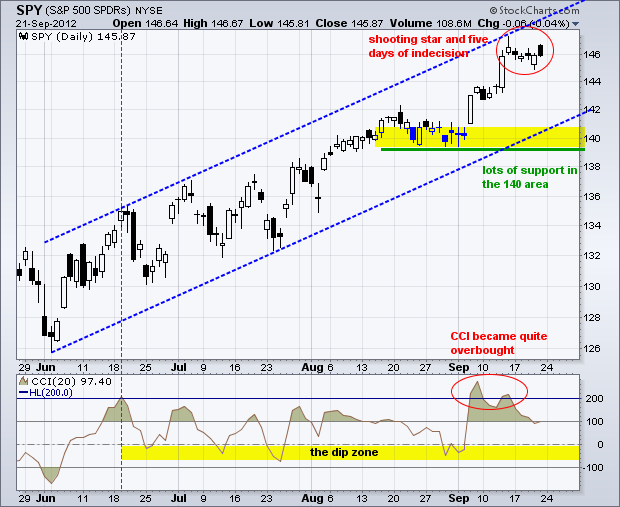
Last week was the week that was not. Stocks surged on Thursday, September 13th, and then stalled the next six days. This indecisive period started as SPY formed a shooting start on Friday, September 14th. The ETF formed small candlesticks on Monday, Tuesday and Wednesday... Read More
Art's Charts September 21, 2012 at 06:40 AM
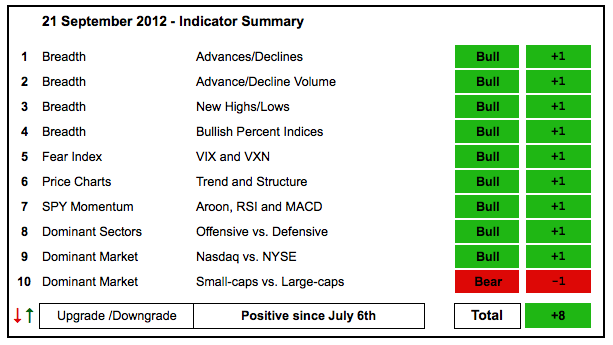
With new highs last week and flat trading this week, there is no change in the indicator summary. Even though the bulk of the evidence remains bullish, I am concerned with overbought conditions and some extremes starting to appear in the sentiment indicators... Read More
Art's Charts September 21, 2012 at 05:30 AM
Thursday marked the fourth uneventful day this week as stocks finished mixed yet again. The Dow Industrials SPDR (DIA) and S&P 100 ETF (OEF) edged higher, but the Russell 2000 ETF (IWM) and S&P MidCap SPDR (MDY) closed modestly lower... Read More
Art's Charts September 20, 2012 at 05:34 AM
Stocks finished the day mixed on Wednesday as indecision extended for the third day running. The Russell 2000 ETF (IWM) edged lower, while the S&P 500 ETF (SPY) closed fractionally higher. The sectors were mixed with six up and three down... Read More
Art's Charts September 20, 2012 at 05:29 AM
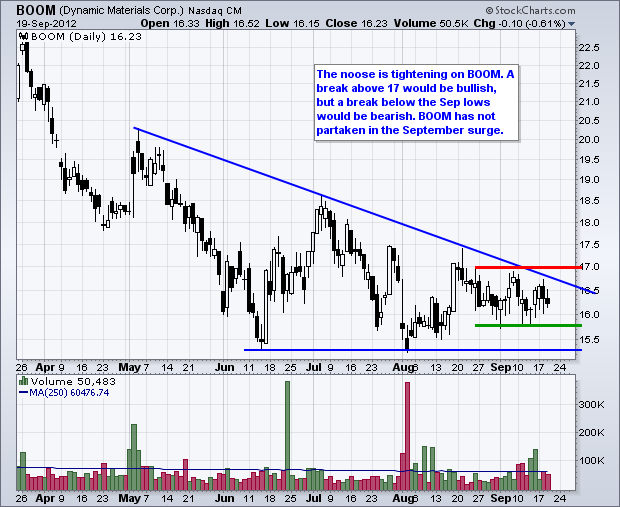
The Noose Narrows for BOOM. Downside Volume Expands for NKE. Plus CIEN, DAN, INTU This commentary and charts-of-interest are designed to stimulate thinking. This analysis is not a recommendation to buy, sell, hold or sell short any security (stock ETF or otherwise)... Read More
Art's Charts September 19, 2012 at 04:21 AM
The stock index ETFs continued to drift on Tuesday. After the surge from Thursday afternoon to Friday morning, stocks have been drifting for almost three days. Such a drift is not uncommon after a big move... Read More
Art's Charts September 18, 2012 at 05:33 AM
The major index ETFs are in uptrends and overbought. In general, it is much better to pick bottoms than tops in uptrend. Even though SPY, QQQ and IWM are overbought and ripe for a pullback, picking a short-term top is challenging when the bigger trend is clearly up... Read More
Art's Charts September 18, 2012 at 05:26 AM
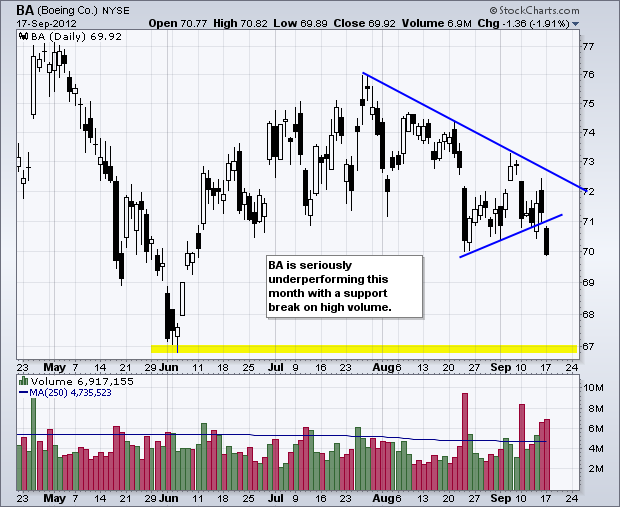
BA Underperforms with Support Break. POT Challenges Channel Resistance. Plus CHK, DAL, NVDA, POT, SBUX, TYC This commentary and charts-of-interest are designed to stimulate thinking... Read More
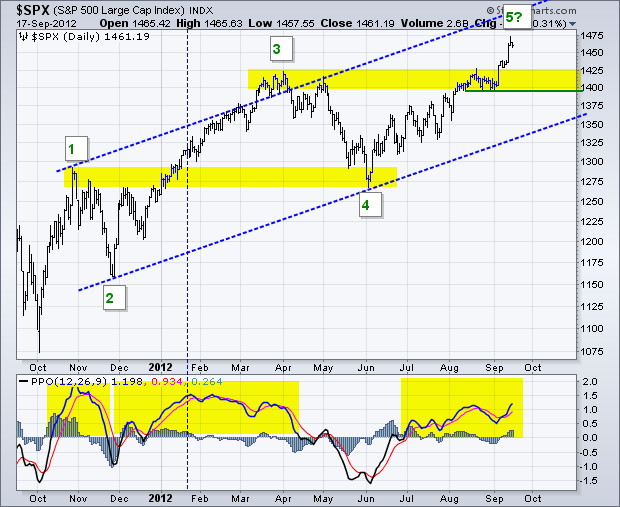
Art's Charts September 17, 2012 at 05:49 AM
Is it really this easy? Does another round of quantitative easing insure higher equity prices over the next few months? Well, the stock market agrees as the major index ETFs hit new highs last week and remain in clear uptrends... Read More
Art's Charts September 14, 2012 at 04:55 AM

With new highs in the major index ETFs, there is little doubt where the bulk of the evidence lies. The bulls are clearly in charge of this market right now... Read More
Art's Charts September 14, 2012 at 04:02 AM
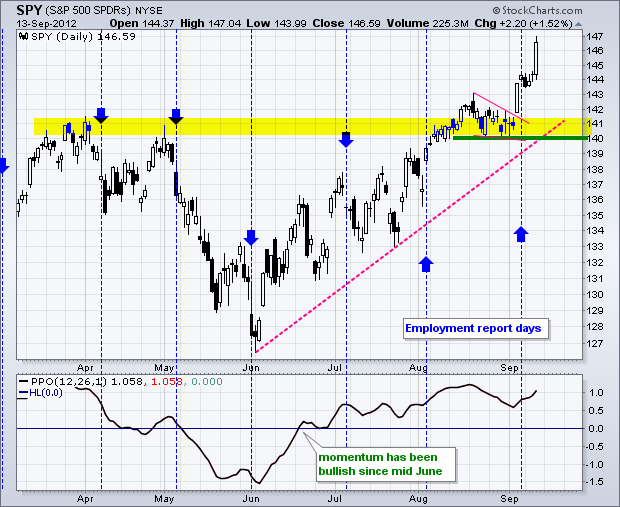
Judging from the reaction, it appears that the stock market is quite happy with a third round of quantitative easing. The major index ETFs surged with the S&P 500 ETF (SPY) and Dow Industrials SPDR (DIA) gaining around 1.5%... Read More
Art's Charts September 13, 2012 at 04:55 AM
Stocks meandered again on Wednesday and then closed with small gains. All of the major index ETFs were up with the S&P MidCap 400 SPDR (MDY) leading the way (up a mere .52%). Six of the nine sectors were higher with the Energy SPDR (XLE) and Technology SPDR (XLK) leading the way... Read More
Art's Charts September 13, 2012 at 04:50 AM
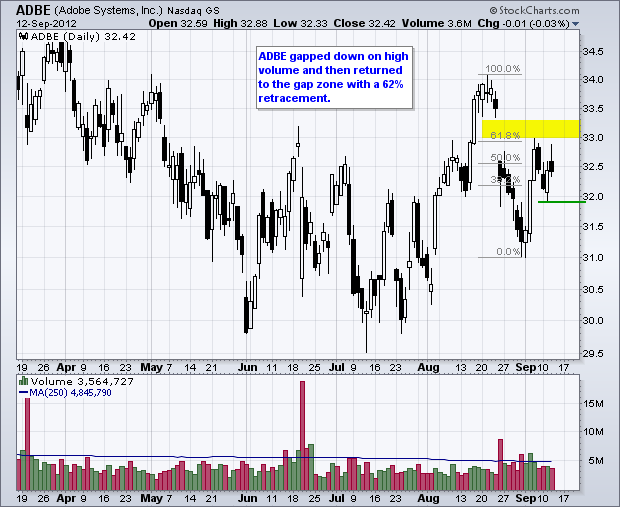
ADBE Hits Resistance in Gap Zone. LUV Forms Triangle after Surge. Plus GRMN, QCOM, SKUL This commentary and charts-of-interest are designed to stimulate thinking. This analysis is not a recommendation to buy, sell, hold or sell short any security (stock ETF or otherwise)... Read More
Art's Charts September 12, 2012 at 03:58 AM
Stocks meandered around in positive territory on Monday and ended the day with small gains. A little indecision is understandable given the recent gains and the news flow over the next few days... Read More
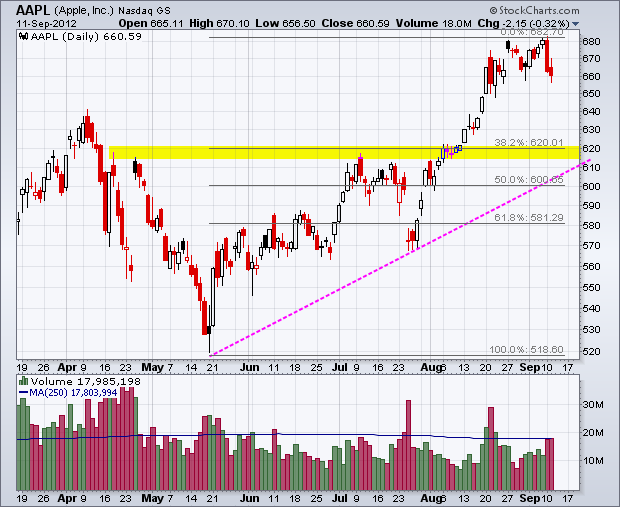
Art's Charts September 11, 2012 at 05:05 AM
Stocks moved lower on Monday as traders booked some profits from last week's rally. The Nasdaq 100 ETF led the way lower as Apple's big event approaches. Apple investors appear to be getting cold feet as the stock fell over 2% on Monday... Read More
Art's Charts September 11, 2012 at 04:59 AM
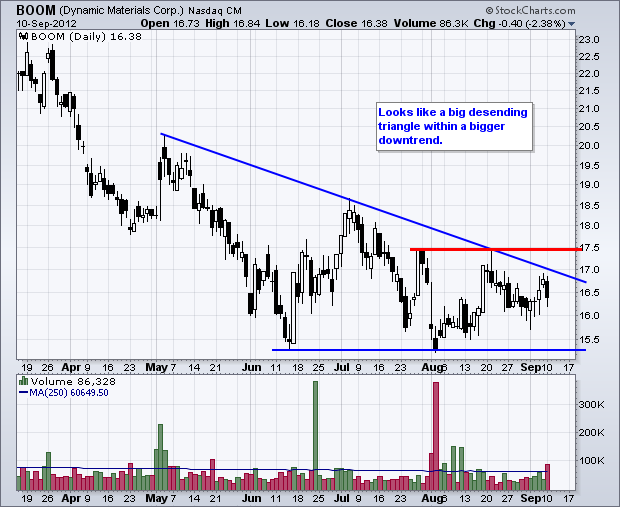
BOOM forms large descending triangle. KLAC gaps and forms bear flag. Plus BRCM, CSX, DUK, MCHP, MDR This commentary and charts-of-interest are designed to stimulate thinking... Read More
Art's Charts September 10, 2012 at 05:40 AM
Stocks extended their gains on Friday and the S&P 500 finished with its biggest weekly gain since early July. This key benchmark index cleared its spring highs and closed at a 52-week high on Friday. Five of the nine sector SPDRs were up on Friday... Read More
Art's Charts September 10, 2012 at 01:38 AM
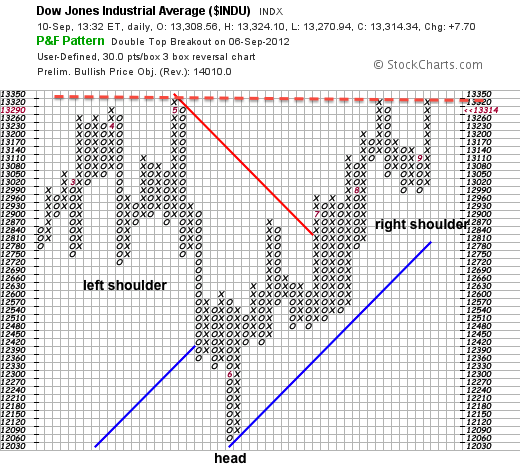
The P&F chart below shows the Dow Industrials using 30 points per box and a three box reversal method. With the August dip and September surge, the Dow is challenging the prior highs and tracing out a large inverse head-and-shoulders pattern... Read More
Art's Charts September 07, 2012 at 05:51 AM
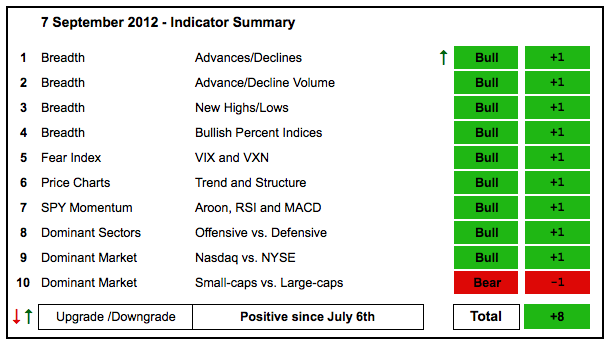
With a big surge on Thursday, stocks broke out of their funk and the indicator summary improved a notch. Techs continue to lead the market overall... Read More
Art's Charts September 07, 2012 at 04:57 AM
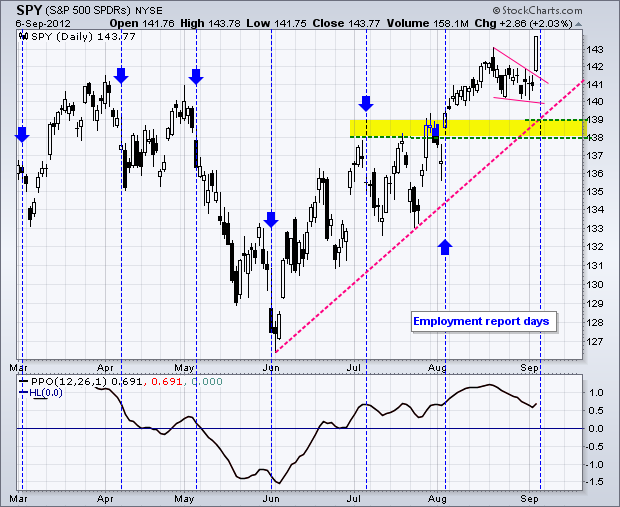
A mixed up Wall Street turned into a raving bull as stocks surged ahead of today's employment report. Rumor has it that Super Mario, Draghi, not Gabelli, inspired the bulls. It kind of makes the employment report an after thought... Read More
Art's Charts September 06, 2012 at 05:00 AM
It was another mixed day on Wall Street as stocks meandered on either side of unchanged. The major index ETFs were mixed as well with the Dow Industrials SPDR (DIA) and Russell 2000 ETF (IWM) edging higher, but the Nasdaq 100 ETF (QQQ) and S&P MidCap 400 SPDR (MDY) edged lower... Read More
Art's Charts September 06, 2012 at 04:54 AM
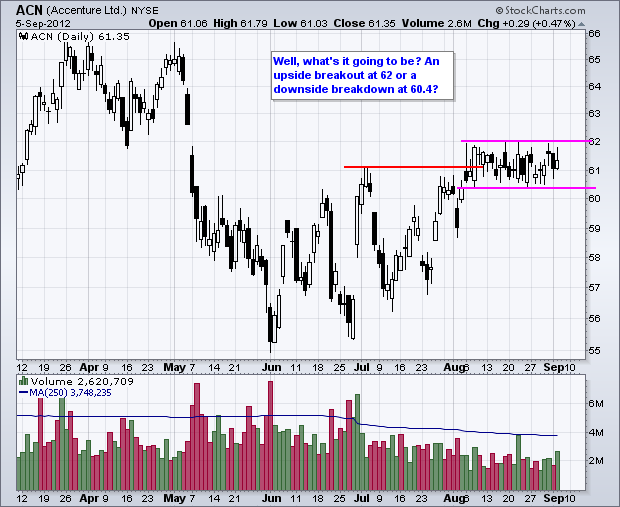
BCR Breaks Consolidation Resistance with Good Volume. XRX Forms Pennant Near Key Retracement. Plus ACN, ANF, BG, HSP This commentary and charts-of-interest are designed to stimulate thinking... Read More
Art's Charts September 05, 2012 at 04:18 AM
Economic reports triggered some early selling pressure, but stocks managed to rebound with small-caps leading the charge. The ISM Manufacturing Index showed weakness as the key indicator dipped below 50 (49.6)... Read More
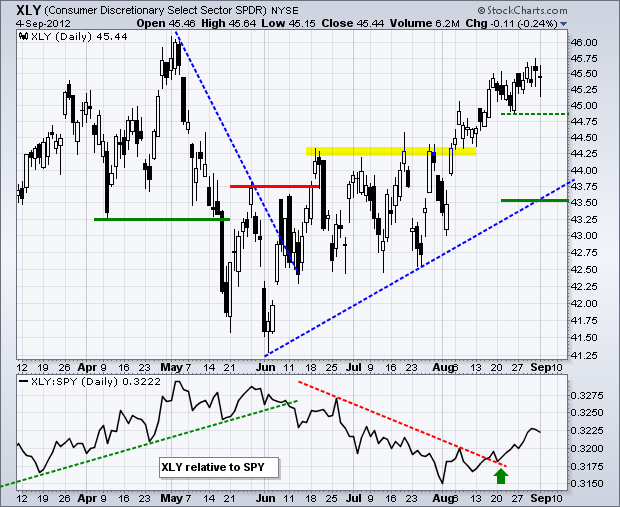
Art's Charts September 04, 2012 at 05:41 AM
The major index ETFs surged the first two weeks of August and then consolidated the last two weeks. With the medium-term trends clearly up, the odds favor a bullish resolution to these consolidations... Read More
Art's Charts September 04, 2012 at 05:22 AM
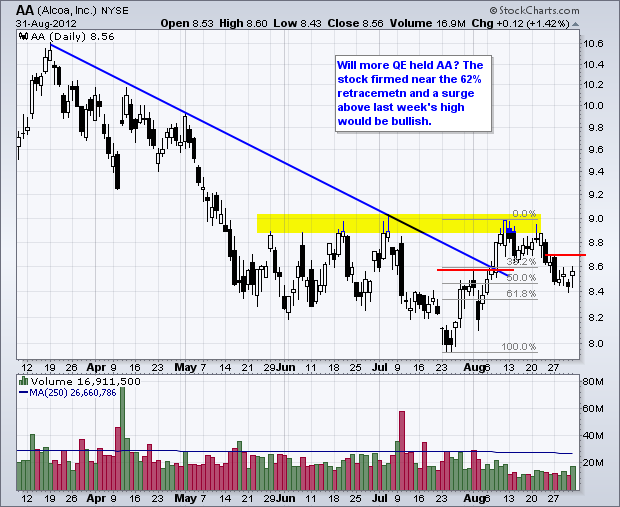
AA Firms at 61.80% Retracement. EA Surges off Broken Resistance with Big Volume. Plus AMTD, APC, DHR, MSFT, UNM This commentary and charts-of-interest are designed to stimulate thinking... Read More