Art's Charts February 28, 2013 at 04:43 AM
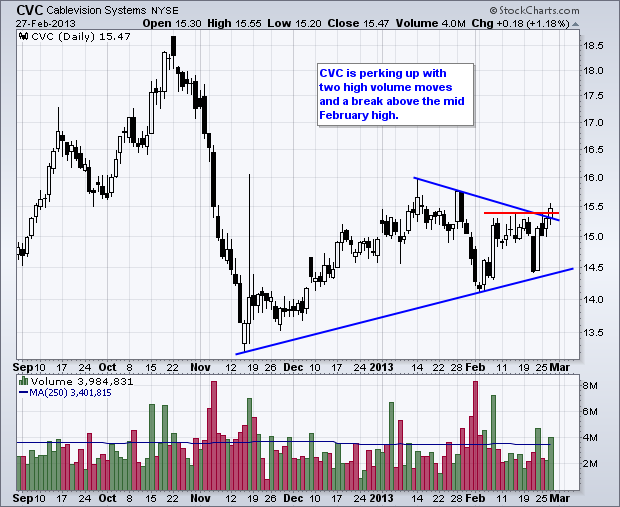
IBM Breaks Wedge Resistance with Good Volume. VRTX Surges off Support with High Volume. Plus CVC, CY, USB This commentary and charts-of-interest are designed to stimulate thinking... Read More
Art's Charts February 28, 2013 at 03:51 AM
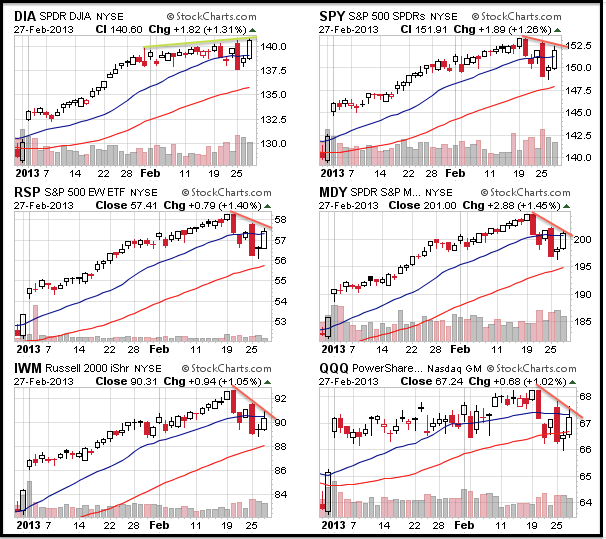
The Dow led the market on Wednesday with a surge above 14000. Despite some sizable moves in the major index ETFs, only the Dow SPDR (DIA) cleared its prior highs and closed at its highest level for the month. Note that SPY, RSP, MDY, IWM and QQQ have yet to exceed Monday's high... Read More
Art's Charts February 27, 2013 at 05:40 AM
Stocks were quite oversold after Monday's big plunge and managed to bounce on Tuesday. Even though the market was ripe for this bounce, there were a few fundamental factors contributing to the rebound... Read More
Art's Charts February 26, 2013 at 06:05 AM
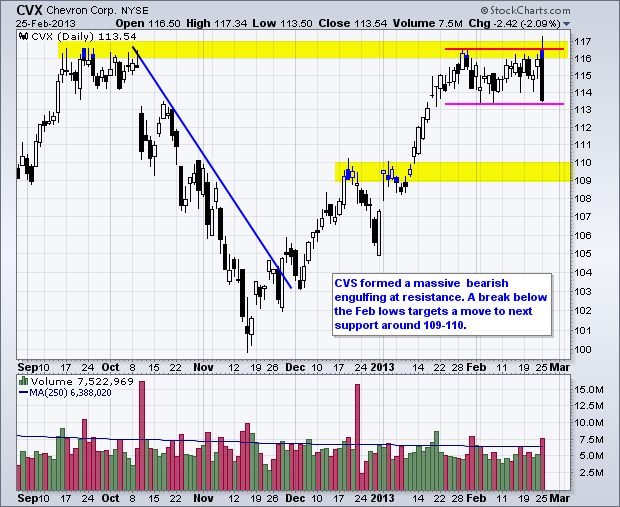
CVX Forms Big Bearish Engulfing at Resistance. DLTR Bases with Large Triangle Plus FISV, FLEX, HST, SKS, SNA, TIF This commentary and charts-of-interest are designed to stimulate thinking... Read More
Art's Charts February 26, 2013 at 03:42 AM
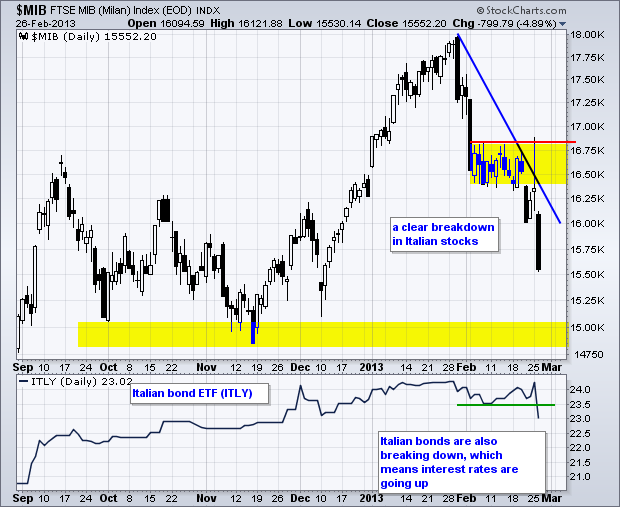
Stocks surged on the open, quickly weakened and then plunged in the final hour. We all know where the blame went. Even though the Italian elections took the rap, note that the Euro has been falling since 4-Feb and Italian stocks are down around 10% over the past month... Read More
Art's Charts February 25, 2013 at 03:42 AM
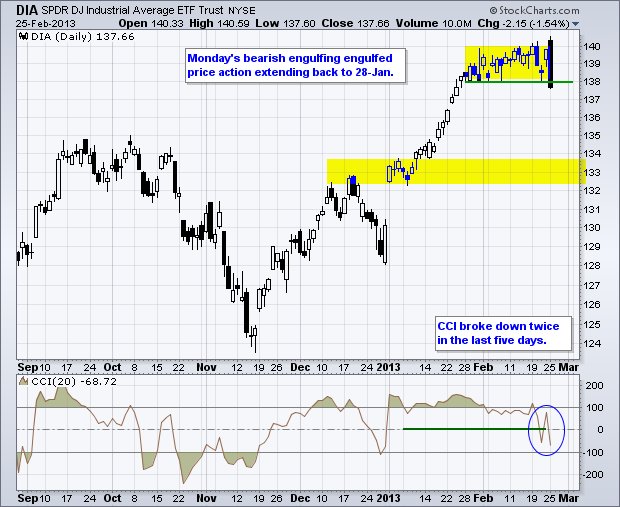
It was a short, but wild, week for stocks. The major index ETFs started strong on Tuesday, plunged on Wednesday-Thursday and then rebounded on Friday... Read More
Art's Charts February 22, 2013 at 06:04 AM
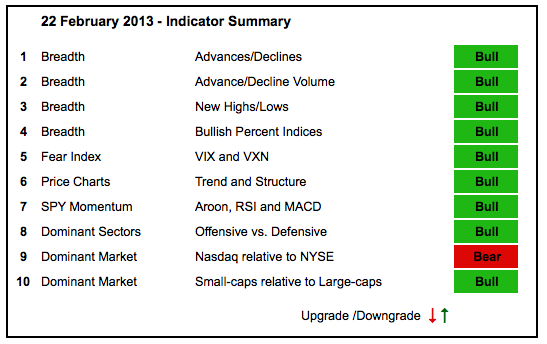
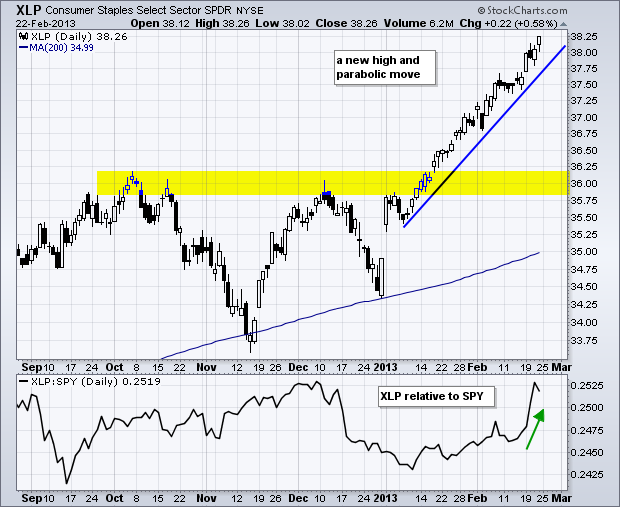
The major index ETFs and indicators took hits this week, but there is no change in the overall picture. The major index ETFs, AD Lines and AD Volume Lines hit multi-month highs this month and pulled back sharply this week... Read More
Art's Charts February 22, 2013 at 04:20 AM
Stocks moved lower again on Thursday with the Nasdaq 100 Equal-Weight ETF (QQEW) leading the way (down 1.22%). This means techs as a whole were relatively weak. Small-caps were also relatively weak with the Russell 2000 ETF (IWM) falling around 1%... Read More
Art's Charts February 21, 2013 at 05:31 AM
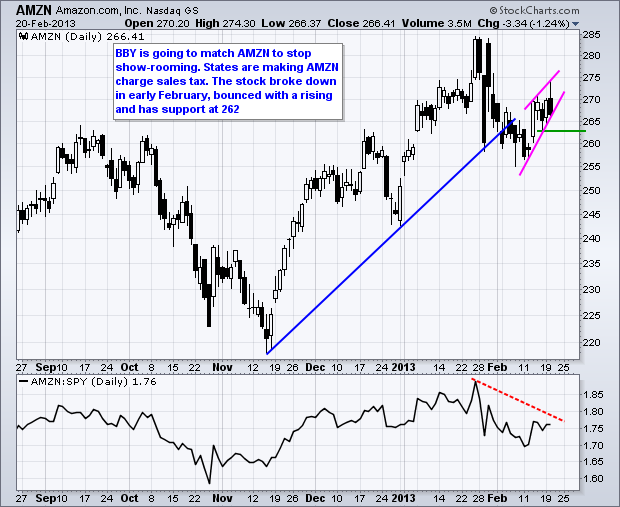
AMZN Forms Bearish Wedge. COL Tests Support in the Face of Sequester. Plus JBHT, NAT, NOC, PX This commentary and charts-of-interest are designed to stimulate thinking. This analysis is not a recommendation to buy, sell, hold or sell short any security (stock ETF or otherwise)... Read More
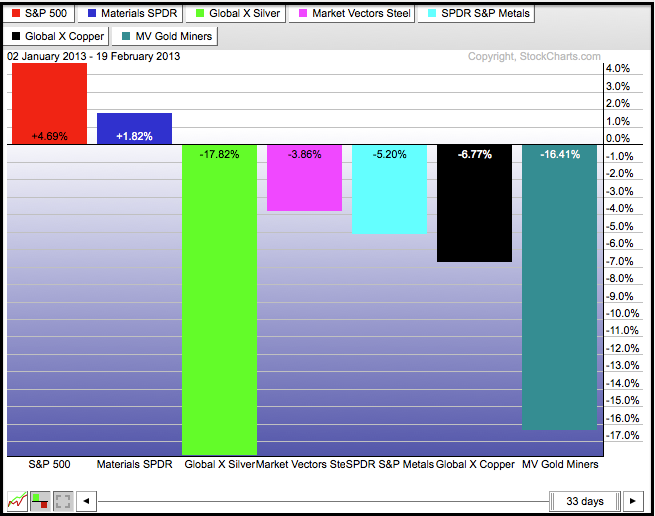
Art's Charts February 21, 2013 at 05:04 AM
Stocks were weak in early trading and then got slammed in the afternoon. In addition to overbought conditions, several factors contributed to the afternoon sell off. Industrial metals fell sharply over the last few days due to concerns with Chinese economic growth... Read More
Art's Charts February 20, 2013 at 04:28 AM
Stocks marched higher again on Tuesday with small-caps leading the way. The Russell 2000 ETF (IWM) gained .88% and the S&P Small-cap ETF (IJR) advanced 1.10% on the day. Techs also participated with the Nasdaq 100 ETF (QQQ) hitting a new high for 2013... Read More
Art's Charts February 19, 2013 at 06:15 AM
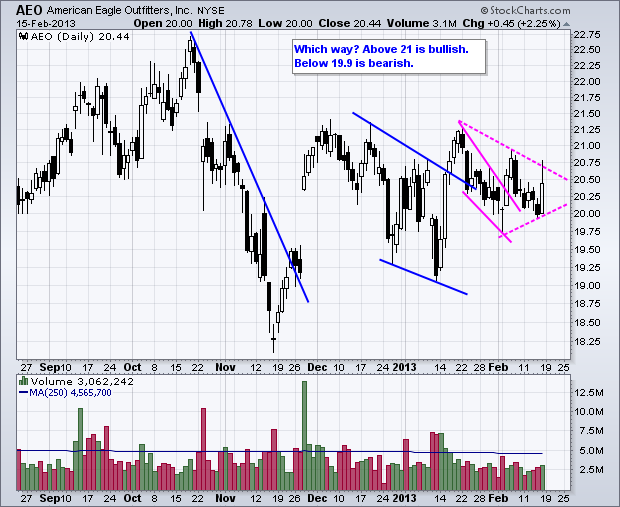
CY Forms Descending Triangle. NVDA Surges above Resistance on Good Volume. Plus AEO, ARO, ESRX, V This commentary and charts-of-interest are designed to stimulate thinking... Read More
Art's Charts February 19, 2013 at 04:27 AM
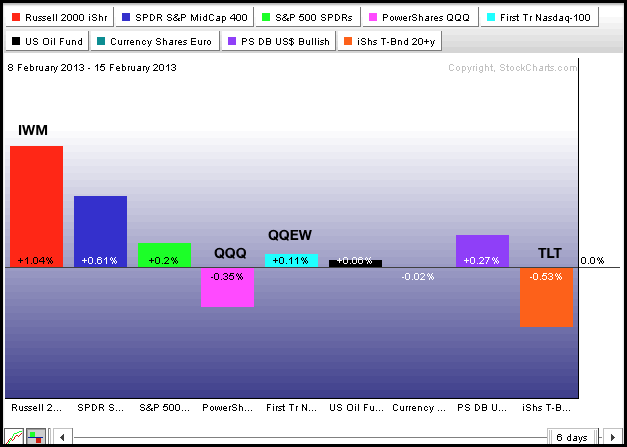
US stocks held up last week, but the advance certainly slowed. IWM led the market with a 1.04% gain last week. SPY was mostly flat with a .20 advance. QQQ declined .35% and QQEW lagged SPY with a .11% gain... Read More
Art's Charts February 15, 2013 at 05:10 AM

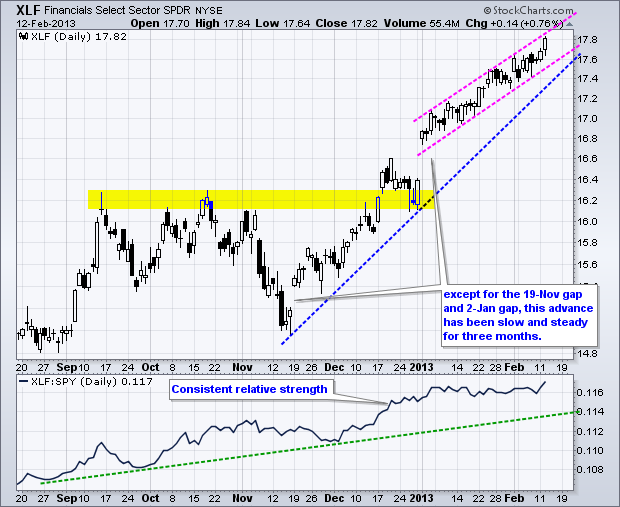
There is no change in the indicator summary because the market did not move much this week. Despite little movement, IWM, MDY, XLF and several other key ETFs hit new highs. The uptrend, or rather grind higher, continues... Read More
Art's Charts February 15, 2013 at 03:59 AM
It was another mixed day overall,but the Russell 2000 ETF (IWM) edged to another 52-week high with a .25% gain. The ETF is now up seven of the last ten days this month. Even though the daily gains have been relatively small, IWM is up 3.08% since its 31-January... Read More
Art's Charts February 14, 2013 at 06:35 AM
Guess what? Stocks were mixed again on Wednesday. The Dow Industrials SPDR (DIA) edged lower, while the S&P 500 ETF (SPY) and other major index ETFs edged higher. Once again, "edged" is the key word here because price movements were miniscule... Read More
Art's Charts February 14, 2013 at 05:04 AM
JCP Shows Interesting Volume Trend the Last Five Weeks. LULU Forms Pennant Near Support. Plus AFFX, ARO, TIBX This commentary and charts-of-interest are designed to stimulate thinking... Read More
Art's Charts February 13, 2013 at 08:58 AM
Stocks were mixed again on Tuesday. The Nasdaq 100 ETF (QQQ) edged lower because Apple was weak, but the S&P 500 ETF (SPY) edged higher because financials were strong... Read More
Art's Charts February 12, 2013 at 05:31 AM
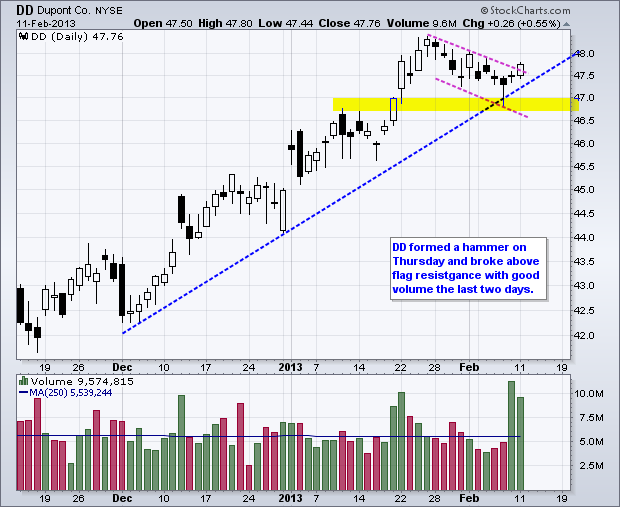
DD Breaks Wedge Resistance with Good Volume. SCTY Surges above Triangle Trend Line. Plus FB, GT, ILMN, INTC, PCS, SSYS This commentary and charts-of-interest are designed to stimulate thinking... Read More
Art's Charts February 12, 2013 at 04:24 AM
Stocks were mixed on Monday with the S&P 500 ETF (SPY) edging lower (.02%) and the S&P 500 Equal-Weight ETF (RSP) edging higher (.03%). Yes, it was a mixed, and dull, day. The sector SPDRs were also mixed and the moves were small... Read More
Art's Charts February 11, 2013 at 05:27 AM
Stocks bucked the intermarket headwinds and mixed economic data to finish positive again last week. The S&P 500 ETF (SPY) and the Russell 2000 ETF (IWM) are now up six consecutive weeks... Read More
Art's Charts February 08, 2013 at 05:17 AM
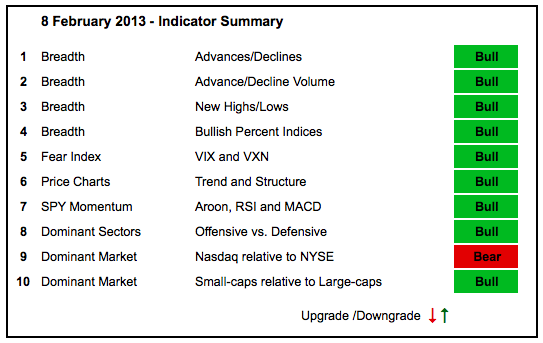
There is no change in the indicator summary because the market did not move much this week. Stocks have been in a stalling pattern the last two weeks... Read More
Art's Charts February 08, 2013 at 04:32 AM
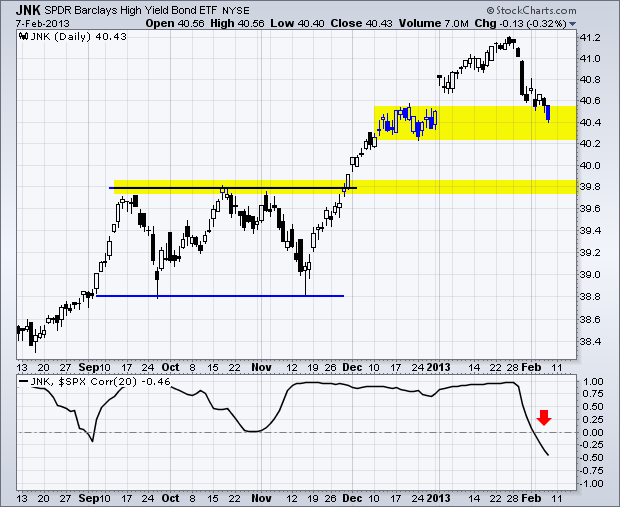
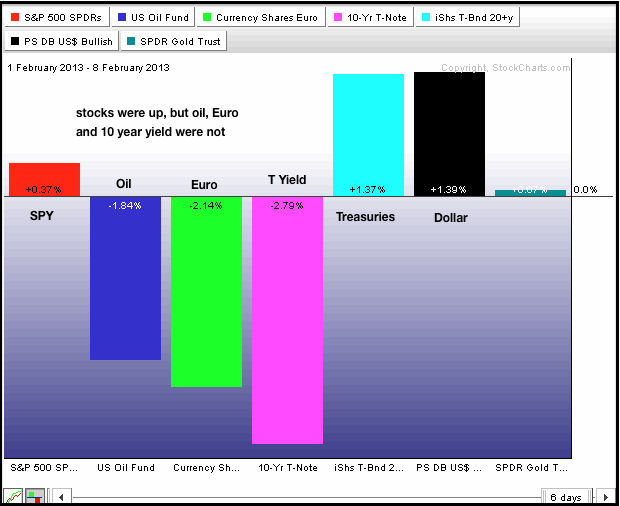
The stock market is holding up, but some external indicators are not. First, the US Dollar Fund (UUP) surged over the last few days and broke short-term resistance. Also note that bear trap from last Friday-Monday... Read More
Art's Charts February 07, 2013 at 04:56 AM
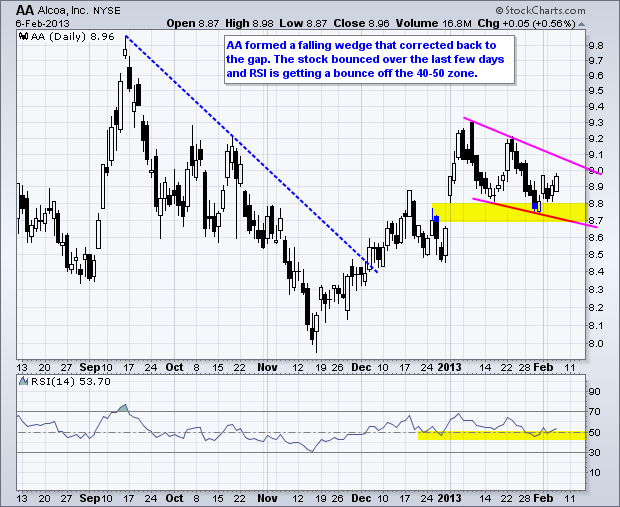
AA Bounces off Gap Zone. AEO Breaks Wedge Resistance. Plus INTC, TEVA, USB This commentary and charts-of-interest are designed to stimulate thinking. This analysis is not a recommendation to buy, sell, hold or sell short any security (stock ETF or otherwise)... Read More
Art's Charts February 07, 2013 at 04:23 AM
Stocks were mixed on Wednesday as the Nasdaq 100 ETF (QQQ) edged lower and the S&P 500 ETF (SPY) edged higher. Trading was seriously subdued in the sector SPDRs. Utilities SPDR (XLU) provided the biggest advance (.30%), while the Technology SPDR (XLK) provided the biggest loss (... Read More
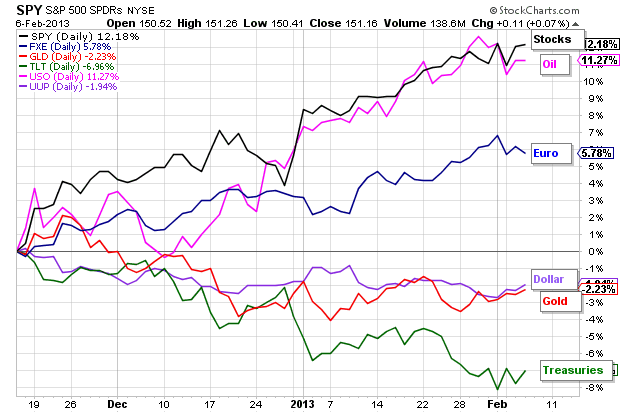
Art's Charts February 06, 2013 at 02:42 AM
Stocks rebounded with a big bang as the Nasdaq 100 ETF (QQQ) led the market higher. Yes, you read right. Microsoft, Intel, Cisco, and Dell all gained on the day and were on the most active list. Could the Dell LBO revive the old Winteldell machine? We shall see... Read More
Art's Charts February 05, 2013 at 06:16 AM
Although European issues got the blame for Monday's stock market decline, weakness should not come as a surprise because stocks were quite overbought and ripe for a corrective period... Read More
Art's Charts February 05, 2013 at 06:11 AM
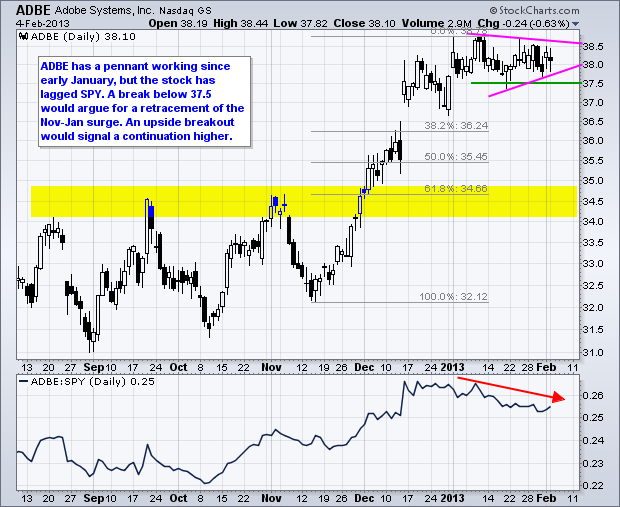
ADBE Stalls and Underperforms in January. APOL Forms a Bear Flag. Plus CCL, GES, ILMN, JCOM, NVDA This commentary and charts-of-interest are designed to stimulate thinking... Read More
Art's Charts February 04, 2013 at 04:56 AM
Stocks finished the week on a high note with the Dow Industrials closing above 14000 for the first time since 2007. The trend since mid November is pretty much straight up with the major index ETFs up double digits since these lows... Read More
Art's Charts February 01, 2013 at 05:51 AM
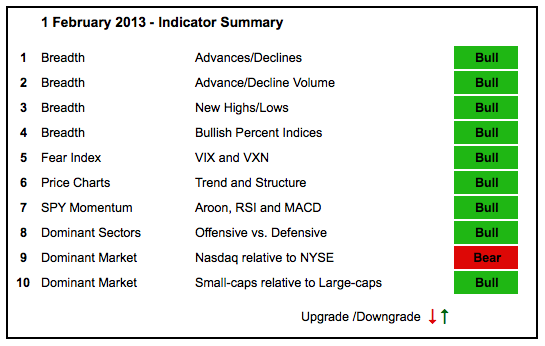
Stocks stalled the last four days, but this is not enough to affect the indicators, nine of which remain in bull mode. The major index ETFs are clearly overbought and the world is calling for a pullback, but we have yet to see it. I suspect we will get one sometime this month... Read More
Art's Charts February 01, 2013 at 04:25 AM
Stocks finished the day mixed as the market awaits the employment report. The Dow Industrials SPDR (DIA) edged lower, but the S&P MidCap 400 SPDR (MDY) edged higher. The sectors were mostly lower with the Basic Materials SPDR (XLB) falling around 1%... Read More