Art's Charts January 30, 2015 at 04:00 AM
Stocks started the day with some selling pressure, but firmed around 11AM and moved steadily higher the rest of the day. Small-caps and micro-caps led the way as IWM and IWC gained 1.38% and 1.48%, respectively... Read More
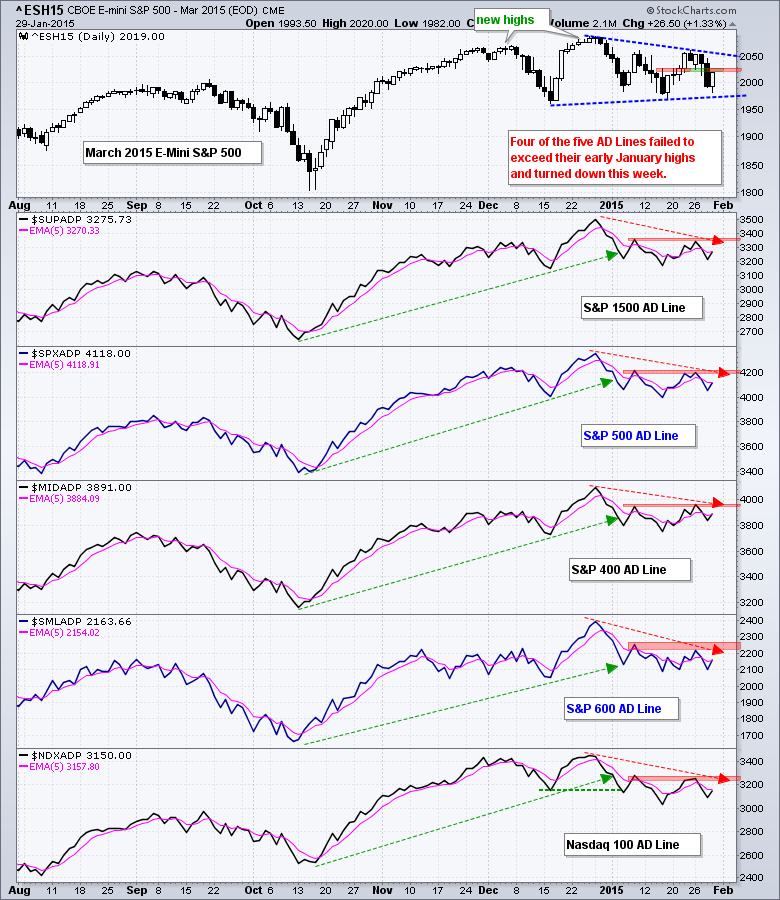
Art's Charts January 29, 2015 at 04:28 AM
Stocks took it on the chin again on Wednesday with the major index ETFs losing over 1%. Well, QQQ managed a 0.5% loss because Apple and Facebook gained. Nevertheless, 89 out of the 100 stocks in QQQ declined and selling pressure was pretty lopsided... Read More
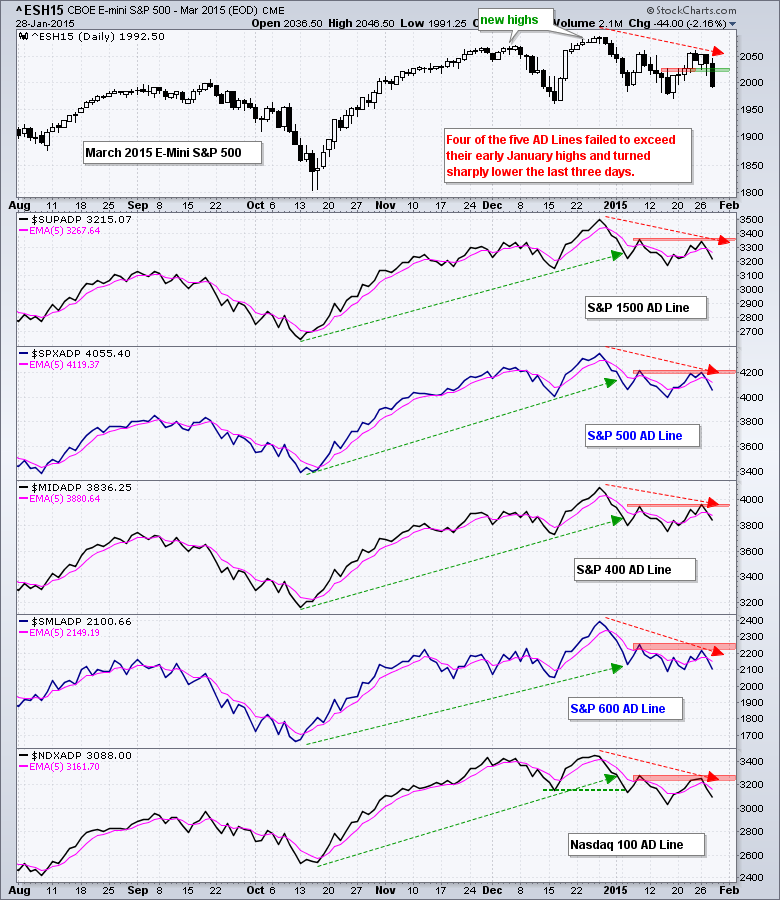
Art's Charts January 28, 2015 at 06:15 AM
Stocks continued their volatile ways as SPY and QQQ fell sharply on the open, rebounded and then sold off in the final hour. Microsoft and Durable Goods got most of the blame. The strong Dollar is also affecting earnings in large-caps... Read More
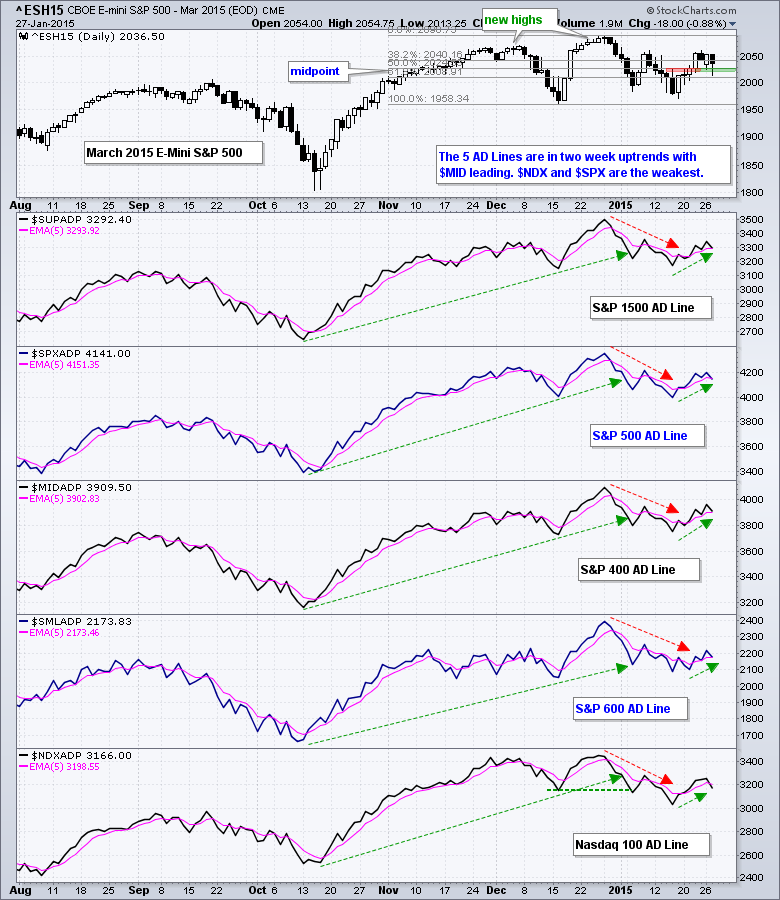
Art's Charts January 27, 2015 at 04:28 AM
Stocks started the day weak, but quickly found their footing and moved higher the rest of the day. Despite this recovery, QQQ ended the day with a fractional loss and SPY closed with a fractional gain... Read More
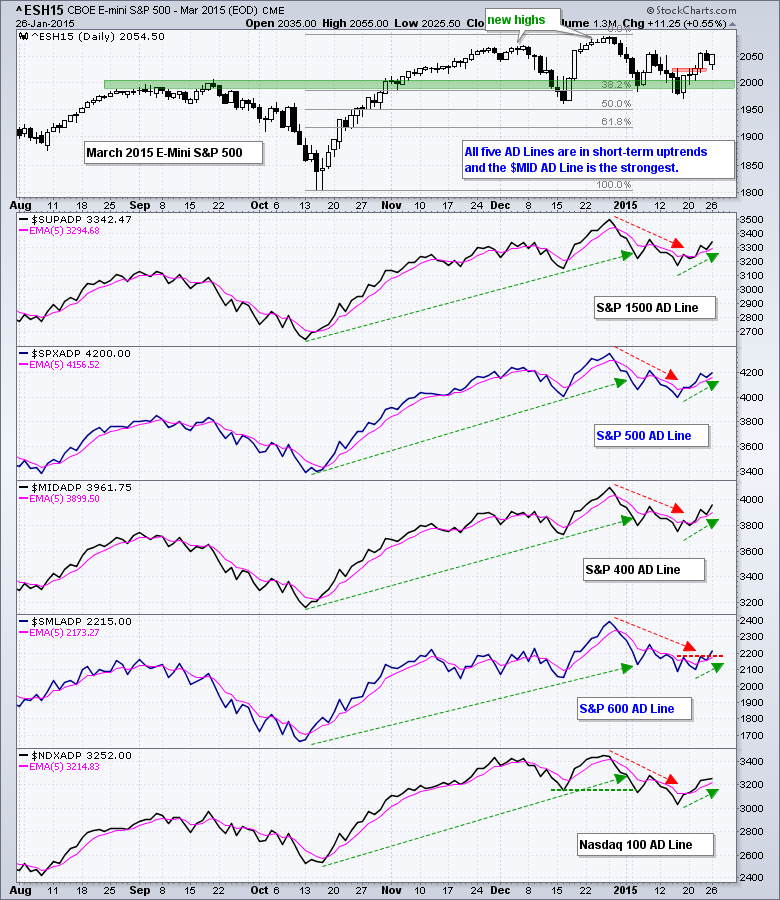
Art's Charts January 26, 2015 at 04:52 AM
Stocks took a breather on Friday, but the Nasdaq 100 ETF (QQQ) and Russell 2000 Growth iShares (IWO) bucked the selling pressure by producing small gains to end the week. Overall, QQQ led the market last week with a 3... Read More
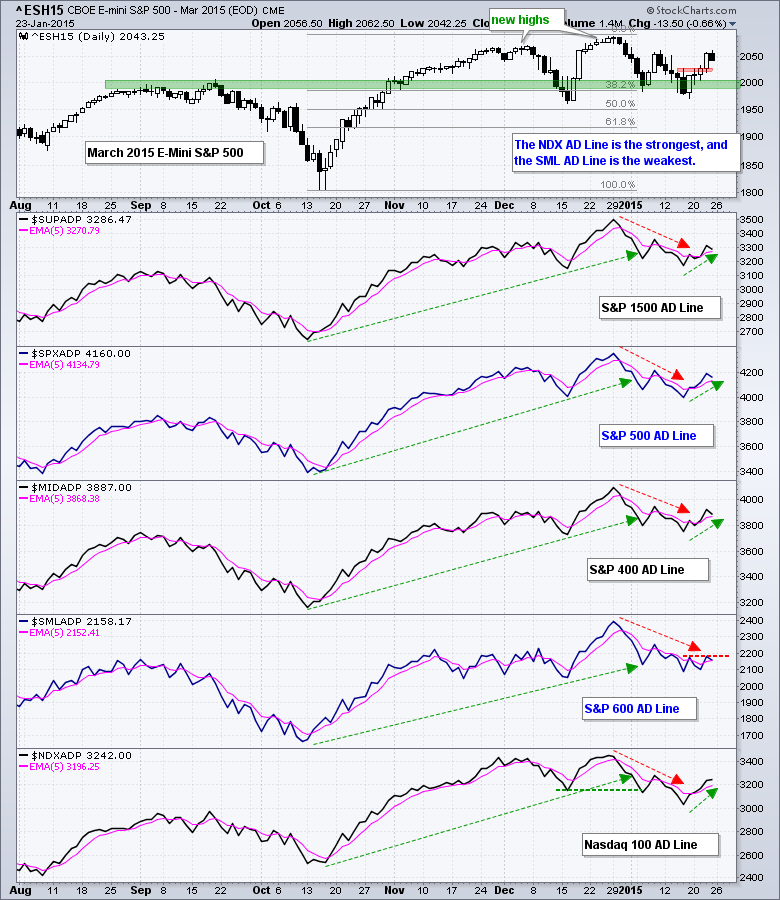
Art's Charts January 23, 2015 at 04:54 AM
Stocks moved sharply higher on Thursday with IWM getting the biggest gain among the major index ETFs. Note that IWM and IJR were both up over 2%. Even though these two show relative weakness in January, they typically outperform during a broad market move... Read More
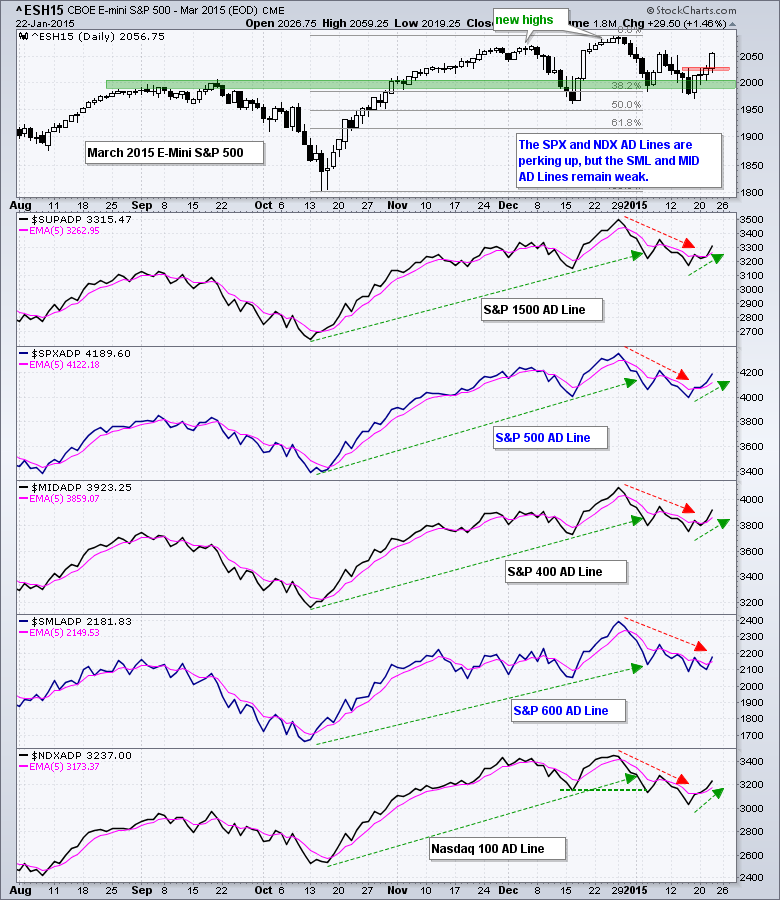
Art's Charts January 22, 2015 at 05:06 AM
Stocks managed to claw out some gains with large-caps leading the way. SPY and QQQ gained around a half percent. Small-caps were weak as IWM fell .32%. The gains and losses were small and not that significant. Energy, materials and utilities led the market higher... Read More
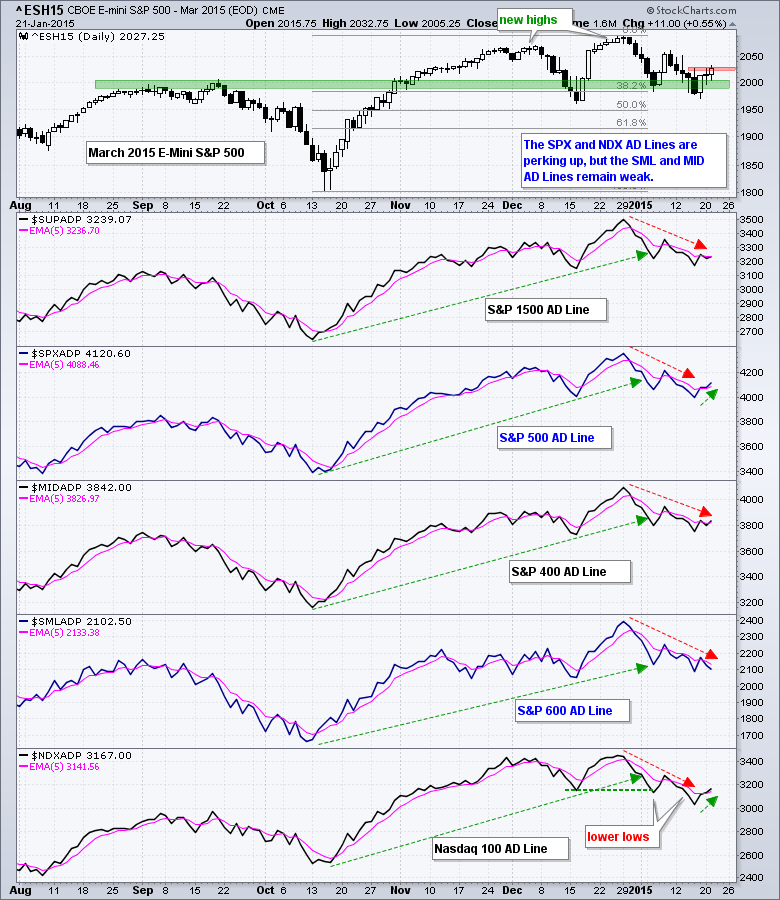
Art's Charts January 21, 2015 at 06:03 AM
The technology sector came to life with a modest gain on Tuesday, but the consumer discretionary and finance sectors countered with declines. Relative weakness in finance is getting to be a problem for the overall market and may not clear up as long as Treasury yields fall... Read More
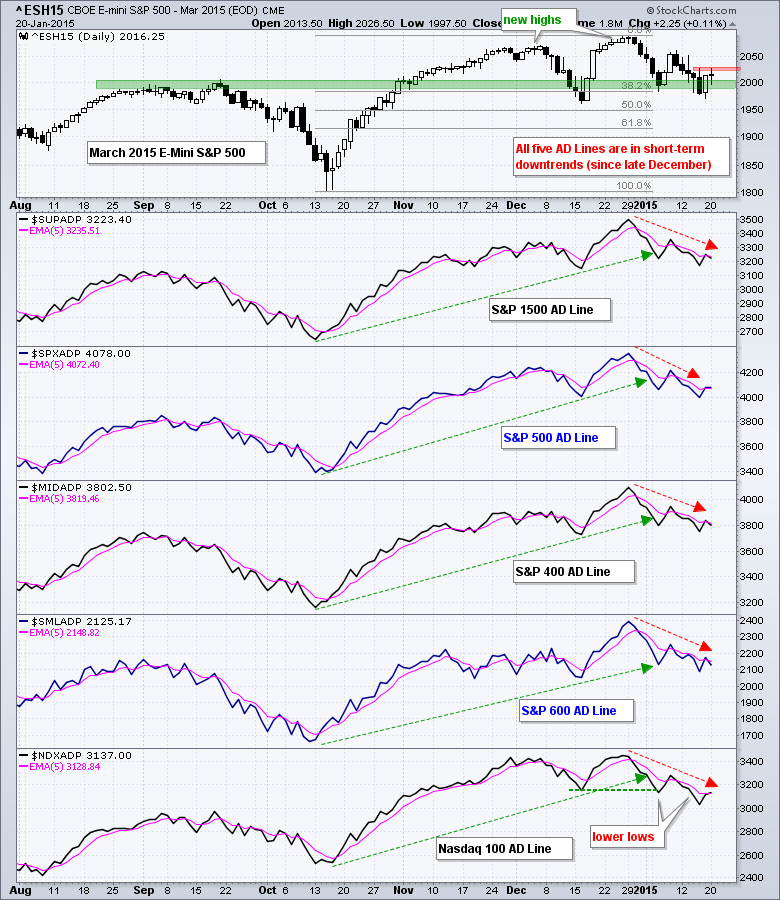
Art's Charts January 20, 2015 at 04:41 AM
SPY, QQQ and IWM broke down last week, but rebounded sharply on Friday. Despite this rebound, the major index ETFs closed down for the week. IWM led Friday with a 1.63% advance and small-caps continue to hold up well overall... Read More
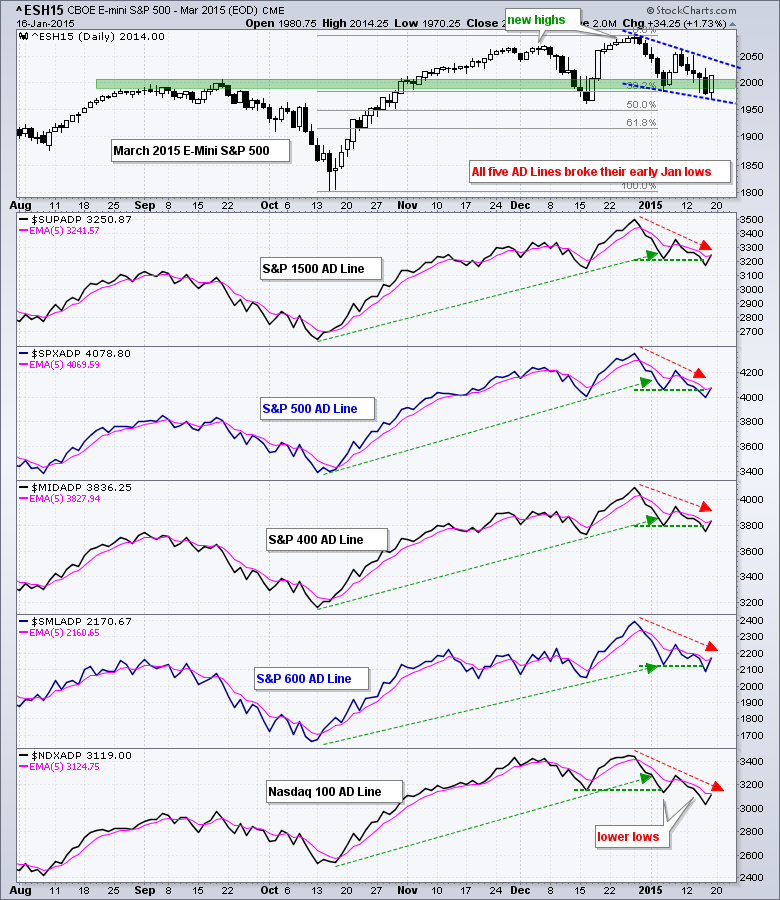
Art's Charts January 16, 2015 at 04:43 AM
Stocks tried to bounce on Thursday, but selling pressure soon took over and the major index ETFs closed with losses again. Small-caps and large techs led the way as IWM fell 1.69% and QQQ declined 1.30%... Read More
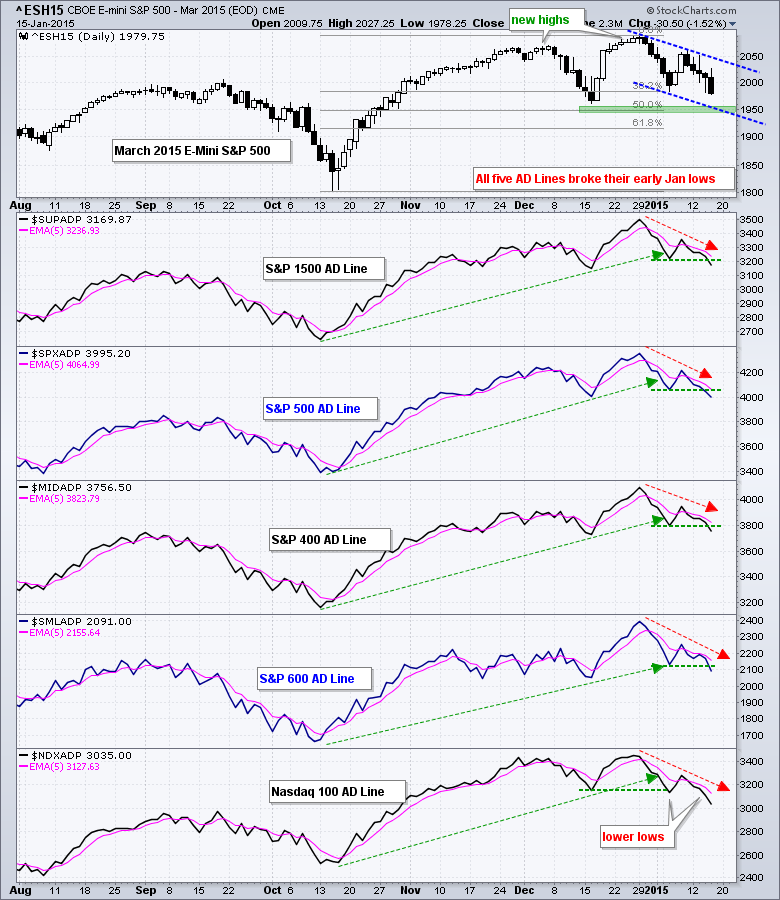
Art's Charts January 15, 2015 at 05:32 AM
Stocks started the day under selling pressure as the major index ETFs gapped down on the open. Selling pressure continued into the afternoon, but buyers stepped in around 2PM and pushed stocks off their lows... Read More
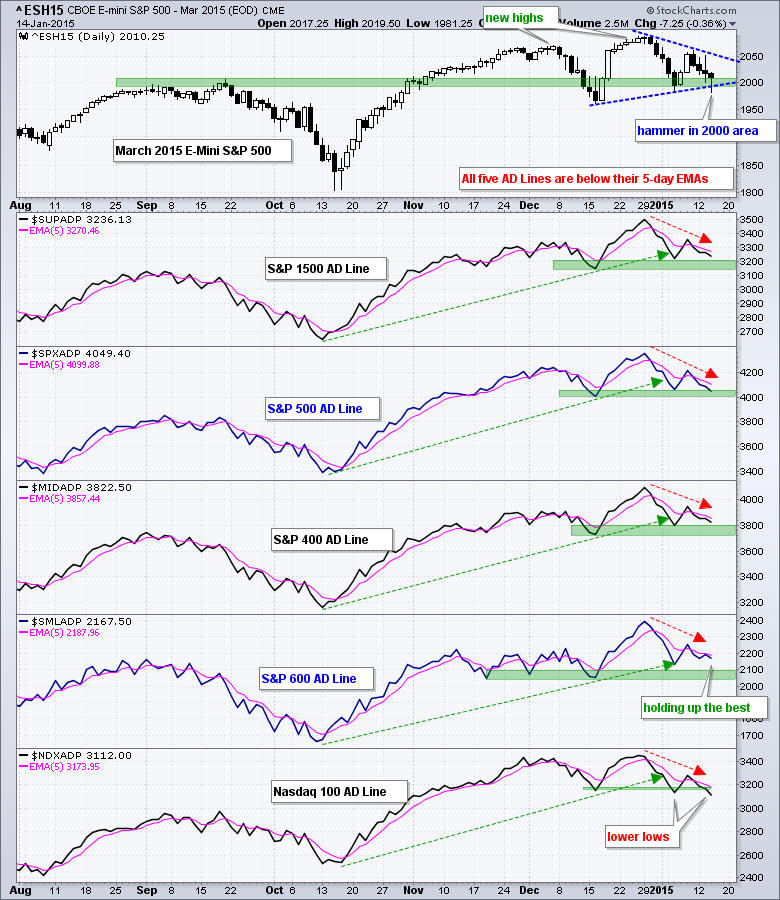
Art's Charts January 14, 2015 at 05:39 AM
Stocks surged in early trading, worked their way lower in mid morning and then plunged after lunch. With a small rebound in the final hour, the net losses were reduced and the major index ETFs closed fractionally lower... Read More
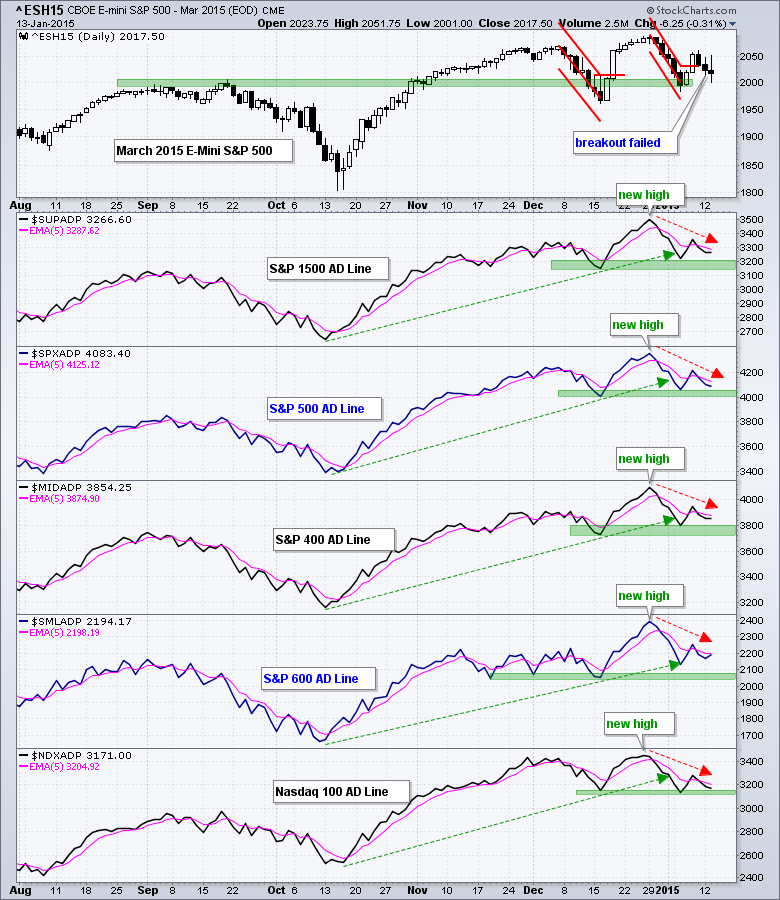
Art's Charts January 13, 2015 at 04:44 AM
Stocks opened weak with a sharp decline in the first 30 minutes and then traded flat the rest of the day. Even though stocks managed to firm after early weakness, buyers held back and the major index ETFs closed with modest losses... Read More
Art's Charts January 12, 2015 at 05:23 AM
It was a pretty wild week as stocks plunged Monday-Tuesday, surged Wednesday-Thursday and fell back on Friday. After all the pushing and shoving, the major index ETFs ended with small losses for the week. Well, IWM lost 1.14%, which is a modest loss... Read More
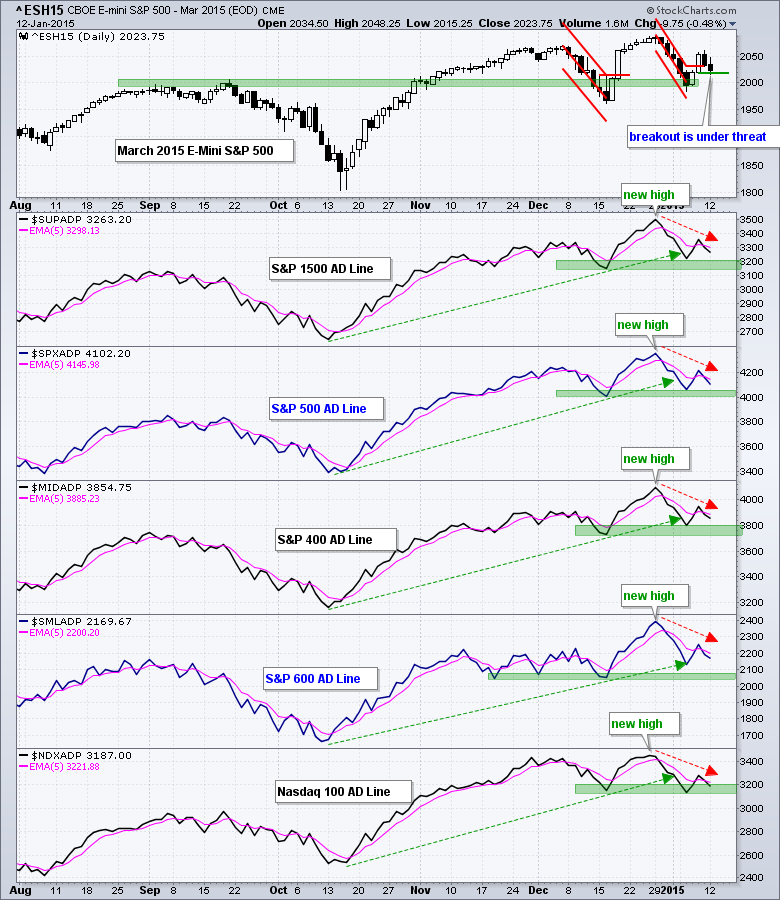
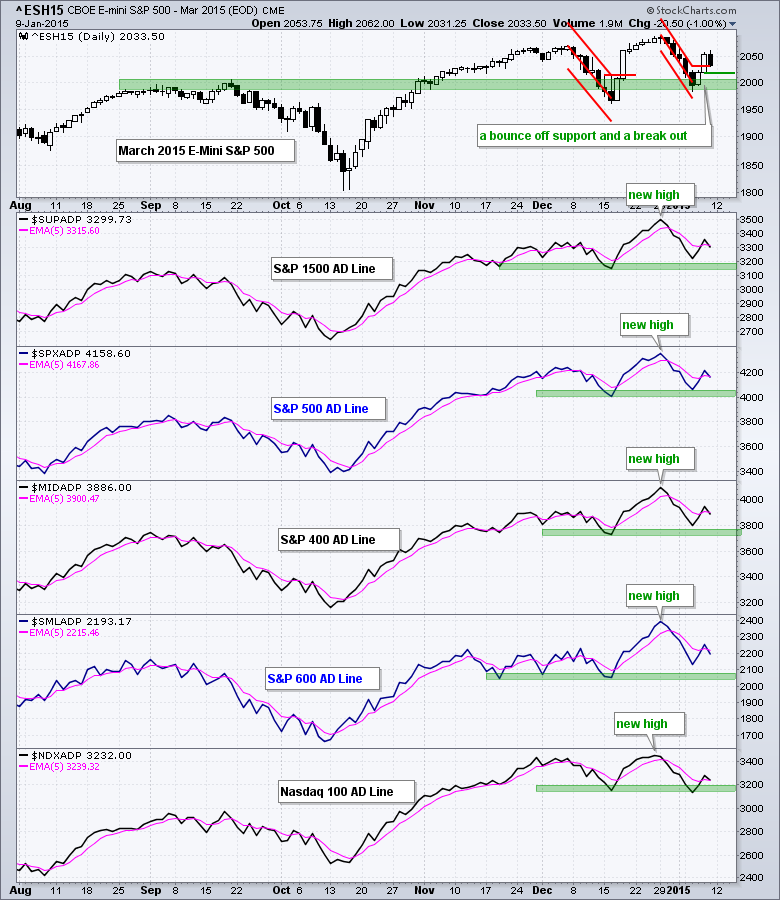
Art's Charts January 09, 2015 at 05:39 AM
It is just like mid December as SPY, IWM and QQQ fell sharply and then suddenly reversed with a two-day surge... Read More
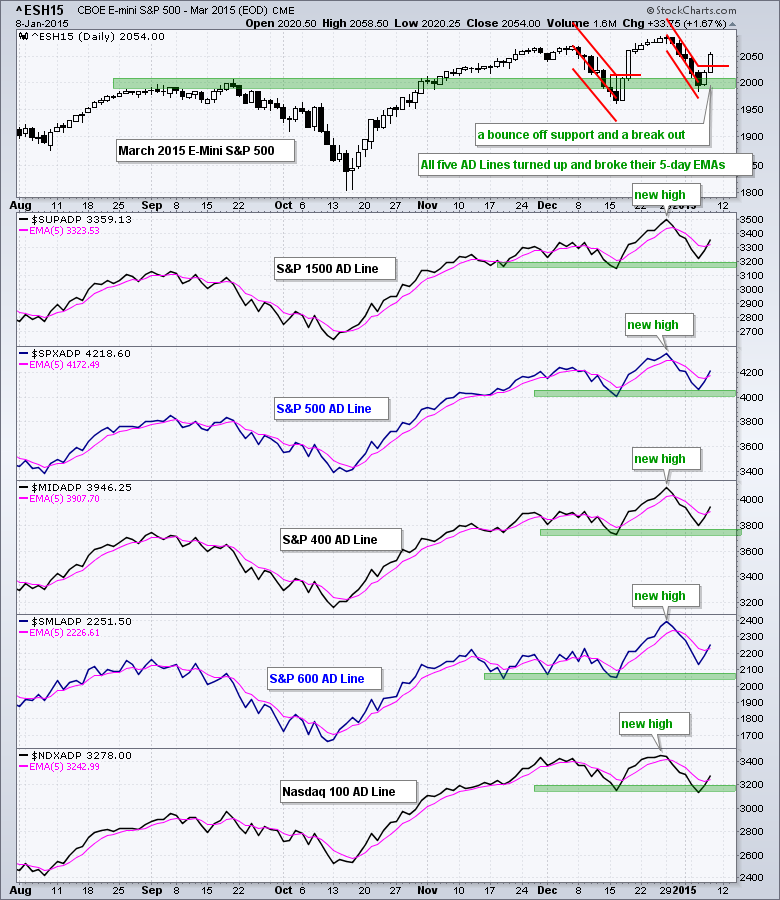
Art's Charts January 08, 2015 at 05:30 AM
Stocks finally got an oversold bounce and even closed strong. Most of the bounce occurred with a morning pop, but SPY, IWM and QQQ managed to add to these early gains. In particular, IWM got a late surge and closed near the high of the day... Read More
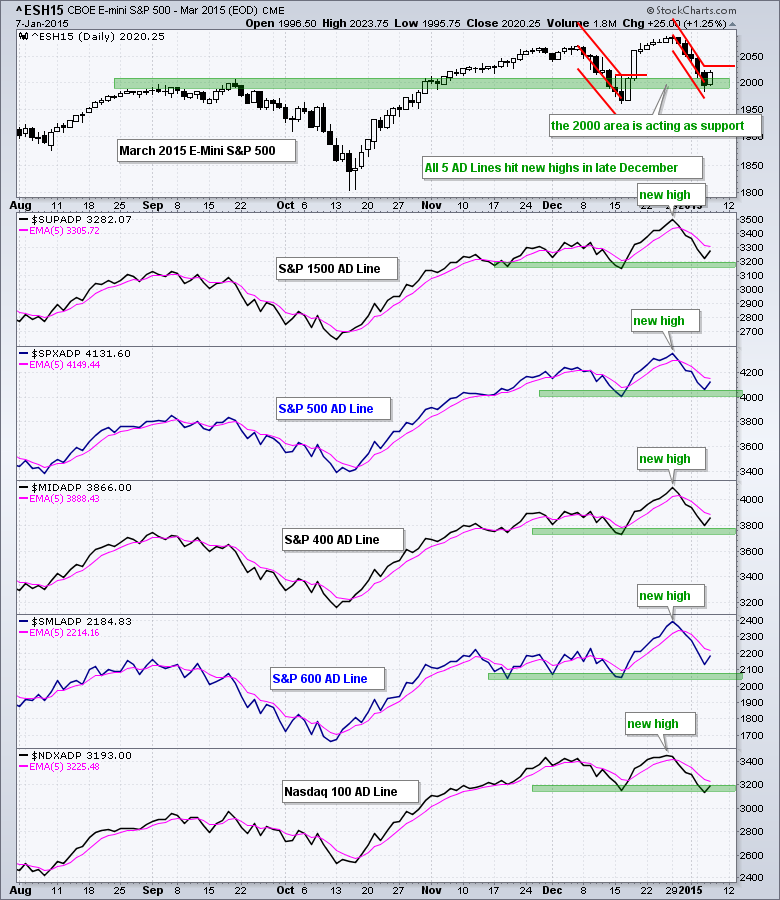
Art's Charts January 07, 2015 at 06:01 AM
Stocks took it on the chin again with small-caps leading the way lower. IWM fell 1.73%, QQQ lost 1.34% and SPY declined .94%. All three are down over 4% the last five days and short-term oversold... Read More
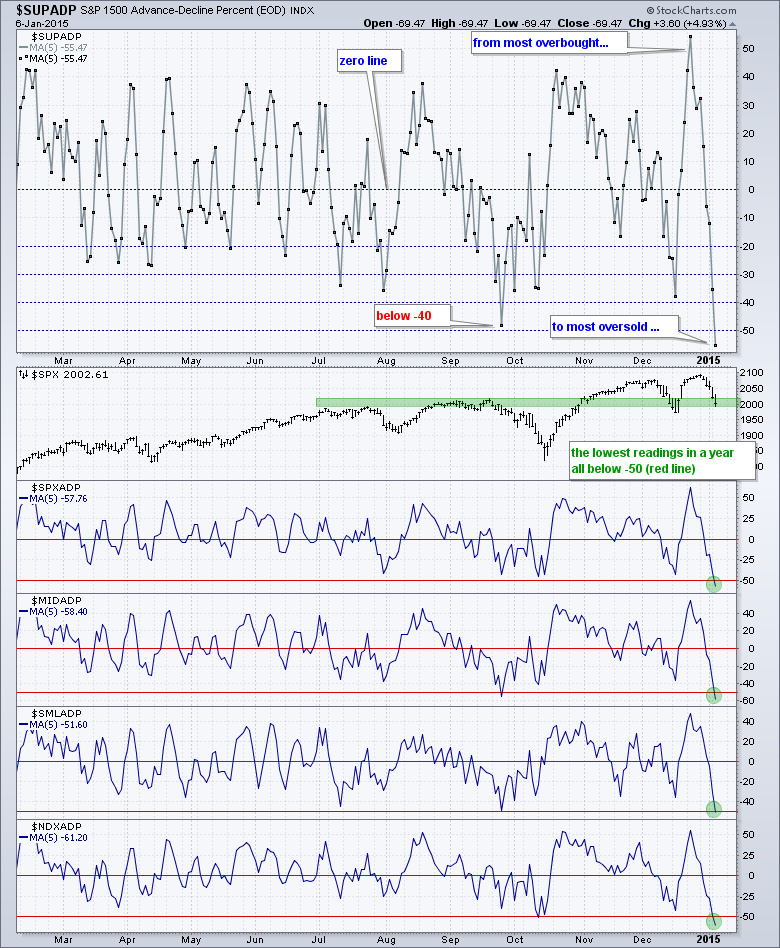
Art's Charts January 06, 2015 at 04:52 AM
Stocks ended the year weak and started the year weak with Greece and oil getting most of the blame. Light Crude fell below $50 and energy stocks got hammered. European stocks plunged on fears of a Greek exit, and Japan followed suit today with a 3% decline... Read More
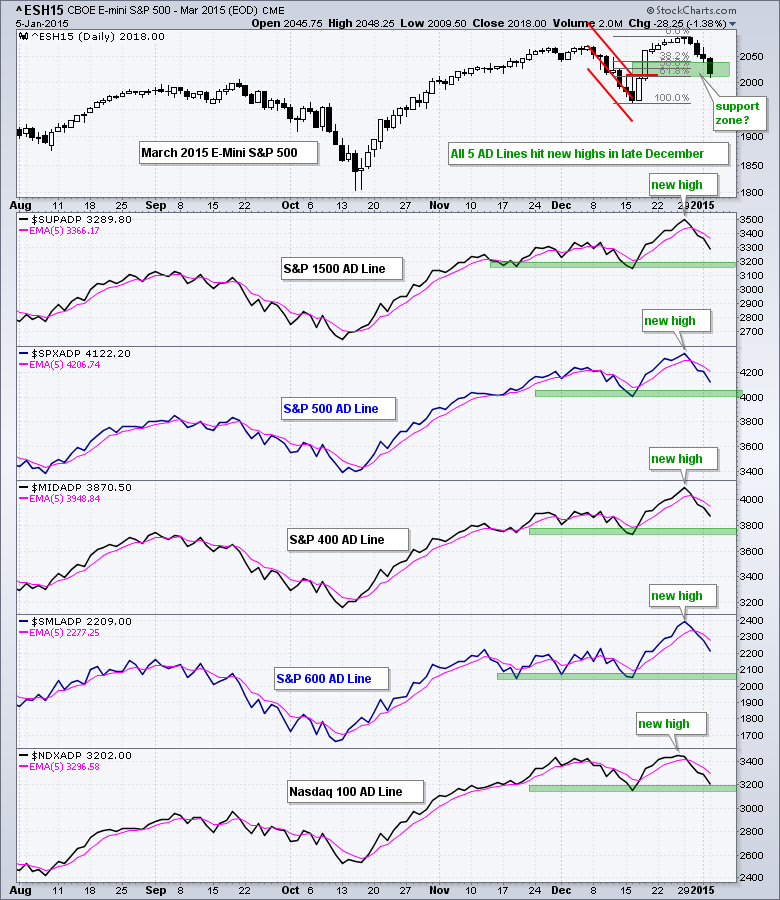
Art's Charts January 05, 2015 at 04:48 AM
Stocks got the Santa Claus rally, but it fizzled after Christmas and selling pressure took hold over the last three trading days. After a big advance from 17 to 29 December, the stock market was entitled to a pullback... Read More