Art's Charts September 30, 2015 at 08:59 AM
The medium-term and short-term trends for the major index ETFs are down, but there are some stocks holding up well over the last two months and I am highlighting ten today... Read More
Art's Charts September 29, 2015 at 09:18 AM
Cash Outperforms Defensive Sectors Correlations rise when the major stock indices are in downtrends. In addition, the deeper and sharper the decline, the higher the positive correlation among stocks. This means there are few places to hide when the stock market turns down... Read More
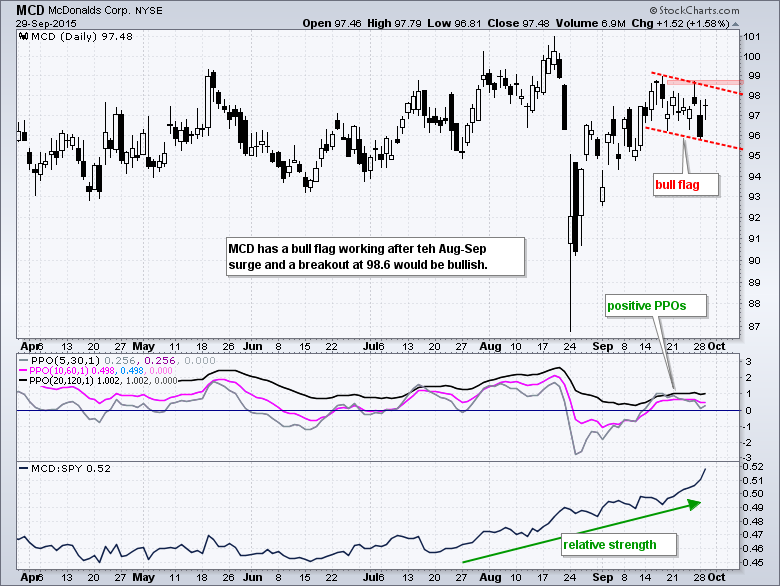
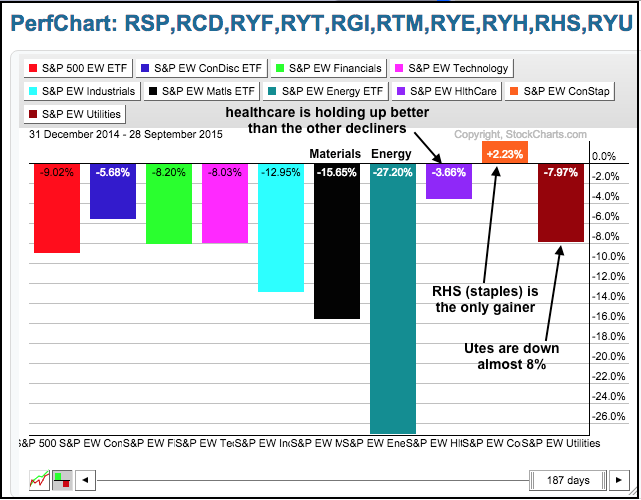
Art's Charts September 28, 2015 at 09:29 AM
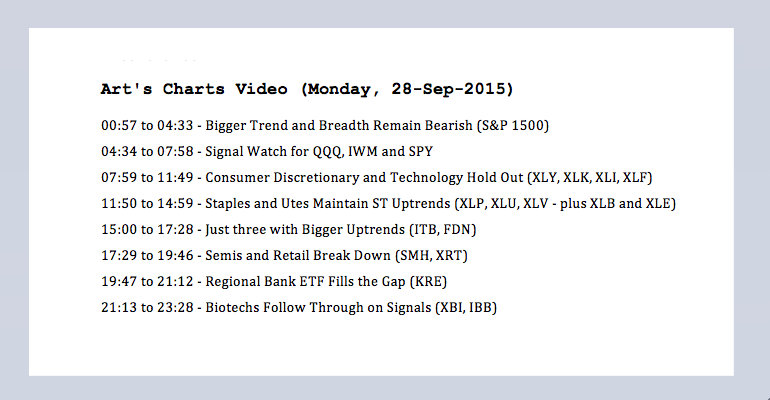
Bigger Trend and Breadth Remain Bearish Programming note: I will add a video to this commentary by 10AM ET. Also note that I will not be doing a webinar on Tuesday, but will post a commentary. There is no change in the medium-term trends and indicators for the major index ETFs... Read More
Art's Charts September 25, 2015 at 10:12 AM
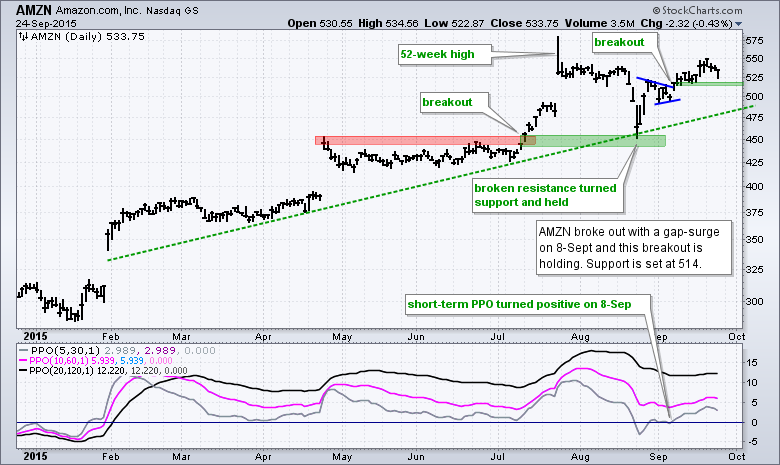
The next charts show mostly stocks in uptrends with recent breakouts. For example, AMZN broke out on September 8th and this breakout is holding. The ability to hold a breakout in a weak market shows both absolute and relative strength... Read More
Art's Charts September 25, 2015 at 08:45 AM
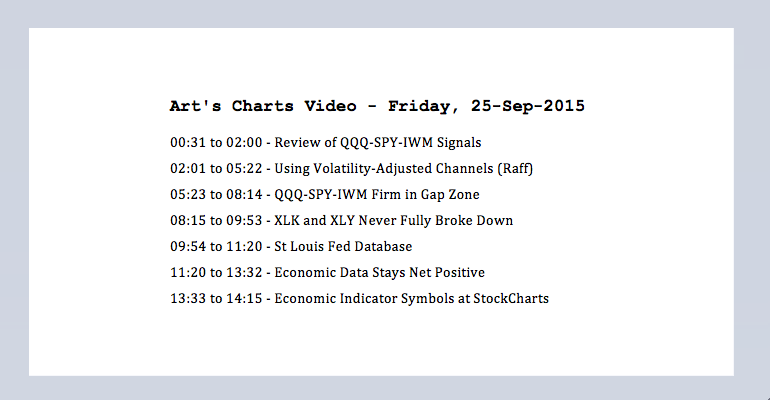
Using Volatility-Adjusted Channels Note that I will be making a second post today with some individual stock charts (AMZN, AAPL, FB, NFLX, PANW, TASR, TSLA, UA, XOM and more)... Read More
Art's Charts September 24, 2015 at 10:26 AM
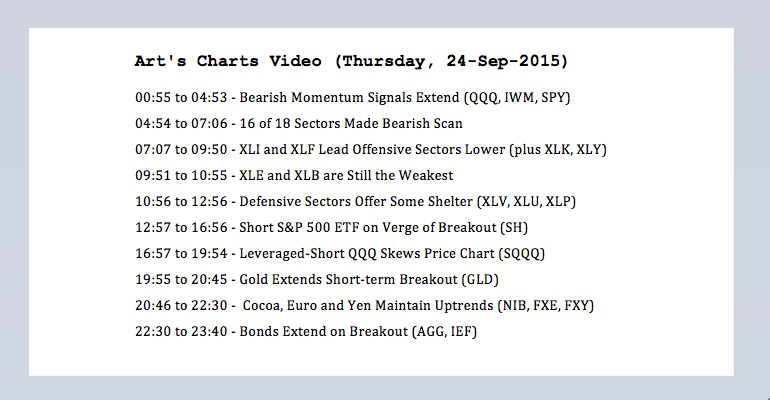
Medium-term (MT), the major index ETFs are in downtrends after the August support breaks. In addition, the PPO (20,120,1) and PPO (10,60,1) are in negative territory to confirm these downtrends. Short-term (ST), the major index ETFs are mixed... Read More
Art's Charts September 22, 2015 at 09:32 AM
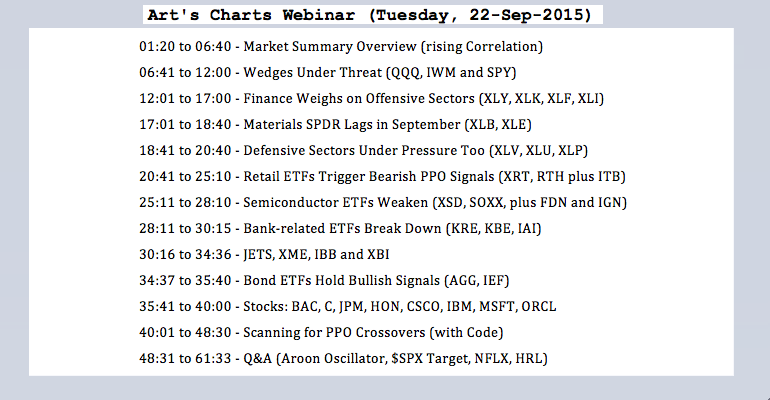
With the Fed noise behind us, for the most part at least, we can now focus on some untainted price action to define trends in the stock market. I view this week as important because there is less noise and chartists should watch for a decisive move - one way of the other... Read More
Art's Charts September 21, 2015 at 07:09 AM
Wedges are Still Rising - Despite the Noise The stock market has certainly seen its fair share of noise in September. This noise includes the usual chatter from the talking heads and the Fed, as well as some volatile price action... Read More
Art's Charts September 19, 2015 at 07:04 AM
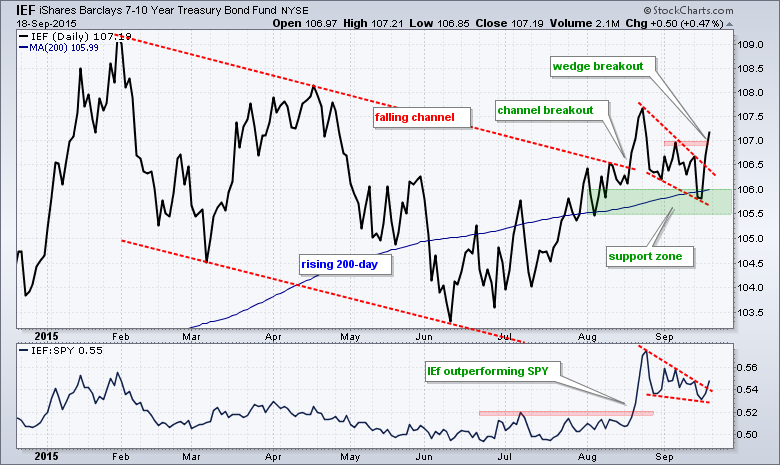
The S&P 500 SPDR (SPY) and the 7-10 YR T-Bond ETF (IEF) are going their separate ways as opposing wedges takes shape and IEF outperforms SPY (bonds outperform stocks). First, note that I am using close-only price charts to filter out some of the noise few weeks... Read More
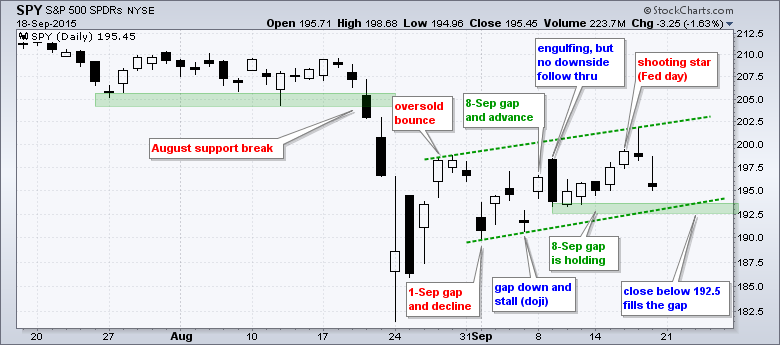
Art's Charts September 18, 2015 at 09:40 AM
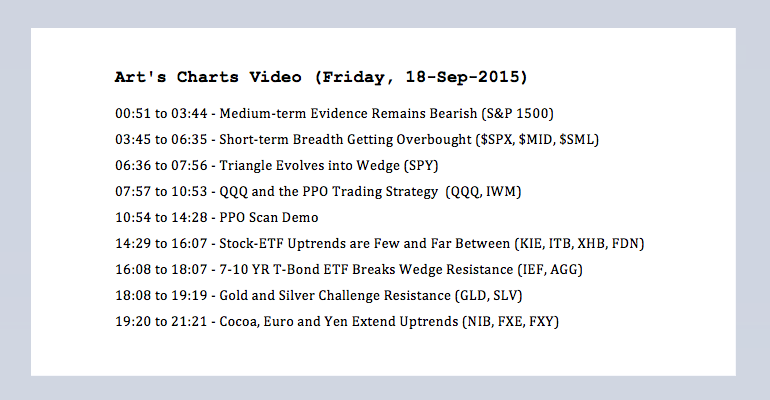
Medium-term Evidence Remains Bearish Video will be posted around 11AM ET. The bulk of the medium-term evidence remains bearish for the stock market as a whole. I noted that a bullish breadth thrust occurred on Thursday... Read More
Art's Charts September 17, 2015 at 09:23 AM
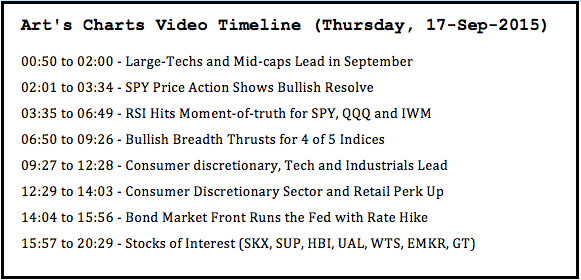
Large-Techs and Mid-caps Lead in September The September bounce is shaping up rather nicely with the Nasdaq 100 and the S&P MidCap 400 leading the major indices. The PerfChart below shows the month-to-date performance for eight stock indices... Read More
Art's Charts September 15, 2015 at 09:28 AM
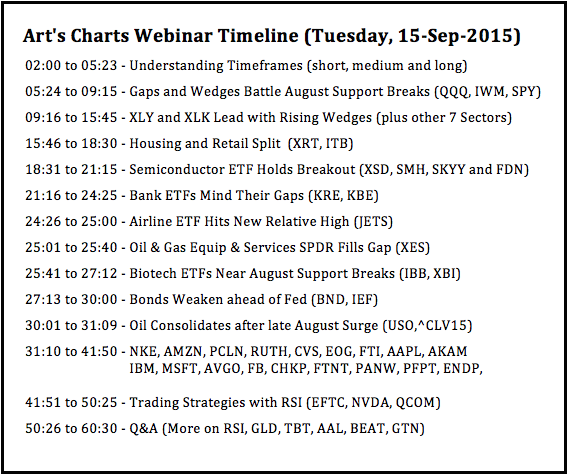
The major index ETFs remain in medium-term downtrends and short-term uptrends. Well, the short-term uptrend in SPY is up for debate because a triangle is taking shape. Nevertheless, SPY, QQQ and IWM gapped up last Tuesday and these gaps held for five days... Read More
Art's Charts September 11, 2015 at 11:49 AM
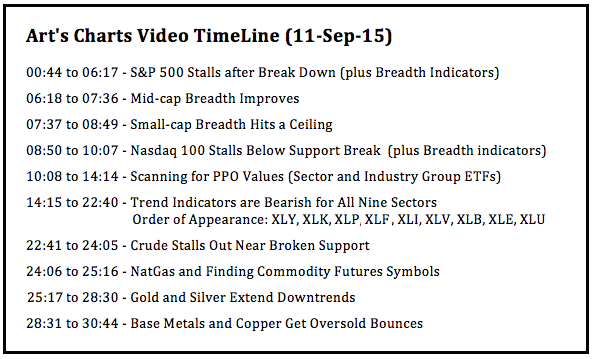
There is clearly a bearish headwind working against stocks right now. The major stock indices are in downtrends after their August support breaks, the key breadth indicators are bearish and all nine sectors are in downtrends... Read More
Art's Charts September 10, 2015 at 08:20 AM
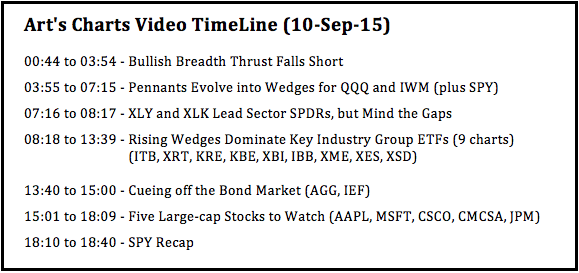
Bullish Breadth Thrust Falls Short Stocks surged on Wednesday's open, but quickly gave up these gains and declined into the close. Selling pressure was quite broad as AD Percent for the S&P 500 exceeded -80%. Small-caps held up better as S&P 600 AD Percent finished at -56%... Read More
Art's Charts September 09, 2015 at 07:46 AM
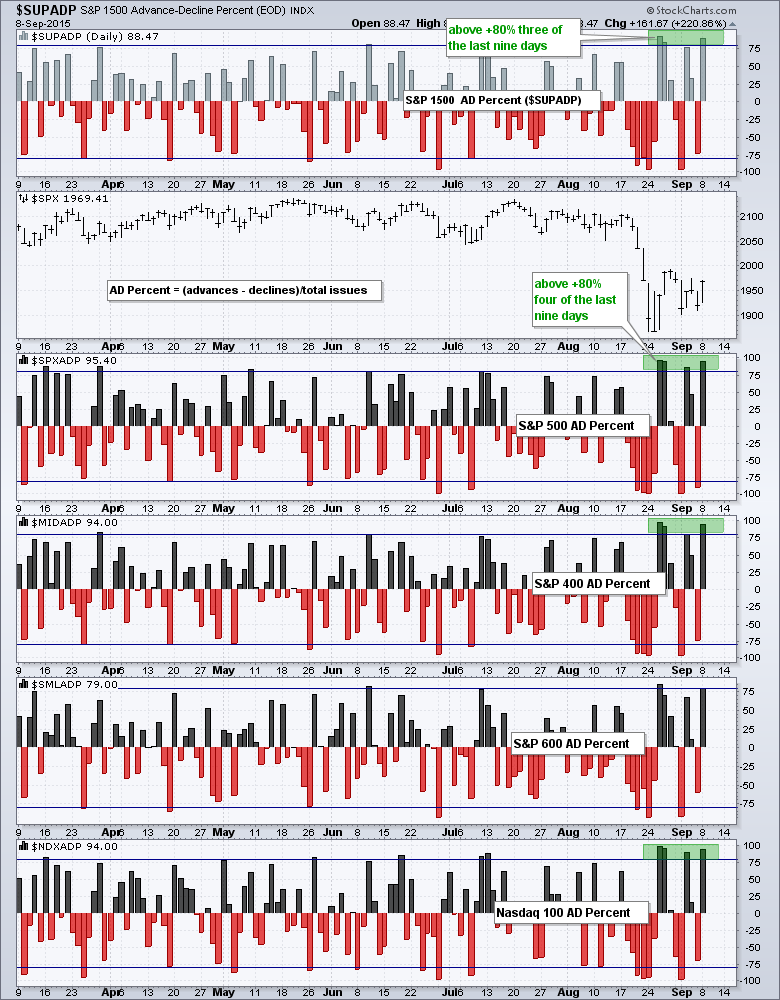
Breadth was exceptionally strong the last two weeks and the broad market indices are on the verge of a bullish breadth thrust. Despite a couple big down days last week, AD Percent for the major index ETFs put in four strong readings in the last nine trading days... Read More
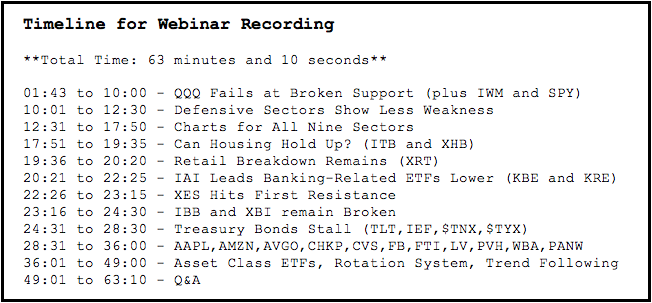
Art's Charts September 08, 2015 at 08:50 AM
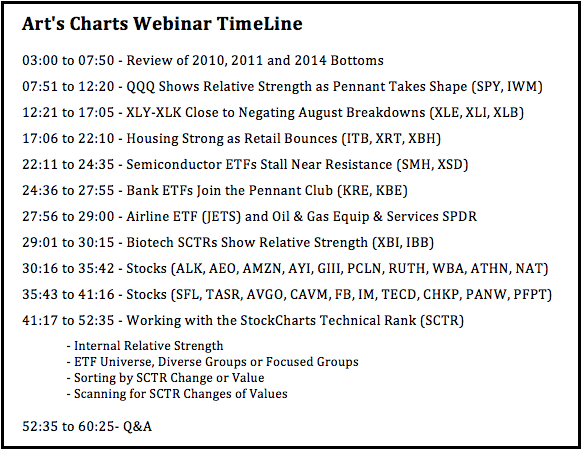
Click here for the recording QQQ Shows Relative Strength as Pennant Takes Shape There are two narratives at work in the stock market and these are reflected on the charts for QQQ, SPY and IWM... Read More
Art's Charts September 04, 2015 at 12:24 PM
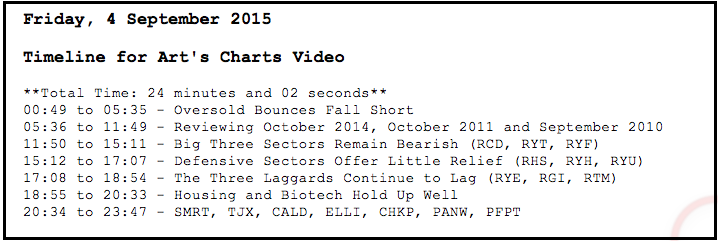
Oversold Bounces Fall Short The overall trend remains down for the major index ETFs (QQQ, SPY and IWM). Trading turned volatile with the mid August breakdowns, but the breakdowns remain and these are the dominant feature on most stock-related charts... Read More
Art's Charts September 03, 2015 at 09:34 AM
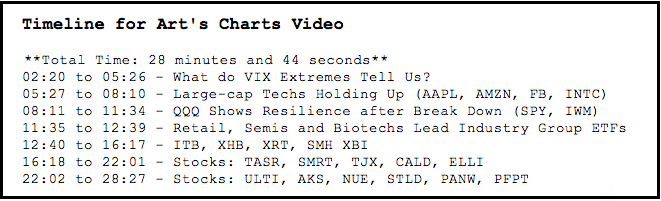
What do VIX Extremes Tell Us? Even though it can be difficult to trade based on extremes, note that the volatility indices are at extremes that suggest plenty of fear and this could foreshadow a bounce... Read More
Art's Charts September 02, 2015 at 12:12 PM
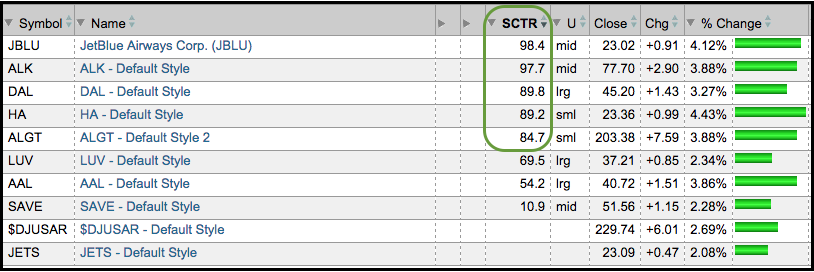
This is just a quick and dirty note regarding today's strength in airline stocks. The table below shows eight airline stocks, the Airline ETF (JETS) and the DJ US Airline Index ($DJUSAR)... Read More
Art's Charts September 01, 2015 at 09:14 AM
Stock futures are sharply lower on Tuesday morning and this means the oversold bounce is failing below the support break for the major index ETFs, sector ETFs and most industry group ETFs. Stocks became very oversold in mid August and then rebounded with sharp rallies last week... Read More