Art's Charts September 29, 2019 at 11:25 AM

After running some scans, scrolling through the charts and filtering the setups, I came up with a dozen stocks to watch for next week, and perhaps beyond. All are above their rising 200-day SMAs and in uptrends of some sort... Read More
Art's Charts September 28, 2019 at 07:08 AM

Today I will expand and update the key breadth indicators for the S&P 500. Notably, I added two more early warning indicators to the mix. They have yet to trigger, but these added indicators will give us something to watch going forward... Read More
Art's Charts September 27, 2019 at 08:55 AM

This weekly commentary, featuring the S&P 500, Index Breadth Model and Sector Breadth Model, is designed to provide an unbiased view of the current stock market environment. Models, while not perfect, provide a clear process driven approach for evaluating the market... Read More
Art's Charts September 26, 2019 at 11:33 AM

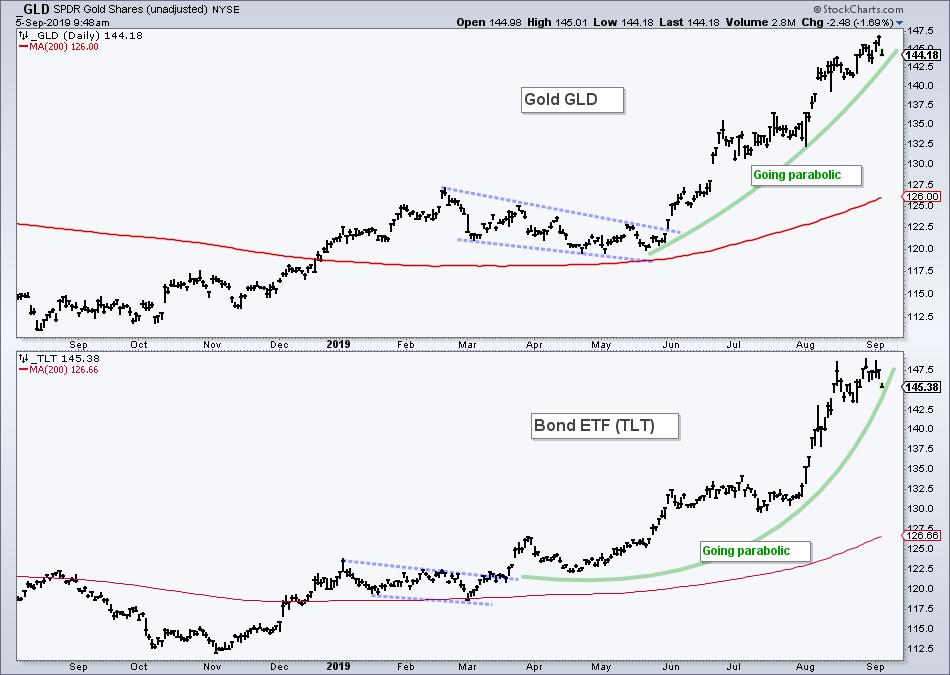
Today's report will rank and group my core ETF universe from strong uptrends to clear downtrends. Most of these ETFs are stock ETFs, but I also include several bond-related ETFs and a few commodity ETFs in my universe... Read More
Art's Charts September 25, 2019 at 07:49 AM

My headlines are often inspired by tunes, and this one is a classic going back to 1936 and Fred Astaire. No, I am not old enough to have seen it live on TV, but I've heard plenty of remakes... Read More
Art's Charts September 21, 2019 at 06:28 AM

Normally I ignore resistance levels in uptrends and support levels in downtrends. Resistance levels are not that important because higher highs are expected in an uptrend... Read More
Art's Charts September 20, 2019 at 06:36 AM

The resurgence of small-caps has been greatly exaggerated. Consider this. The S&P 500 SPDR (_SPY) bottomed on August 5th and broke above its August highs on September 5th. The Russell 2000 iShares (_IWM) bottomed on August 27th and broke above its August highs on September 10th... Read More
Art's Charts September 19, 2019 at 11:59 AM

After studying the charts in my core ETF list, I came up with eight groupings. The top three groups represent ETFs that are still in uptrends, while the bottom three groups represent ETFs that are in downtrends and lagging overall. The middle groups are in flux... Read More
Art's Charts September 17, 2019 at 10:21 AM

The S&P SmallCap iShares (IJR) and Russell 2000 iShares (IWM) are leading the market in September with 8.22% and 7.66% gains, respectively... Read More
Art's Charts September 14, 2019 at 11:08 AM

There are still plenty of strong uptrends out there in ETF land, but we are seeing a bit of rotation in the stock market... Read More
Art's Charts September 13, 2019 at 01:05 AM
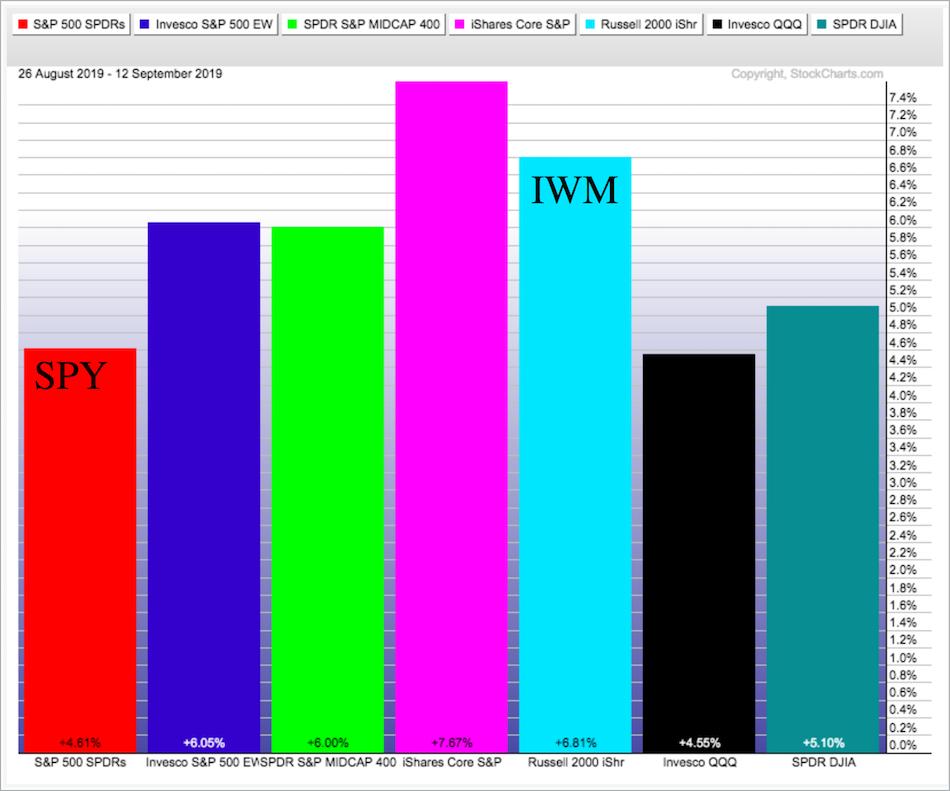
Stocks surged the last 12 days with small-caps leading the way higher. The Russell 2000 iShares (IWM) is up 6.8% and the S&P 500 SPDR (SPY) is up 4.6%. Even though small-caps are leading short-term, they are still lagging on the three and six month timeframes... Read More
Art's Charts September 07, 2019 at 09:53 AM
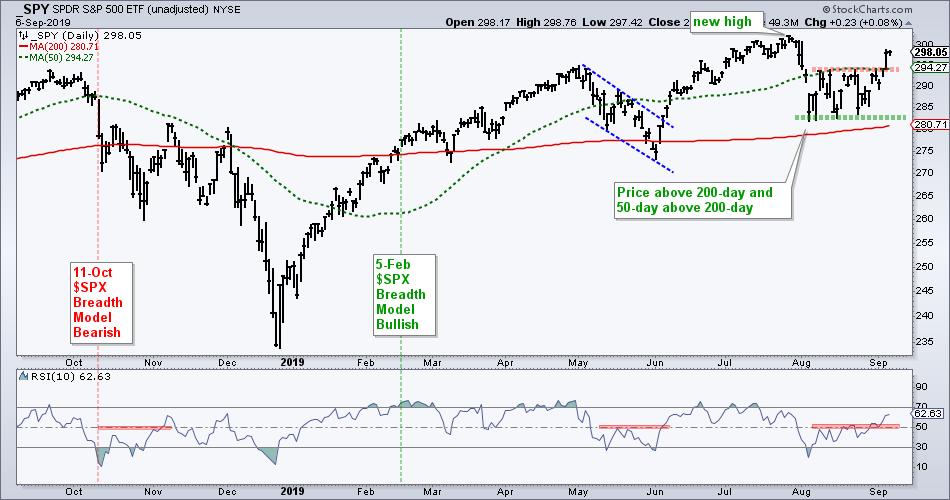
It was a big week for stocks and the breadth indicators backed up the bullish price action. The S&P 500 SPDR (SPY) broke out of its August range to signal a continuation of the bigger uptrend... Read More
Art's Charts September 05, 2019 at 10:00 AM
Today we will rank and group the key ETFs that I follow. Instead of showing all five groups, like in last week's commentary, I will focus the middle three groups, which I think are the most interesting and still have potential... Read More
Art's Charts September 05, 2019 at 05:47 AM

The S&P 500 and SPY are challenging their August highs again and large-cap breadth is stronger than breadth in mid-caps and small-caps. Since we seem to be on a day-to-day situation with the S&P 500 and this trading range, I will provide another short-term breadth update... Read More
Art's Charts September 04, 2019 at 09:25 AM

Even though trend continuations are more likely than trend reversals, reversals do occur and chartists looking for price reversals should understand the classic patterns... Read More
Art's Charts September 04, 2019 at 07:47 AM
As noted in Tuesday's commentary, the S&P 500 SPDR (SPY) and several big sector SPDRs remain locked in trading ranges. SPY fell back from range resistance with a modest decline on Tuesday (-.58%). It certainly could have been worst... Read More
Art's Charts September 03, 2019 at 07:56 AM
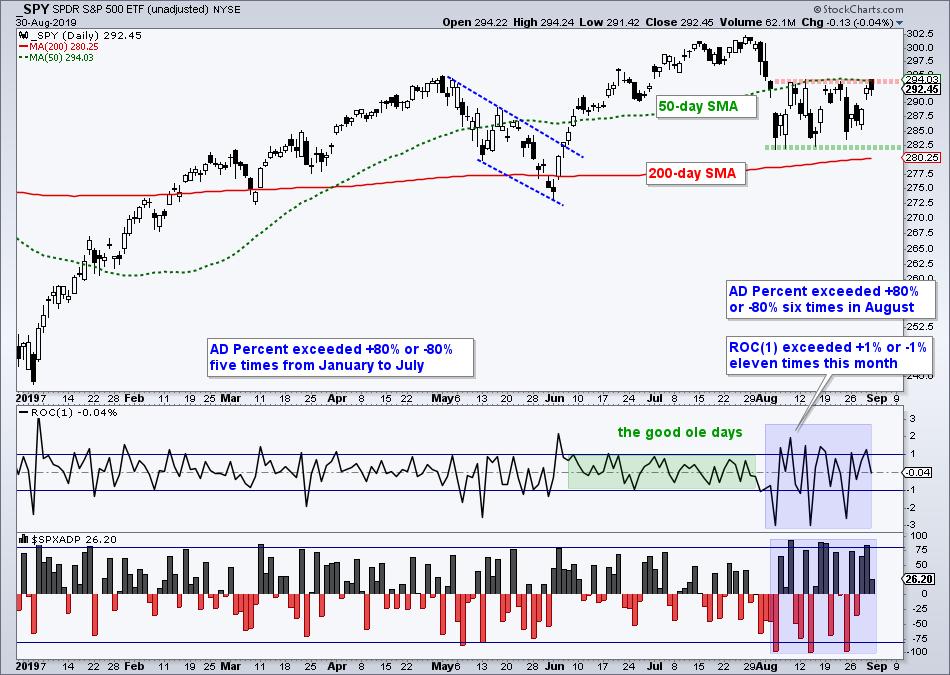
Stocks opened strong on Friday morning and then sold off ahead of a three day weekend. Well, the weekend has passed and stocks are set to open lower on Tuesday. What a surprise! August was volatile for the S&P 500. And yet it was also not volatile... Read More