Art's Charts August 29, 2022 at 07:04 AM

Traders can improve the odds of success by focusing on ETFs in leading uptrends. TrendInvestorPro identifies such ETFs with a table that shows Trend Composite signals and the 52-week range indicator... Read More
Art's Charts August 19, 2022 at 03:13 PM

The S&P 500 SPDR (SPY) surged to its falling 200-day SMA here in August and even edged above this key level intraday on Tuesday. Even though the ETF is close to crossing above the 200-day, chartists would be better off taking a step back to avoid a whipsaw... Read More
Art's Charts August 12, 2022 at 11:33 AM
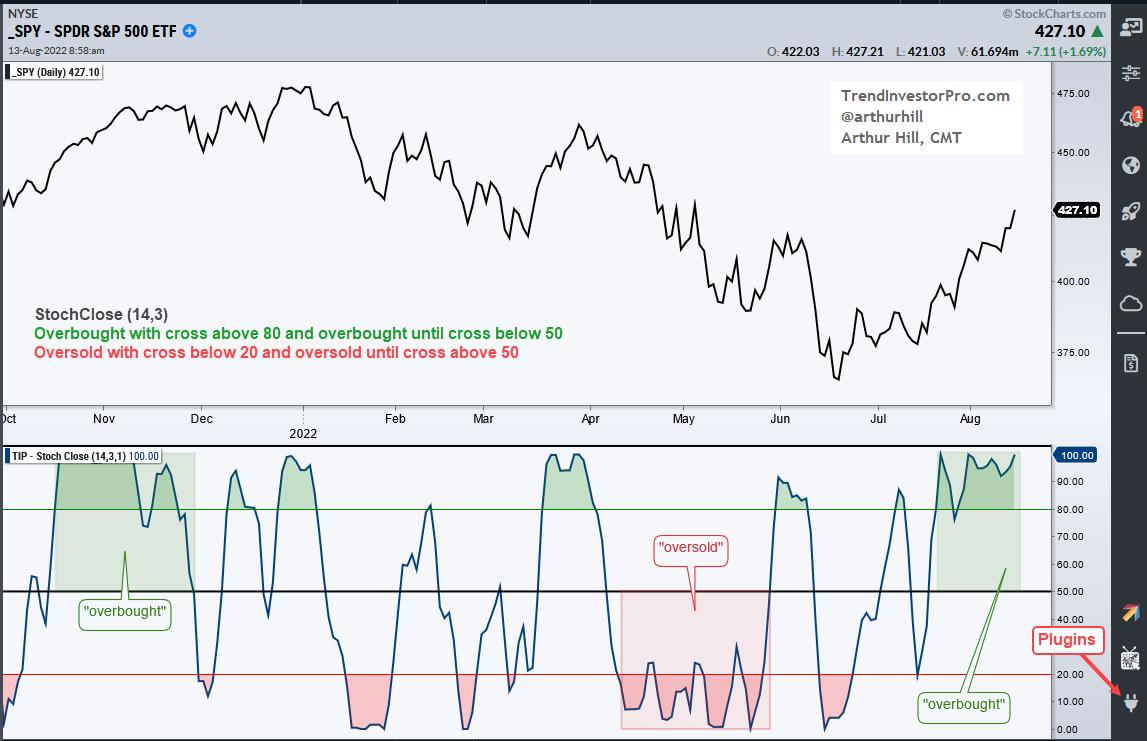
The S&P 500 SPDR (SPY) is in the midst of a strong advance since mid July as it became "overbought" on July 20th and remains overbought... Read More
Art's Charts August 05, 2022 at 11:08 AM
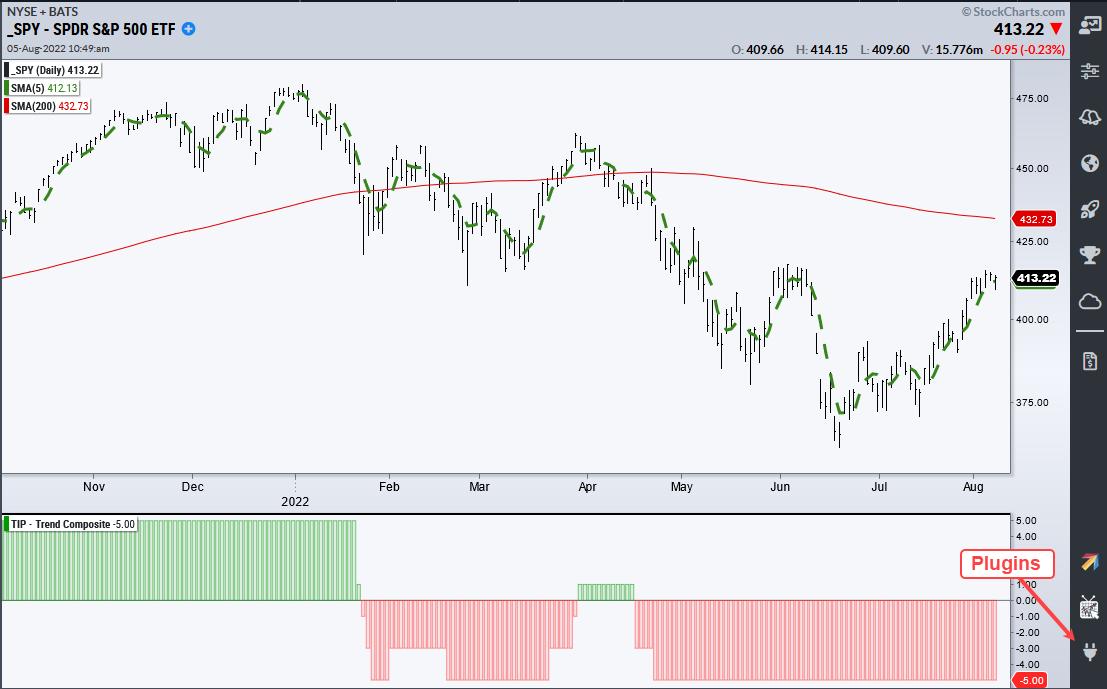
The Composite Breadth Model at TrendInvestorPro has been bearish since April 11th and remains bearish, which suggests that the current bounce in SPY is a counter-trend advance within a bigger downtrend... Read More
Art's Charts August 01, 2022 at 06:58 AM

Led by its top two components, Enphase (ENPH) and Solar Edge (SEDG), the Solar Energy ETF (TAN) followed a bullish signal from the Trend Composite with a big breakout to confirm a large bullish reversal pattern... Read More