Art's Charts September 30, 2022 at 05:01 PM
Technical analysts often scoff at the notion that a 20% decline marks a bear market. However, a look back shows that further losses are certainly possible after a 20% decline... Read More
Art's Charts September 23, 2022 at 08:59 AM

Despite the bear market environment, a handful of stock-based ETFs were showing leadership with bullish Trend Composite signals. Representatives from dirty energy (XLE), clean energy (TAN) and utilities (XLU) were covered over the last few weeks and this article is a follow-up... Read More
Art's Charts September 17, 2022 at 09:22 AM

The broad market environment remains bearish, but one group stood out in early August and continues to stand out. The Solar Energy ETF (TAN) was featured on August 1st as the Trend Composite turned bullish and clean energy was featured as an emerging theme on August 5th... Read More
Art's Charts September 09, 2022 at 10:19 AM
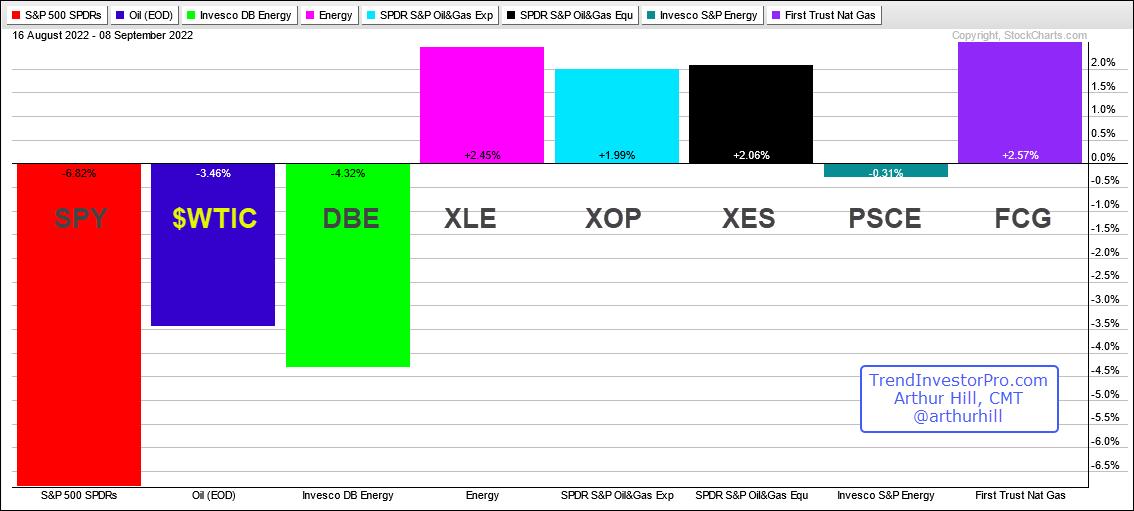
It has been a rough four weeks for stocks and oil, but the energy-related ETFs held up relatively well and remain in uptrends. The PerfChart below shows performance for SPY, oil, the DB Energy ETF (DBE) and five energy-related ETFs since August 16th, which is when SPY peaked... Read More
Art's Charts September 02, 2022 at 10:49 AM
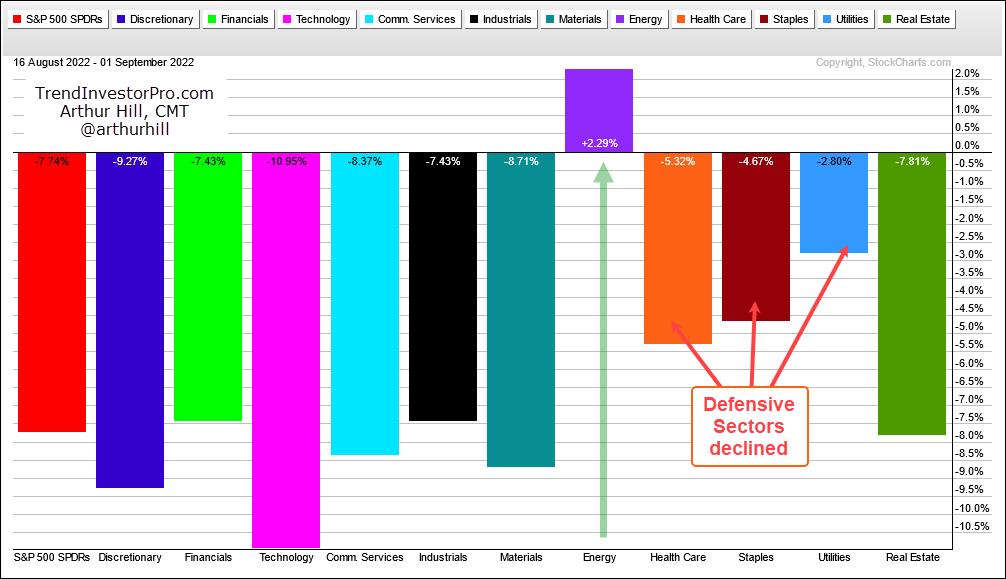
The short-term trends for the big three are down (SPY, QQQ, IWM) and we are in a bear market. Over the last two weeks, the short-term trend (down) aligned with the long-term trend (down). This is a powerful combination that can lead to rising correlation among stocks... Read More