 Technical analysts often scoff at the notion that a 20% decline marks a bear market. However, a look back shows that further losses are certainly possible after a 20% decline. Over the last 25 years, the last two bear markets started with declines in excess of 20% and the S&P 500 lost another 12% after the 20% decline in mid March 2020. The red arrow-lines on the chart below show when the S&P 500 declines more than 20% from a peak (daily closing prices). The red shading shows the subsequent declines. The S&P 500 fell another 35% after the initial 20% decline into early 2001 and fell another 45% after the initial 20% decline in 2008. The index fell another 12% after the initial 20% decline during the covid crash and then rebounded.
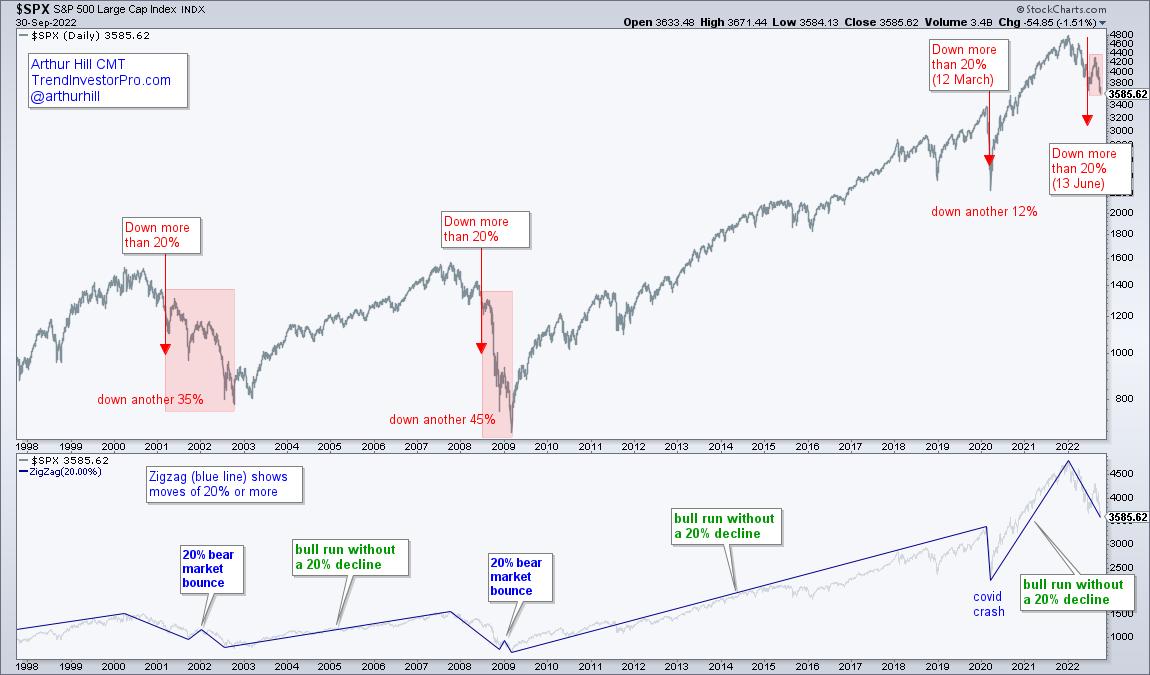
The indicator window shows the Zigzag indicator (blue lines) with the S&P 500. This indicator shows swings that are greater than 20%. Note that there were no 20% declines during three bull runs (2002 to 2007, 2009 to 2020 and March 2020 to December 2021). The S&P 500 also went the entire 90s without a 20% decline.
The blue callouts highlight two bear market bounces of at least 20%. These two bounces occurred over a year after the S&P 500 peaked and the index moved to new lows after these bounces. We already witnessed a 17% bear market rally from mid June to mid August. Judging from the last two bear markets, we can expect another counter-trend bounce at some point, but this is unlikely to be the bounce that ends the bear market.
No two bear markets are exactly the same, but we can study the last two bear markets to better understand the dynamics and set expectations going forward. In particular, there are the three phases of a bear market according to Dow Theory. We have also yet to see a capitulation phase that sets up a monster advance that typically signals an end to the bear market. This week I dissected the two bear markets and applied the lessons learned to the current bear market. This detailed report and accompanying video are available to subscribers of TrendInvestorPro. Click here for immediate access.
---------------------------------------
Choose a Strategy, Develop a Plan and Follow a Process
Arthur Hill, CMT
Chief Technical Strategist, TrendInvestorPro.com
Author, Define the Trend and Trade the Trend
Want to stay up to date with Arthur's latest market insights?
– Follow @ArthurHill on Twitter
