The Canadian Technician September 30, 2013 at 01:30 PM
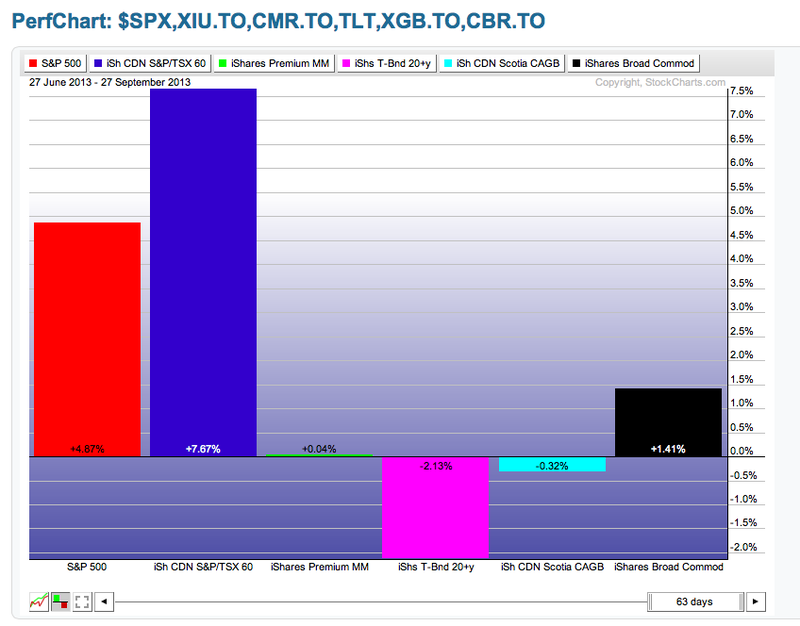
The performance charting tool called the perf chart compares the performance in percentage terms of different ticker symbols. Canada's underperformance seems to be improving as we have outperformed the $SPX over the last three months... Read More
The Canadian Technician September 26, 2013 at 06:32 AM
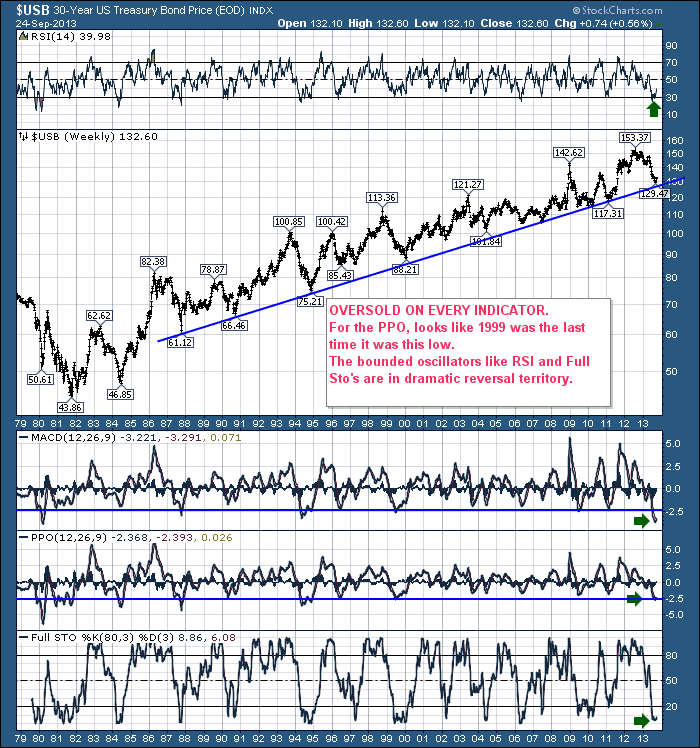
In response to my short blog about the 30 year Bond, I received lots of questions and comments. This is a long detailed blog about the $USB complete with closeups on momentum lows. Here is the chart I showed yesterday. The findings from the detailed review are pretty interesting... Read More
The Canadian Technician September 25, 2013 at 03:50 PM
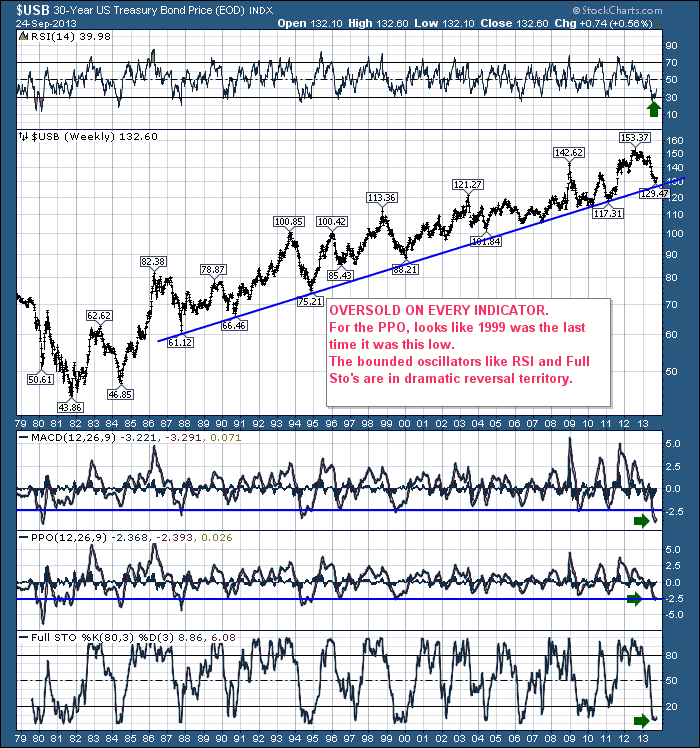
Here is a chart of the $USB going back to 1980. By any indicator it is either at record lows or similar extreme lows in terms of momentum. This would be one reason for playing reversion to the mean. For those interested, it might be a great trade... Read More
The Canadian Technician September 23, 2013 at 06:15 AM
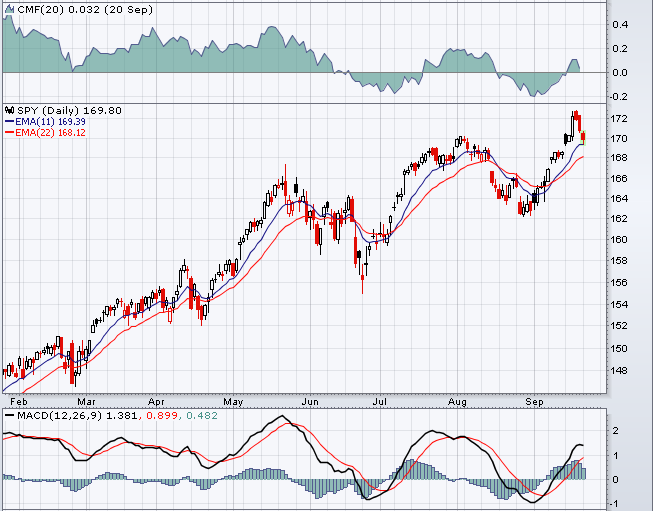
After coming back from NYC, it reminded me to review some of the subtle data in the sectors. Here is the SPY. So, what is the sector breakdown? That gets more interesting to see what is leading. Lets go through the sectors. I wanted to show two things here... Read More
The Canadian Technician September 20, 2013 at 12:10 PM
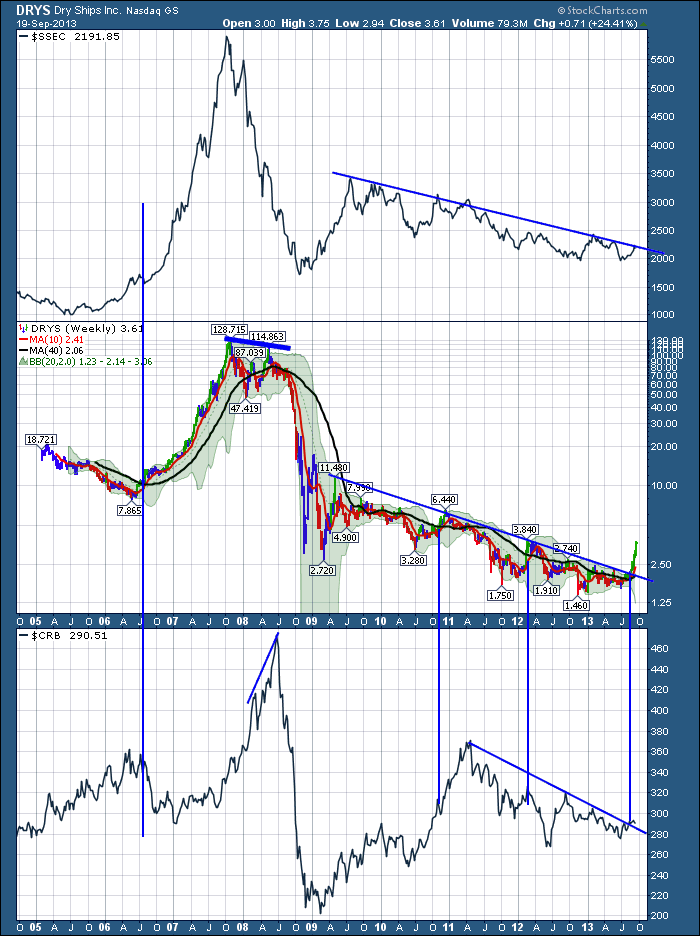
The stock market is littered with stocks that went to the moon and back. Canadians will remember JDSU and Nortel. Americans will remember Yahoo and Microsoft. The stock below was a darling into the 2006 runup. It has since had a small pullback of 99%... Read More
The Canadian Technician September 19, 2013 at 04:28 AM
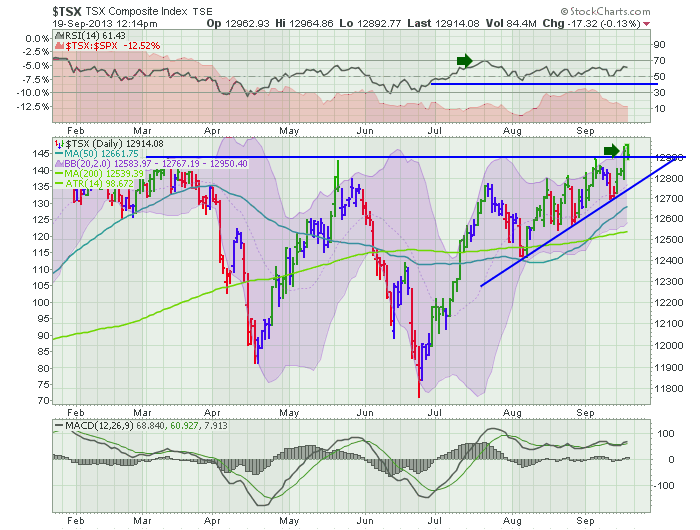
OK. The number of locations breaking out to new highs is consistent with a new bull market. Let's roll through them. Without charting the $SPX, $INDU, $COMPQ we know they are at new highs. Look at the $TSX... Read More
The Canadian Technician September 15, 2013 at 05:09 AM
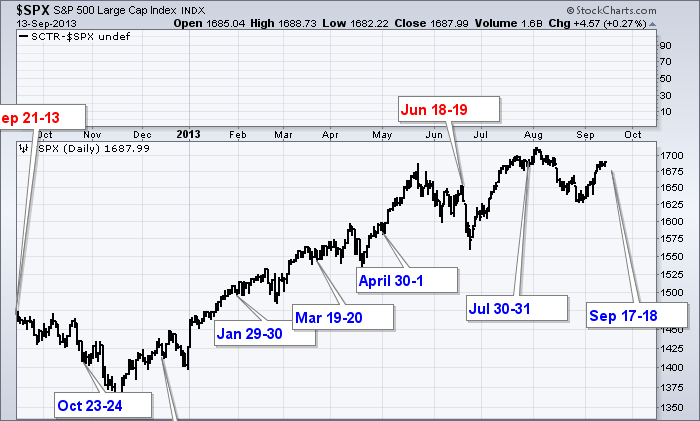
I keep a chart looking at what happened after the Fed meeting dates. Here is the last year. You can see if has provided lift at almost every meeting. The September meeting is on the far left edge. It was down from there into the November low... Read More
The Canadian Technician September 11, 2013 at 05:36 AM
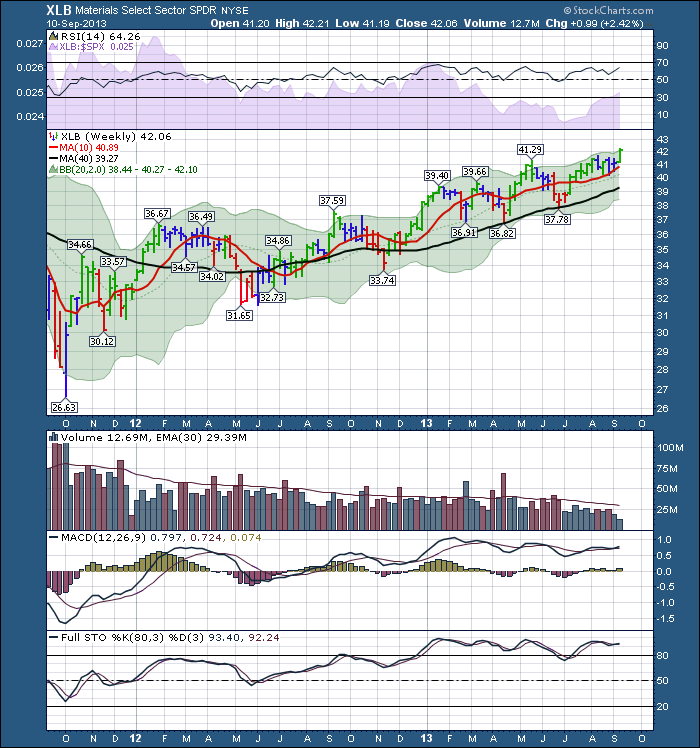
Here is the XLB. Here is the Canadian Materials Index. Can you believe the difference in the two indexes? One is bottom left to top right - a.k.a. Bullish. One is top left to bottom right - a.k.a. bearish... Read More
The Canadian Technician September 04, 2013 at 05:15 AM
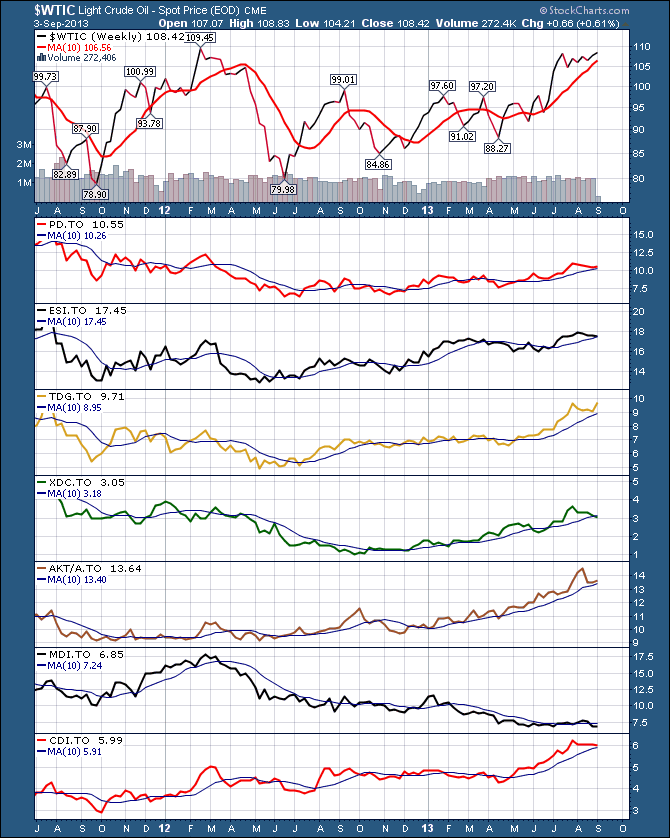
This is a pretty simple story. Higher oil prices mean more drilling. Only one is missing the love of the market towards these drillers. All of them are currently trying to bounce off the 10 week line. Usually a good entry in an uptrend where stops can be placed close by... Read More
The Canadian Technician September 02, 2013 at 02:15 PM

The vast majority of Canadian banks made new highs this week. Click here for a live chart. It is not uncommon for volume to spike on earnings weeks. But the real story was Volume, Volume, Volume relative to history... Read More