ChartWatchers May 14, 2004 at 10:05 PM

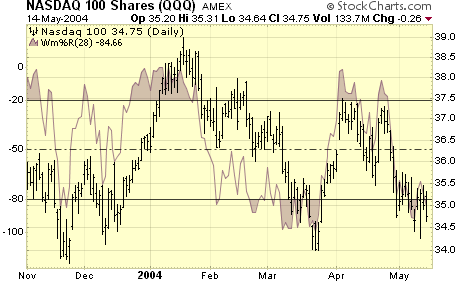
Although there is more than one way to interpret volatility, the simple fact is that the S&P 100 Volatility Index (VIX) and the Nasdaq 100 (VXN) trend lower when the market trends higher and trend higher when the market trends lower... Read More
ChartWatchers May 14, 2004 at 10:04 PM
At the end of April the XAU monthly Price Momentum Oscillator (PMO) -- not shown here -- topped at very overbought levels, rendering a long-term sell signal. This action confirmed the sell signal top on the weekly PMO a month earlier, shown on the chart above... Read More
ChartWatchers May 14, 2004 at 10:03 PM
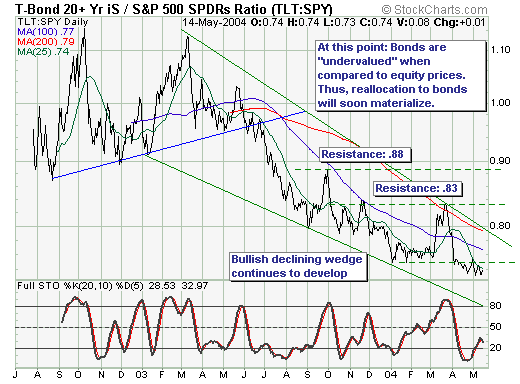
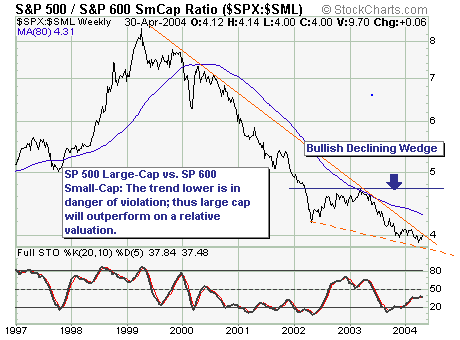
The recent capital market turmoil across the oceans and through all asset classes be it bonds or stocks or gold, has exacerbated certain risk-reward relationships between these asset classes as the "carry trade" is being unwound... Read More
ChartWatchers May 14, 2004 at 10:01 PM
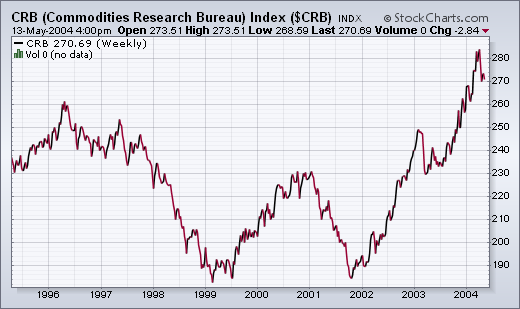
CPI AND PPI NUMBERS SURPRISE ECONOMISTS... The most frequently seen words in the financial press are "economists were surprised". It seems they're always being surprised by something. This week it was the "surprising" jump in the CPI and PPI inflation numbers... Read More
ChartWatchers May 14, 2004 at 10:00 PM
At the height of last Wednesday's big decline all of the major averages except one had moved below their 200-day (40-week) moving averages... Read More
ChartWatchers May 01, 2004 at 10:05 PM
There are three ingredients to a downtrend: lower high, lower low and trendline break. The final ingredient (trendline break) is open for debate, but the lower low and lower high are not... Read More
ChartWatchers May 01, 2004 at 10:04 PM

Here's a new chart we've just deployed on DecisionPoint.com, showing the 52-week new highs and new lows for just the stocks in the S&P 500 Index. I think this is useful because it shows what is happening with the stocks in the world's most "indexed" index... Read More
ChartWatchers May 01, 2004 at 10:03 PM
Over the course of the past 4-months, price action in all of the indices have been "locked" within wide trading ranges. One question to be be answered is whether this is a "consolidation" to new highs; or a "distribution" to lower lows... Read More
ChartWatchers May 01, 2004 at 10:02 PM

MURPHYMORRIS.COM TRANSITION COMPLETE - We have moved all of the MurphyMorris.com content from that website into the "John Murphy" section of StockCharts.com now... Read More
ChartWatchers May 01, 2004 at 10:01 PM
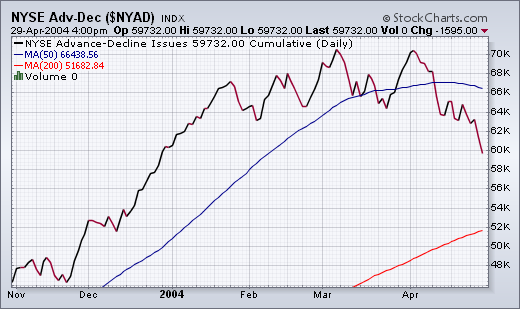
LOWEST LEVEL IN MONTHS... It's been awhile since we've talked about the Advance-Decline lines in the various markets. The two charts below show why we're showing them now. The NYSE Advance-Decline line has fallen to the lowest level in four months... Read More
ChartWatchers May 01, 2004 at 10:00 PM
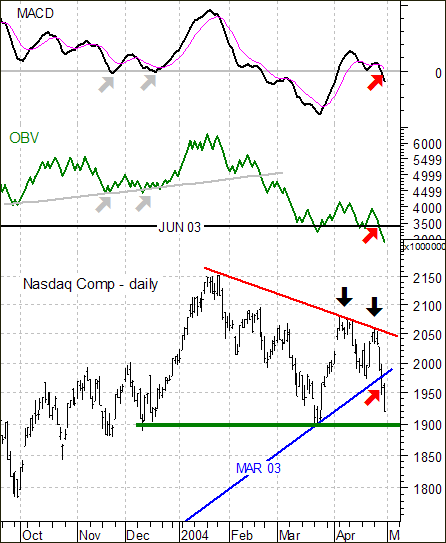
Rolling over. The short term technical picture shows the markets rolling over right now into a new down leg. The key test will be when the Nasdaq tries to move below 1900 this week. Right now, most technical signals point to much lower prices if that occurs... Read More