ChartWatchers September 16, 2017 at 06:38 PM
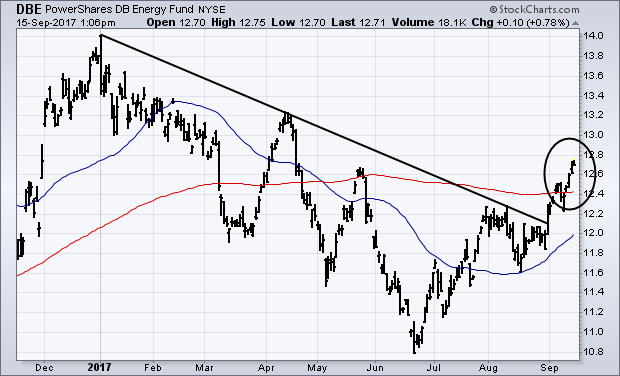
ENERGY ETF REACHES FIVE-MONTH HIGH ... It was reported Thursday that the headline CPI for August rose 0.4% from the previous month, which was its biggest monthly gain since January. That boosted its year-over-year comparison to 1... Read More
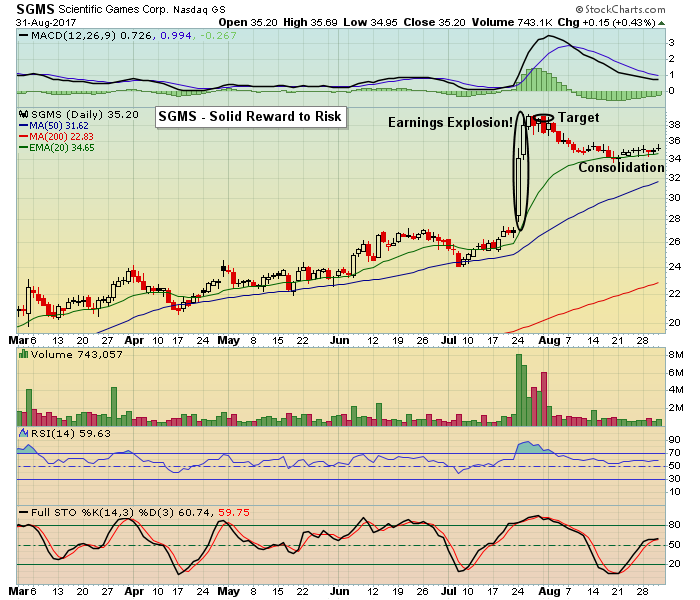
ChartWatchers September 16, 2017 at 01:14 PM
If only it was that easy, right? The problem many times is that a company that reports great results one quarter fails to do so the next... Read More
ChartWatchers September 16, 2017 at 11:38 AM
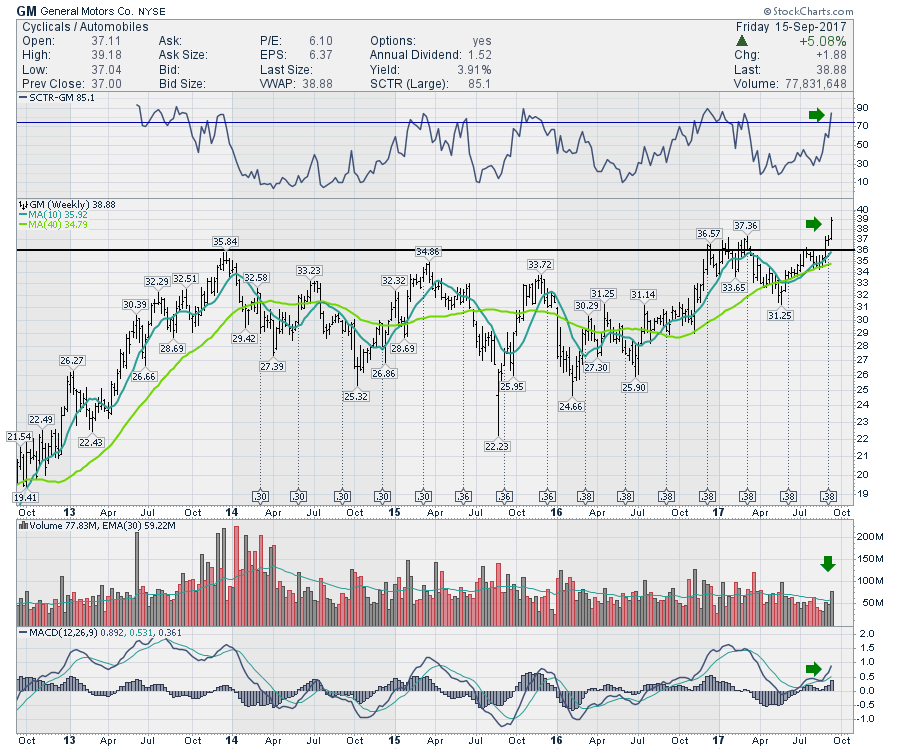
In the wake of the devastation of Hurricane Harvey and Hurricane Irma, a lot of cars were flooded. When scrolling through the auto charts, a few were breaking some trend lines this week. GM is pushing to new highs since basing for 4 years between $23 and $36... Read More
ChartWatchers September 16, 2017 at 11:32 AM

We all know what a trend line is, but does a trend line actually dictate the trend? In other words, does a trend line break actually signal a trend reversal? Or, is a trend line break telling us something else? We cannot use a tool unless we fully understand it and this article w... Read More
ChartWatchers September 15, 2017 at 07:31 PM
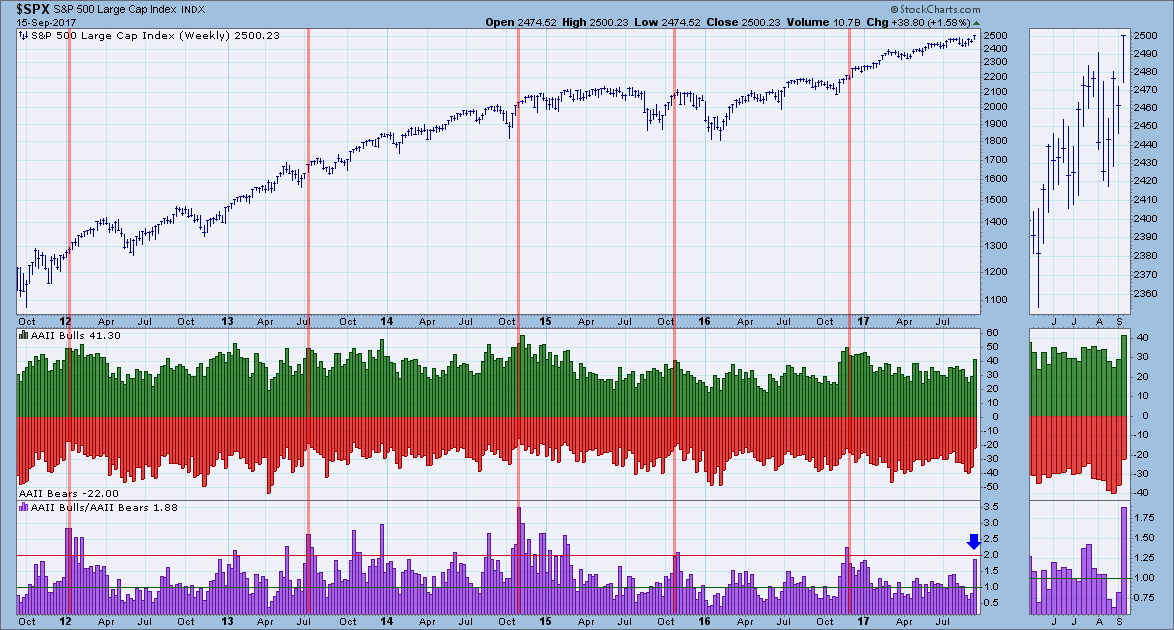
This week sentiment was mixed. Typically we see the American Association of Individual Investors (AAII) and National Association of Active Investment Managers (NAAIM) exposure index give the same message... Read More
ChartWatchers September 15, 2017 at 06:31 PM
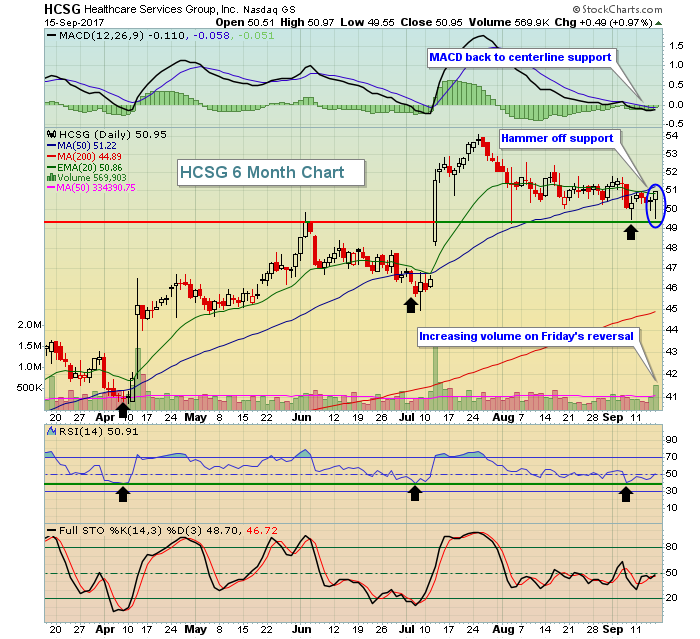
One of the benefits of technical analysis is being able to look at a chart to help determine if a stock is a viable trading candidate... Read More
ChartWatchers September 03, 2017 at 02:45 AM
The Australia All Ords Index ($AORD) is trading well below its April-May highs and stuck in a long and tight consolidation. In contrast, the Australian iShares (EWA) hit a 52-week high in late July and remains close to this high... Read More
ChartWatchers September 02, 2017 at 03:51 PM
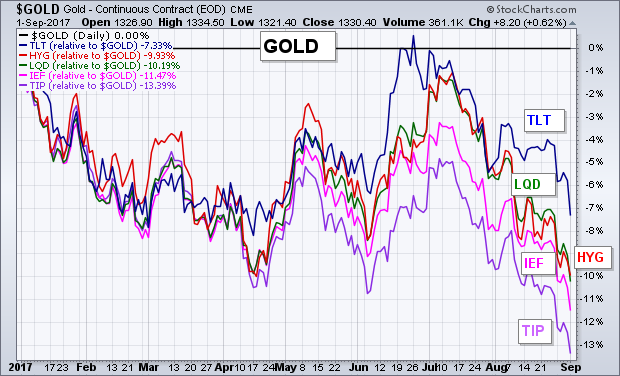
During the week, I wrote about gold (and gold miners) achieving upside breakouts and outperforming stocks for the first time since 2011. Gold, however, is also doing better than bonds for the first time in six years. Not just some bond categories, but all of them... Read More
ChartWatchers September 02, 2017 at 11:56 AM
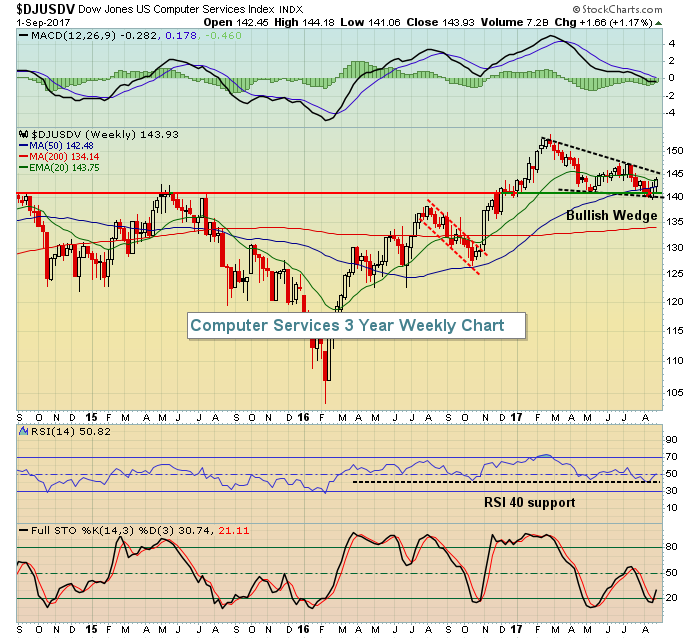
One of my trading strategies is to trade the best stocks in the best industries at the best price... Read More
ChartWatchers September 02, 2017 at 09:05 AM
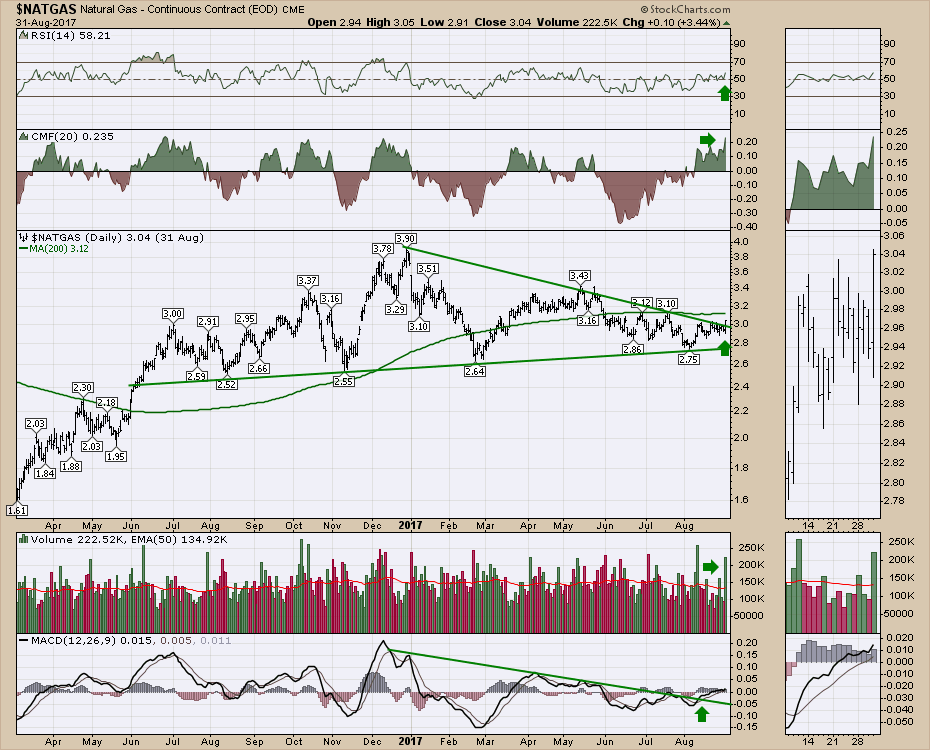
I get it. Energy has been the worst sector for the last 8 months. Everything is ugly. So is there absolutely no hope? There are some wonderful clues on the charts that this might start to heat up... Read More
ChartWatchers September 02, 2017 at 01:00 AM

As I prepared for the MarketWatchers LIVE segment on sentiment today, I was surprised to see investors and money managers are getting very bearish. Put/Call ratios show a bearish bias as well. It is important to remember that sentiment is a "contrarian" indicator... Read More
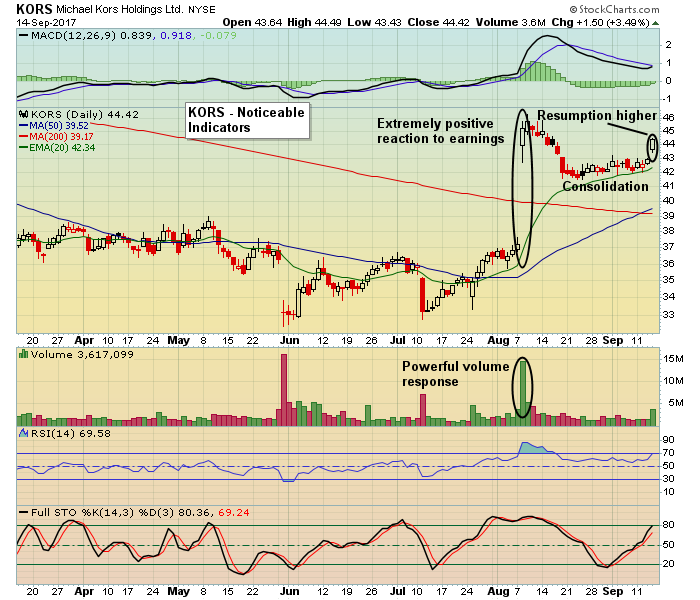
ChartWatchers September 01, 2017 at 07:32 PM
Q2 earnings season has come and gone and traders liked what they heard and saw. This is the primary reason the market has come to life, in spite of some things going on out there that might normally spook the market... Read More