ChartWatchers September 27, 2019 at 11:48 PM
It was another bumpy week in the markets, as investors digested a barrage of political headlines which brought fear-induced selling to those areas most sensitive to the latest tweet... Read More
ChartWatchers September 27, 2019 at 10:46 PM
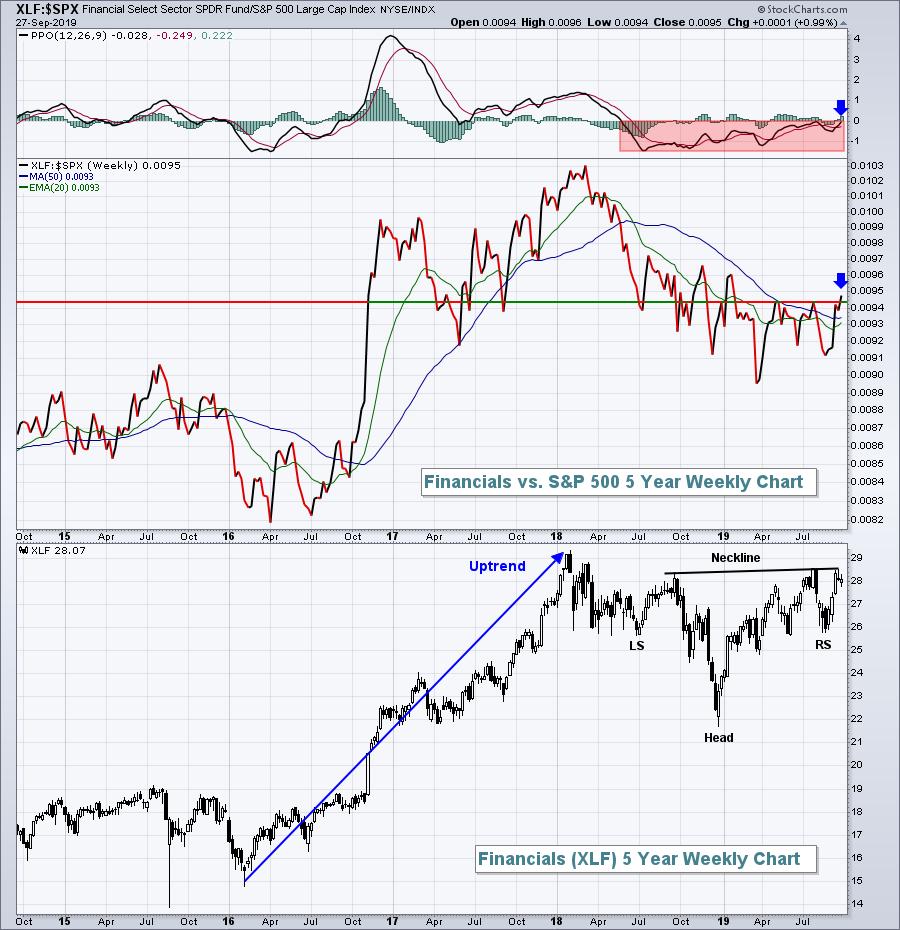
Financials (XLF) had been rather dormant for nearly 18 months - at least on a relative basis to the S&P 500 - but that is all about to change... Read More
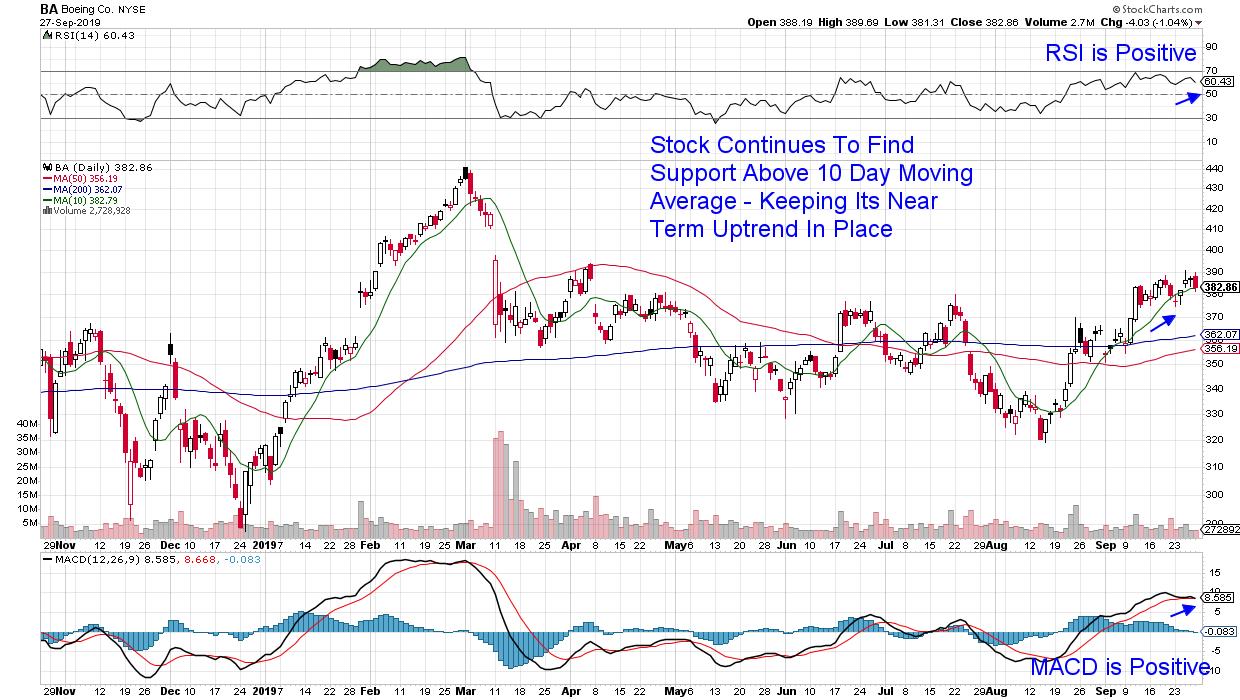
ChartWatchers September 27, 2019 at 08:30 PM
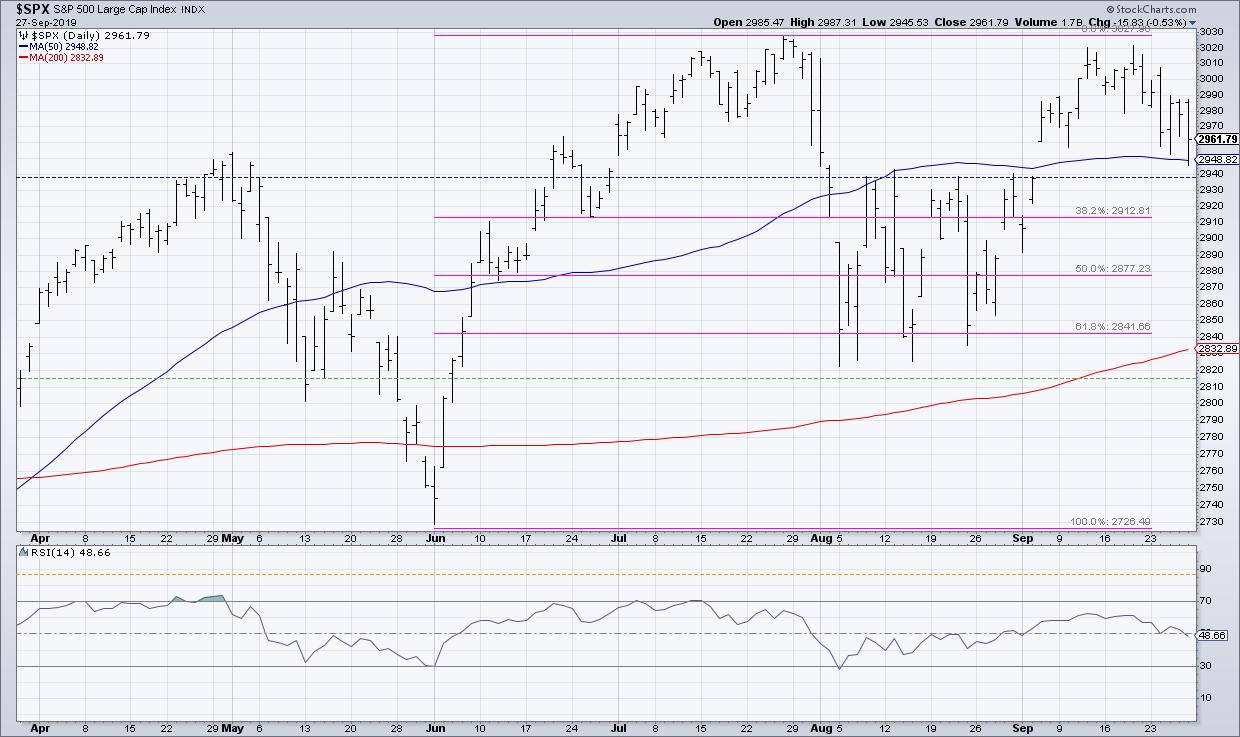
Recently, a reader responded to one of my articles on the S&P 500 and asked about the value of support and resistance levels on a broad market index... Read More
ChartWatchers September 27, 2019 at 03:32 PM
Editor's Note: This article was originally published in Martin Pring's Market Roundup on Friday, September 27th at 1:25pm ET... Read More
ChartWatchers September 27, 2019 at 02:05 PM

From time to time, you come across new or different ways to look at things or describe them. In my RRG blog from Tuesday, I introduced the concept of military overwatch tactics and compared them to Relative Rotation Graphs... Read More
ChartWatchers September 20, 2019 at 11:53 PM
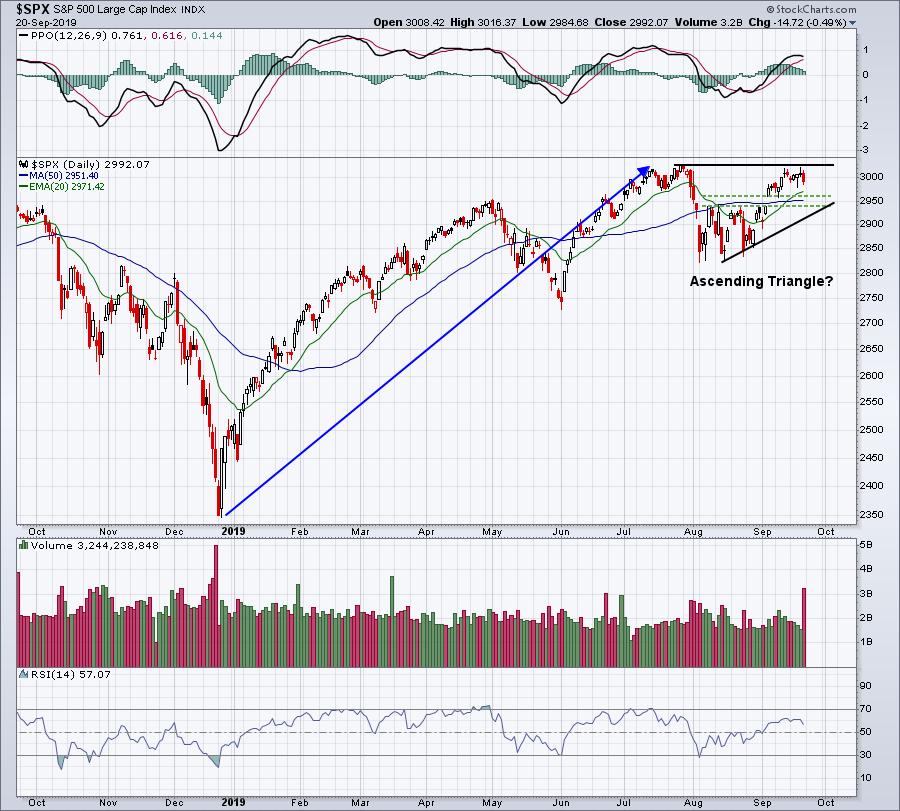
Technically, it makes sense to lessen stock exposure any time a major price resistance level is challenged. The all-time high close on the S&P 500 is 3025.86, set on July 26, 2019. On Thursday, the S&P 500 hit 3021.99, less than 4 points from that key level... Read More
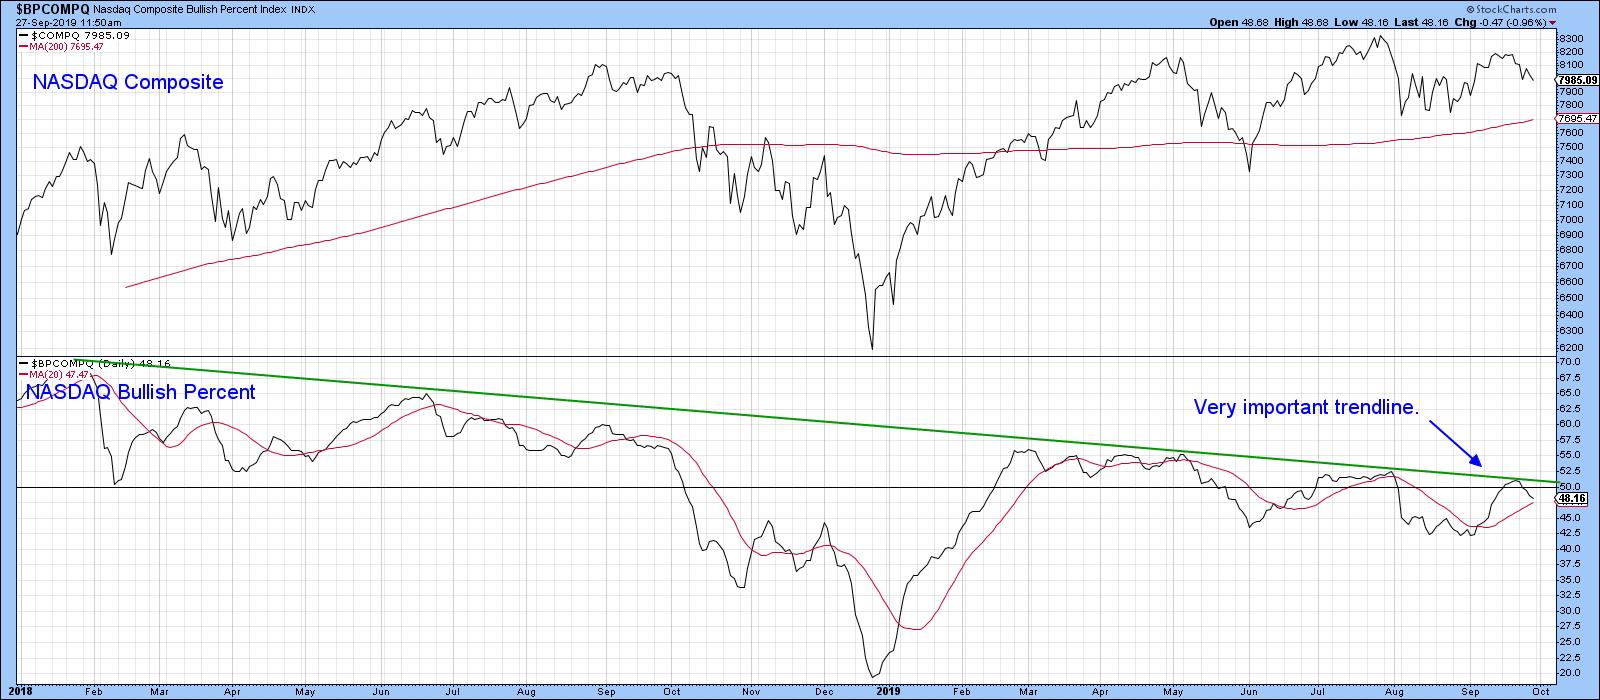
ChartWatchers September 20, 2019 at 06:36 PM
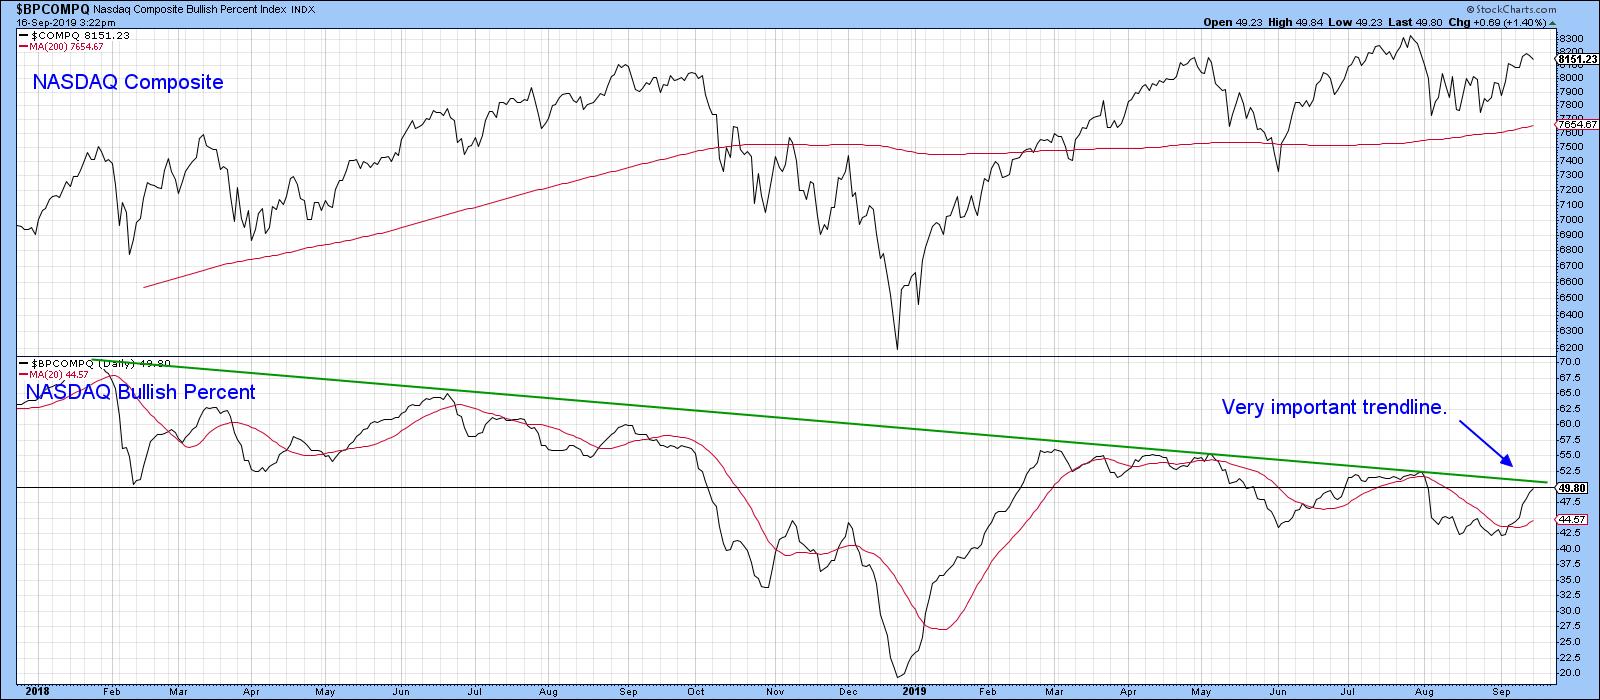
Editor's Note: This article was originally published in Martin Pring's Market Roundup on Monday, September 16th at 6:04pm ET. First of all, Chart 4 features the NASDAQ bullish percentage... Read More
ChartWatchers September 20, 2019 at 05:58 PM
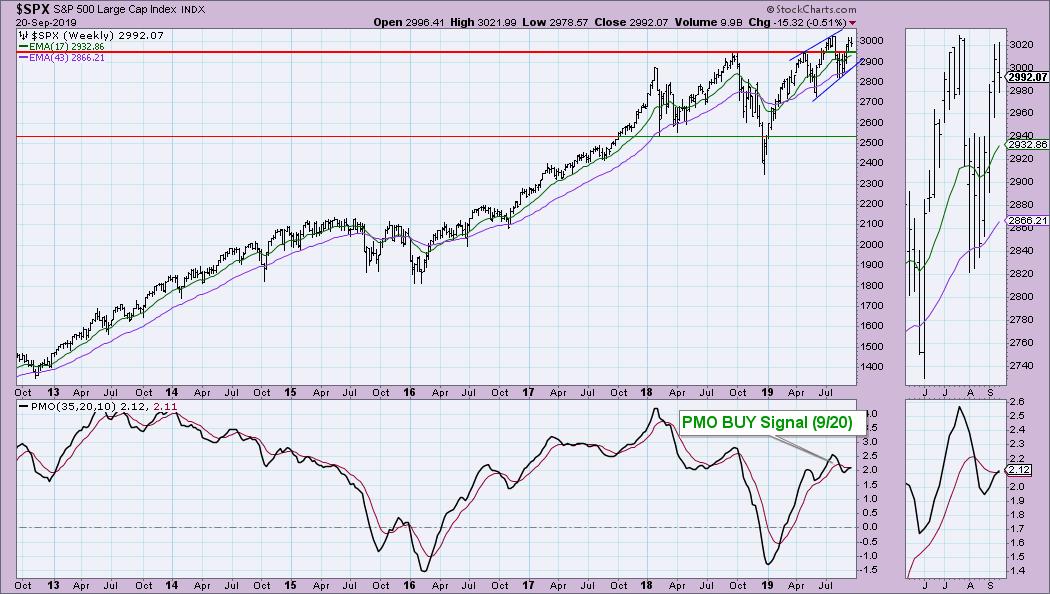
After challenging the all-time highs, the market has continued to chop along. In spite of a lackluster few weeks, the weekly Price Momentum Oscillator (PMO) managed to cross above its signal line on both the SPX and OEX, while the Dow is just about there... Read More
ChartWatchers September 20, 2019 at 05:06 PM
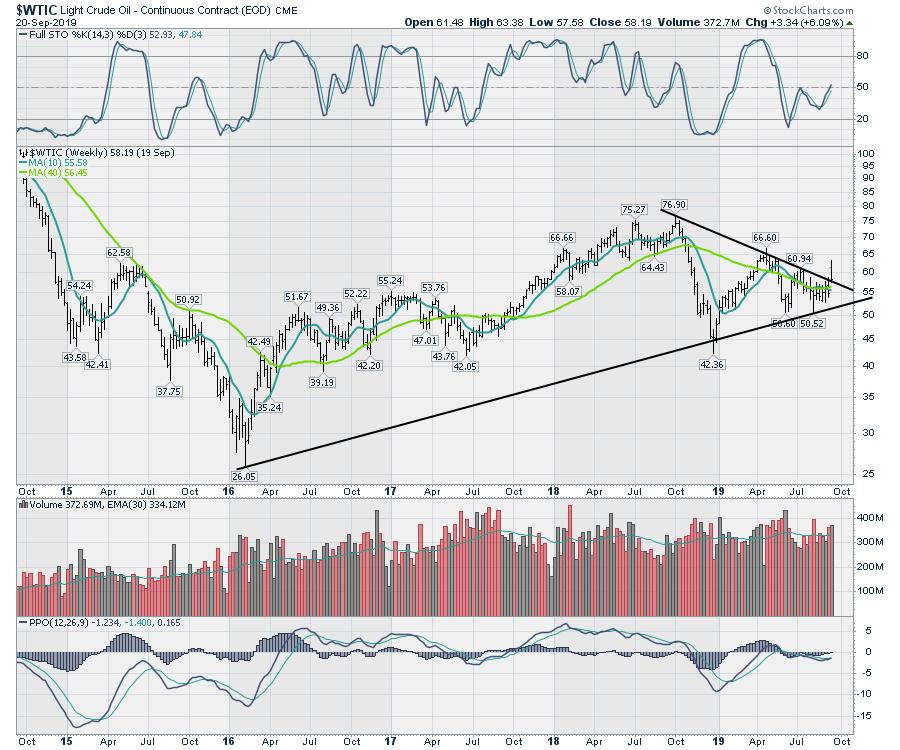
I have been very bullish on the markets recently and they have continued to perform pretty well until this week. With global markets breaking out to new highs, some promise in emerging markets and a rebound in the commodities, it has been a quick run up from the August lows... Read More
ChartWatchers September 20, 2019 at 04:16 PM

Mean-reversion signals provide a great way to trade in the direction of the bigger uptrend after a pullback. The trick is to identify the bigger uptrend and then capture mean-reversion setups. Mean-reversion setups materialize after a pullback within the uptrend... Read More
ChartWatchers September 14, 2019 at 12:01 AM
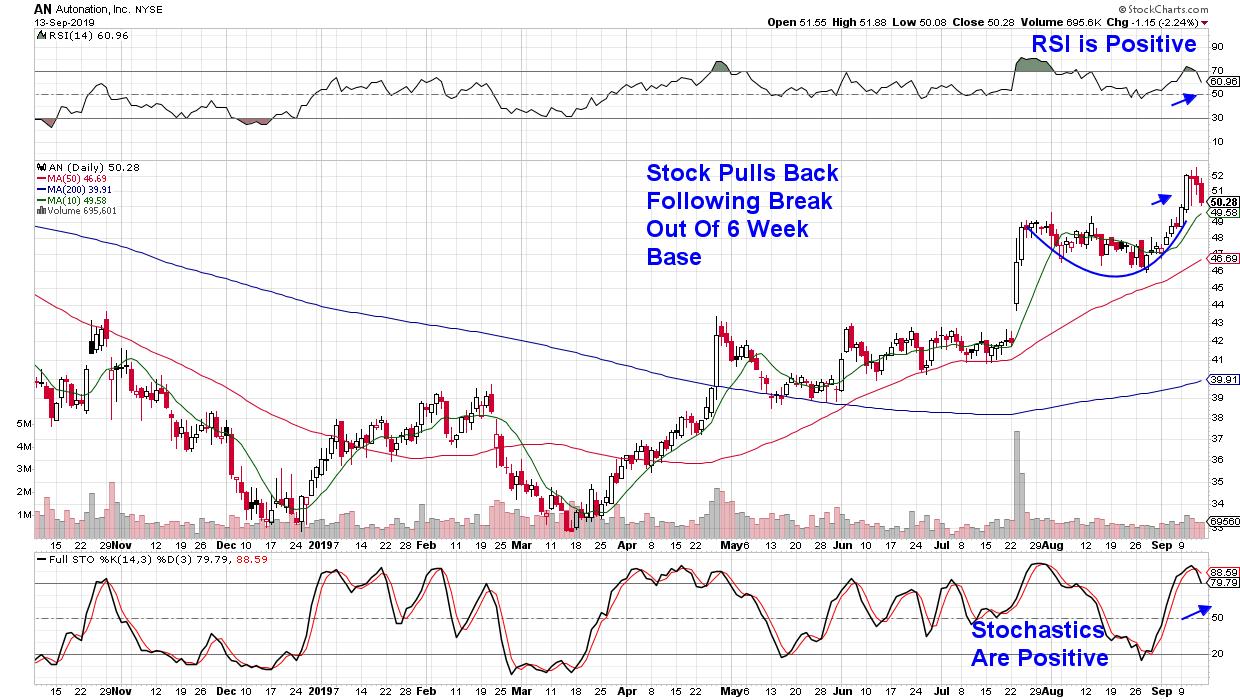
U.S. retail sales came in stronger than expected for the month of August and, while internet sales and home goods saw a pickup, the real boost in last month's retail numbers came from auto sales... Read More
ChartWatchers September 13, 2019 at 10:55 PM
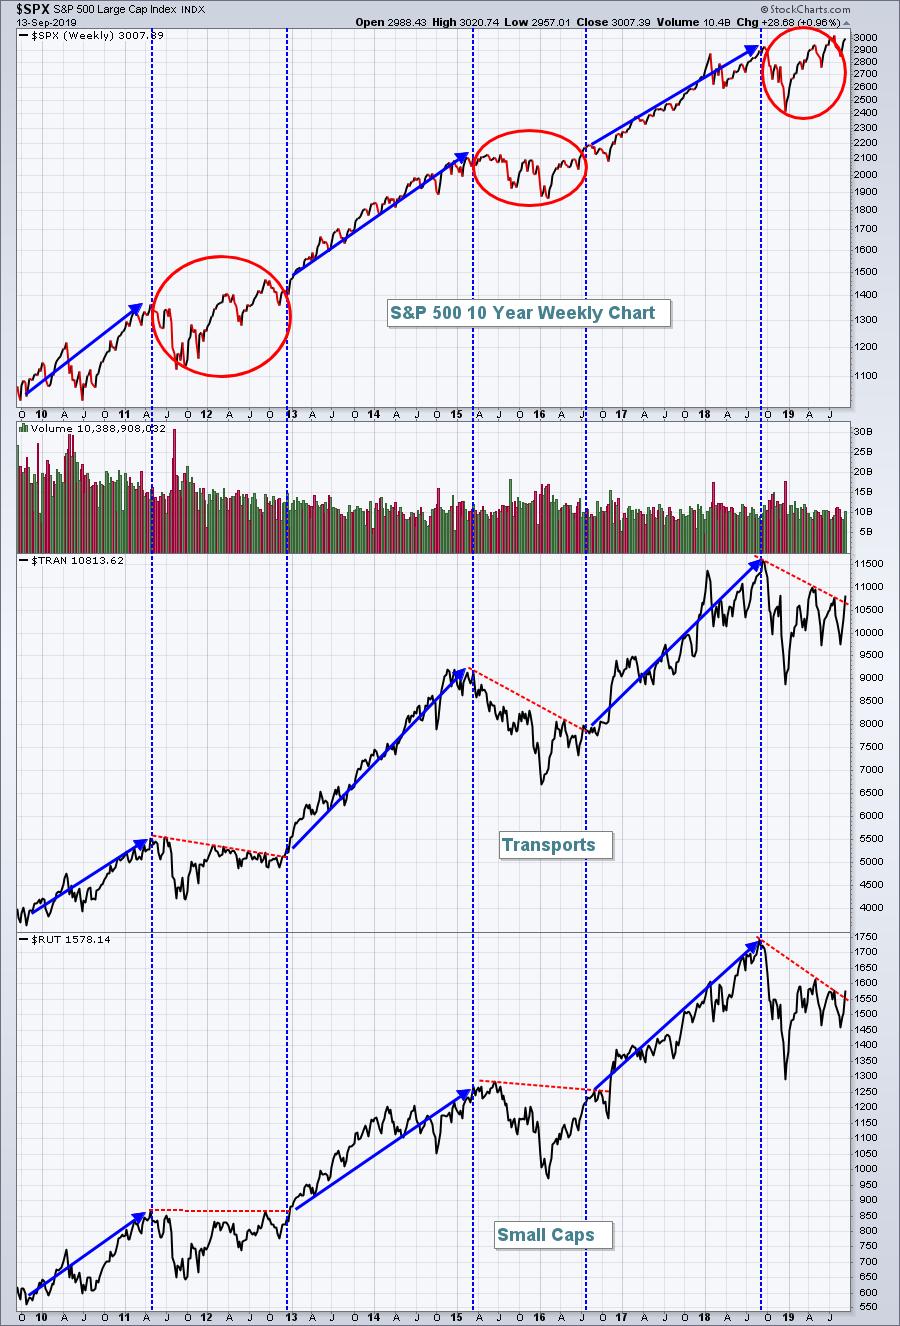
I've been adamant that we remain in a secular bull market, and I'm sticking to it. Yes, September scares me. The Fed petrifies me. And no more tweets, please! Oh, and let's not forget about the inverted yield curve (which isn't inverted any longer, by the way)... Read More
ChartWatchers September 13, 2019 at 06:57 PM
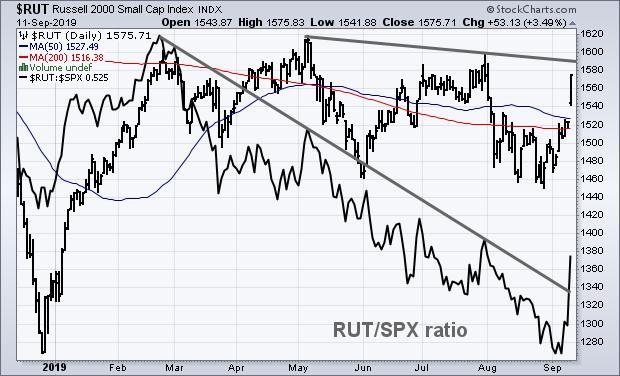
Editor's Note: This article was originally published in John Murphy's Market Message on Wednesday, September 11th at 5:14pm ET. Smaller stocks were the stars of today's stock action... Read More
ChartWatchers September 13, 2019 at 06:51 PM
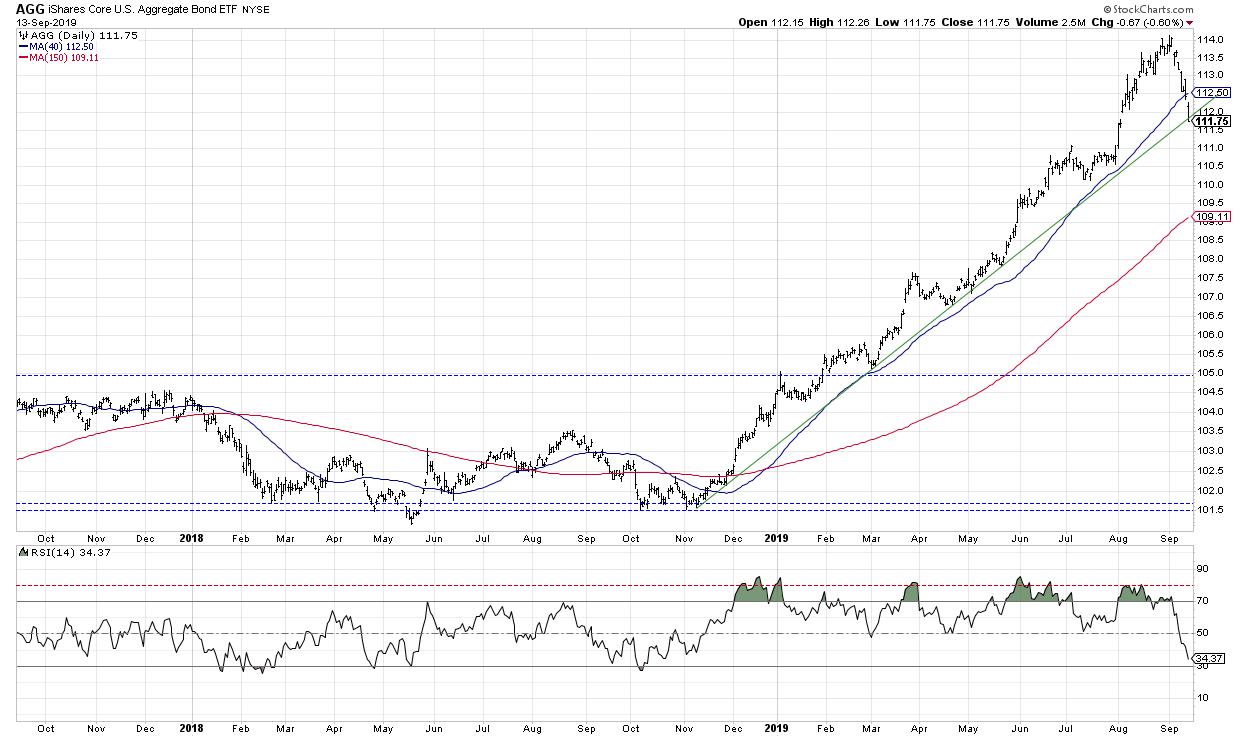
I've written before about RSI and the difference between "good" overbought and "bad" overbought. In the future, we may see the bond prices of these past few weeks used as examples of how to interpret extreme overbought conditions... Read More
ChartWatchers September 13, 2019 at 12:39 PM
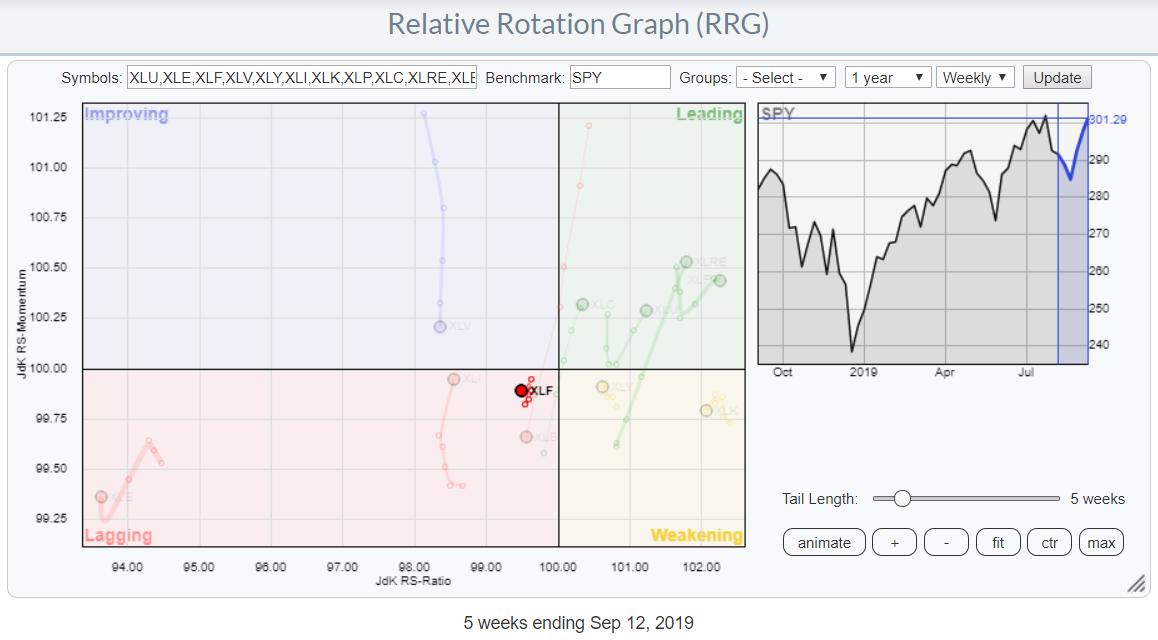
On the weekly Relative Rotation Graph for US sectors, the Financial sector is positioned just inside the lagging quadrant, very close to the benchmark (center of the chart)... Read More
ChartWatchers September 06, 2019 at 08:11 PM

Very soon, I will be launching a daily newsletter for DecisionPoint that will give you some stocks that have presented themselves in one of my many DecisionPoint scans. I do the analysis so you don't have to... Read More
ChartWatchers September 06, 2019 at 07:36 PM
This week, China agreed to continue negotiations on the China-US trade deal. While that is news that the market can look forward to seeing play out, it definitely helped the charts technically. Thus, the indexes look set to take a run at the nearby highs... Read More
ChartWatchers September 06, 2019 at 04:44 PM
The excitement is building as Tom Bowley gets ready to rejoin the EarningsBeats.com team as Chief Market Strategist. Why the excitement? Because Tom's experience as Senior Technical Analyst at StockCharts... Read More
ChartWatchers September 06, 2019 at 04:14 PM

Major bullish reversal patterns signal the start of new up trends that can extend and be very profitable. However, chartists must first learn to distinguish between meaningful patterns and irrelevant patterns. Here's how..... Read More
ChartWatchers September 06, 2019 at 02:40 PM
Editor's Note: This article was originally published in John Murphy's Market Message on Thursday, September 5th at 10:46am ET. A rally in global stocks has taken a turn for the better with major stock indexes clearing some upside resistance barriers... Read More