ChartWatchers November 29, 2019 at 07:16 PM
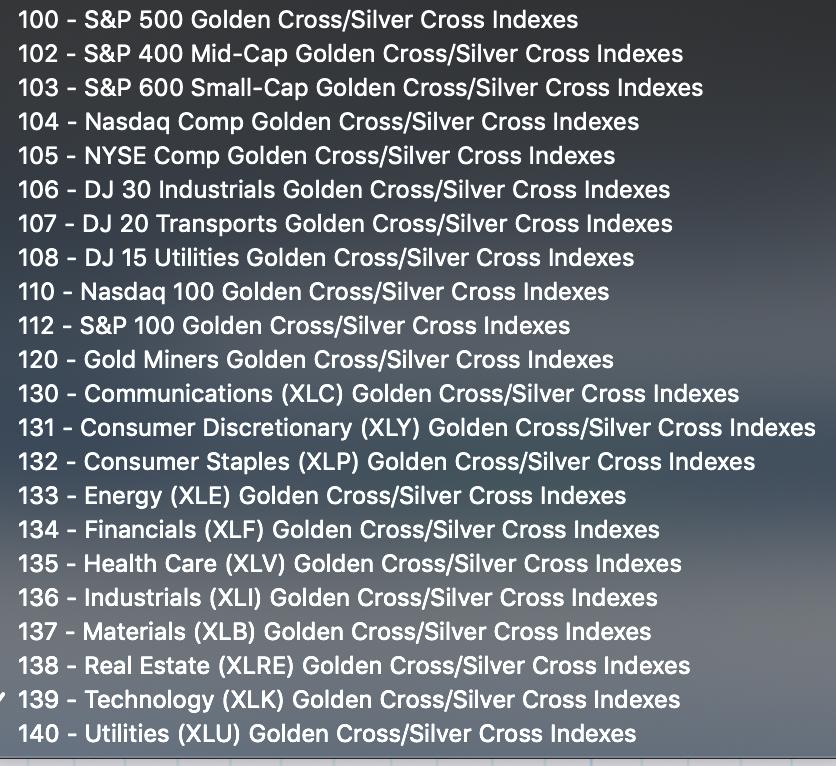
On our November 20, 2019 DecisionPoint show on StockCharts TV, Carl and I introduced the new Golden Cross and Silver Cross Indexes. The Golden Cross Index measures the percentage of components in an index or sector that are on LT Trend Model BUY signals (50-EMA > 200-EMA)... Read More
ChartWatchers November 29, 2019 at 06:00 PM
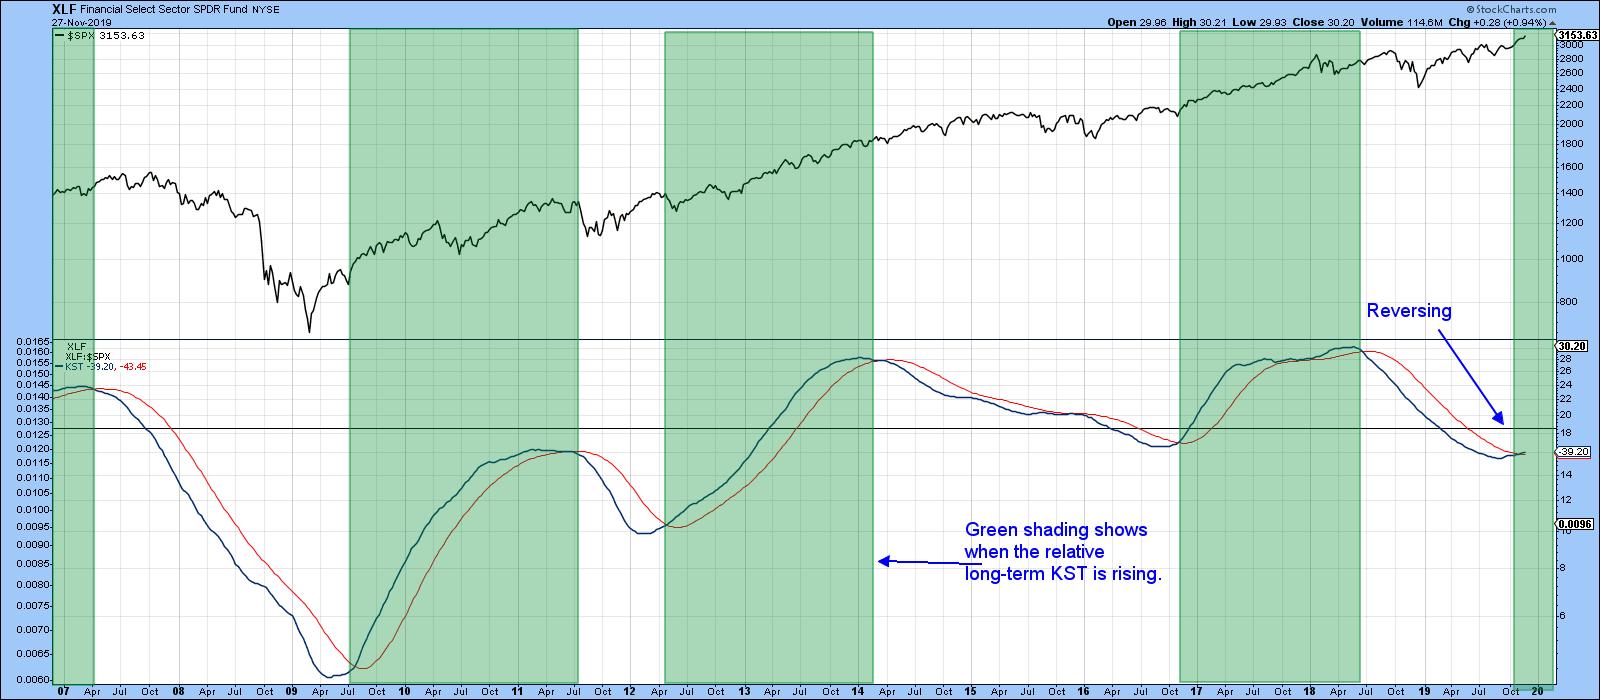
Editor's Note: This article was originally published in Martin Pring's Market Roundup on Thursday, November 28th at 4:08pm ET. Chart 3 shows a long-term indicator that just went bullish for the market... Read More
ChartWatchers November 29, 2019 at 05:15 PM
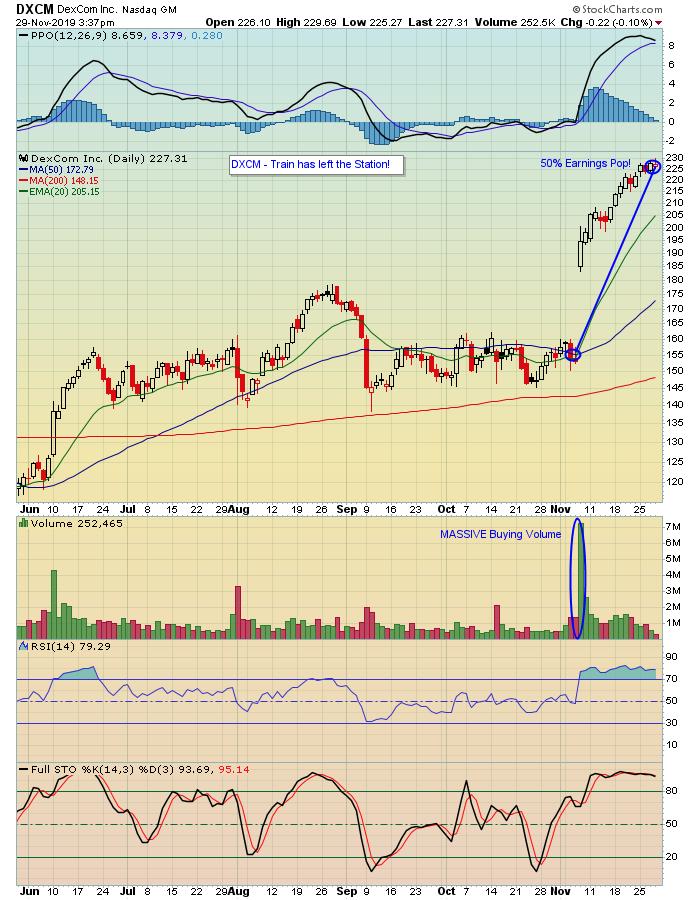
The market has mostly been straight up since the October 3 bottom, when the S&P touched 2855 before heading north. Since then, the S&P has climbed more than 10%, with buyers ready and willing to buy on any dips... Read More
ChartWatchers November 29, 2019 at 04:49 PM

Black Friday weekend is here and the holiday shopping season is just getting started. While I have no clue which retailers will be the big winners or losers this season, the mobile payments industry is likely to be a big winner... Read More
ChartWatchers November 22, 2019 at 11:50 PM
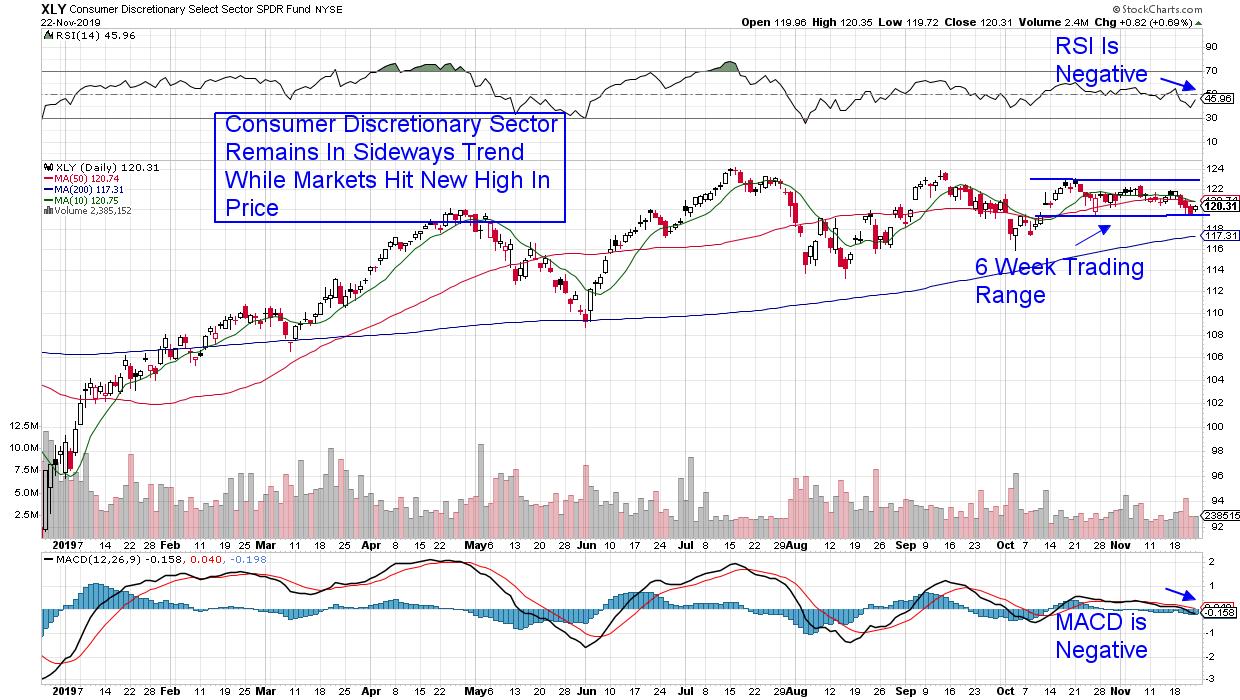
The University of Michigan's Index of Consumer Sentiment hit its 4th straight monthly gain with a 96.8 level that was above estimates... Read More
ChartWatchers November 22, 2019 at 10:28 PM
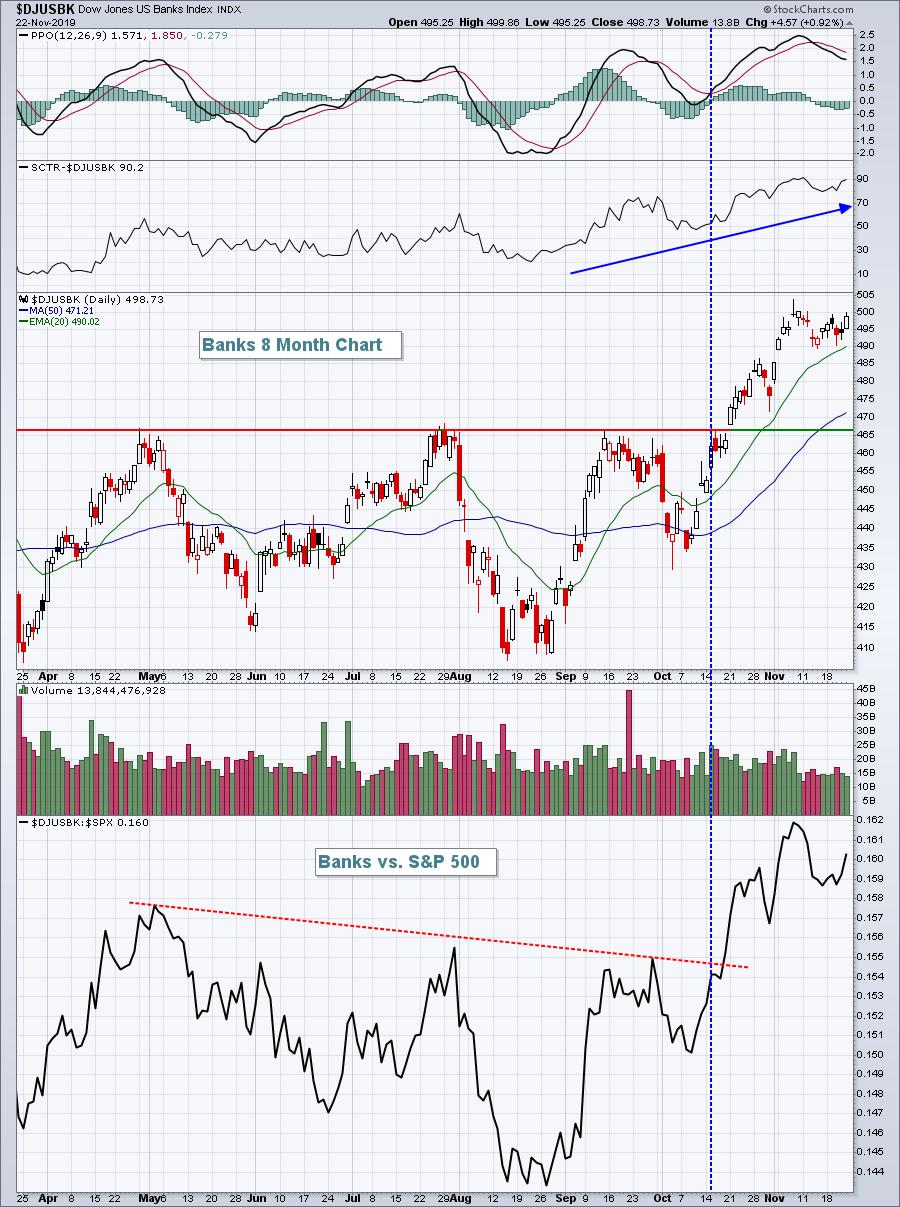
Over the past few months, we've seen some new market leadership emerge. If you're simply following the S&P 500, then you probably haven't noticed much difference. We consolidated a bit in August and September before then resuming the uptrend... Read More
ChartWatchers November 22, 2019 at 07:07 PM
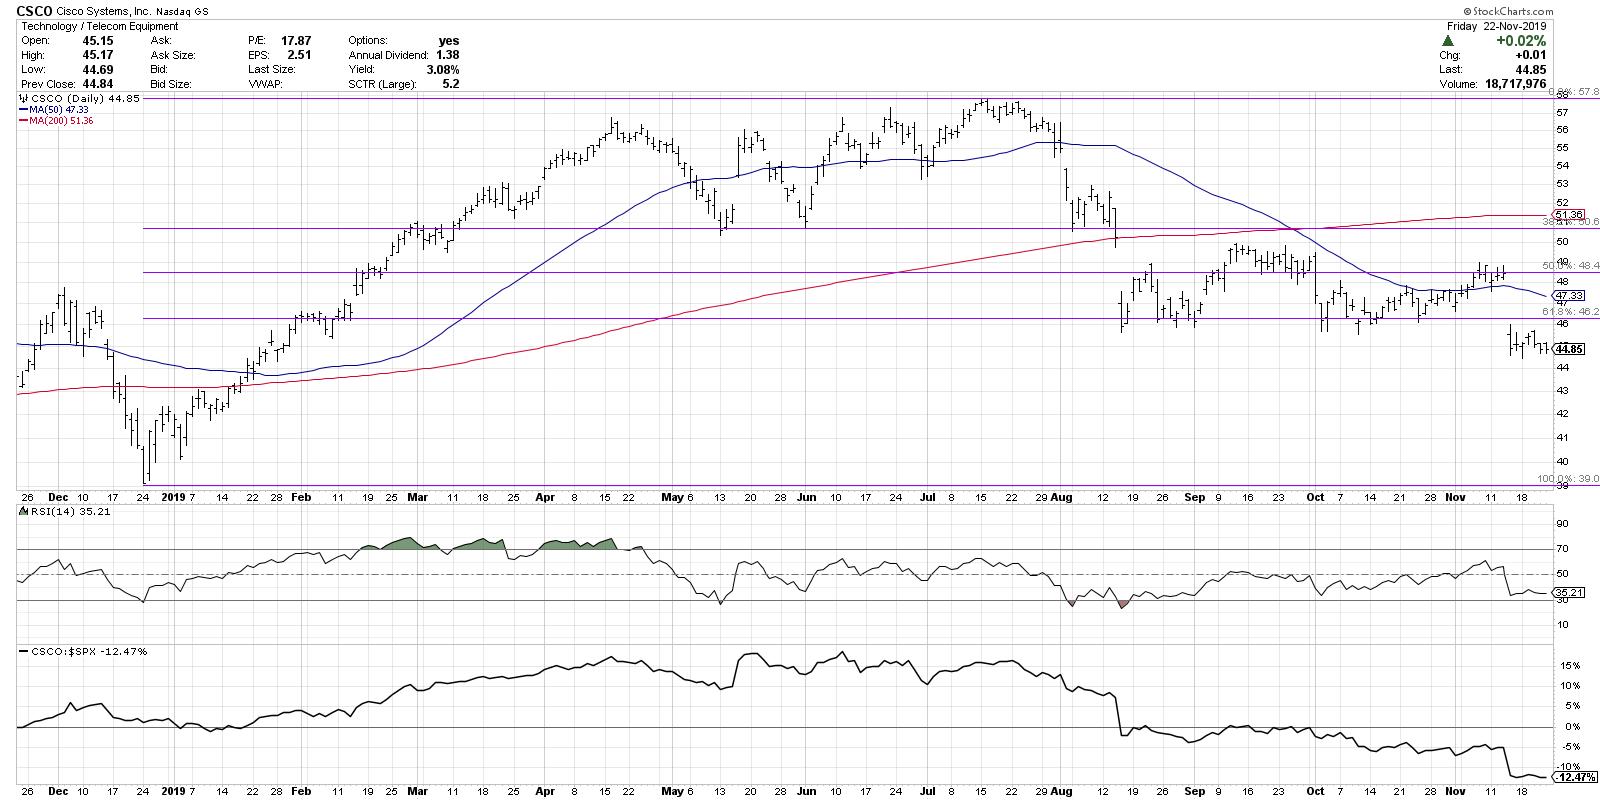
When I worked for a large asset management firm, we had a number of fantastic digital displays that allowed us to view stock charts on a massive scale. The size of the screens made the work of identifying trends and inflection points much easier - and also way more fun... Read More
ChartWatchers November 22, 2019 at 02:29 PM
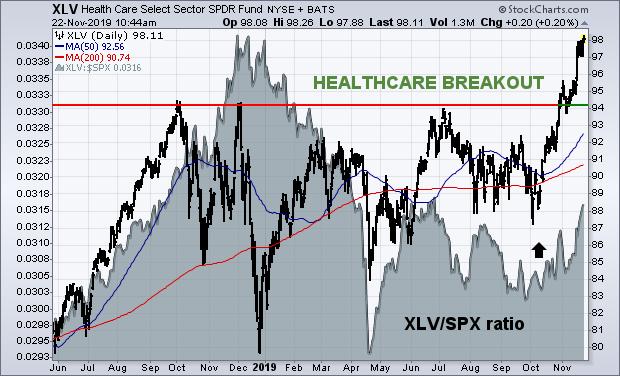
Editor's Note: This article was originally published in John Murphy's Market Message on Friday, November 22nd at 12:01pm ET. Last Friday's message wrote about healthcare stocks going from one of the market's weakest sectors to one of the strongest... Read More
ChartWatchers November 22, 2019 at 01:30 PM
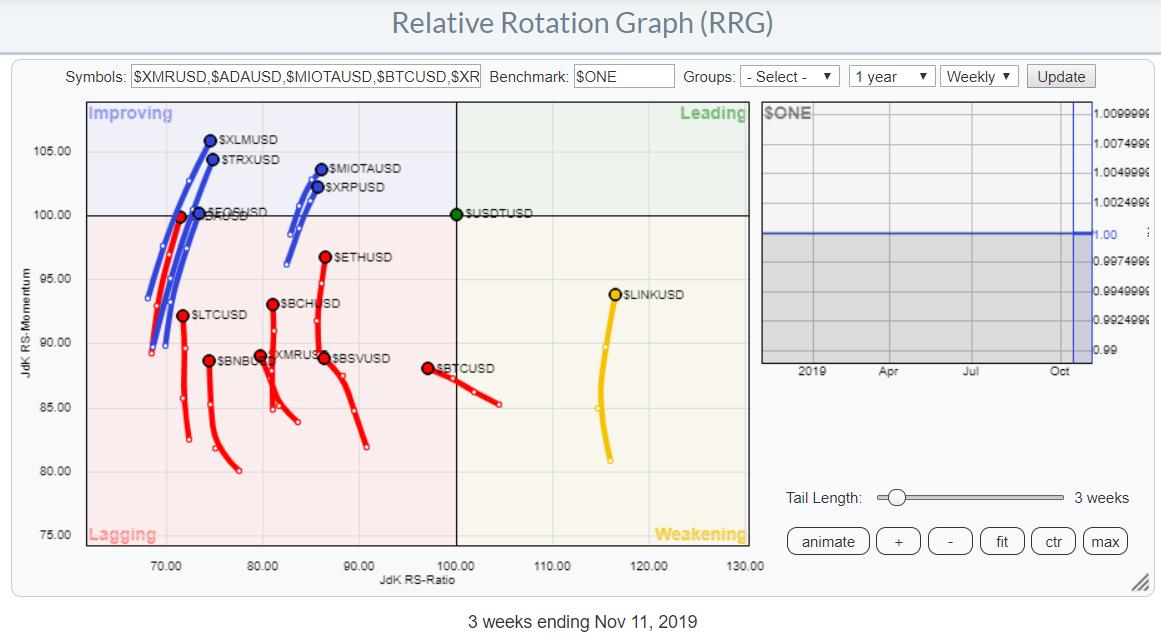
On 8 November, StockCharts.com announced the arrival of cryptocurrency data in this ChartWatchers article. Regardless of what you think of cryptocurrencies, it's becoming increasingly hard to ignore them as the group of people that engage in trading them continues to grow... Read More
ChartWatchers November 15, 2019 at 06:46 PM

For those of you not yet familiar, I have started a new report in our blog called "DecisionPoint Daily Diamonds", in which I select five stocks or "diamonds in the rough" from the results of one of my many DecisionPoint scans... Read More
ChartWatchers November 15, 2019 at 06:41 PM
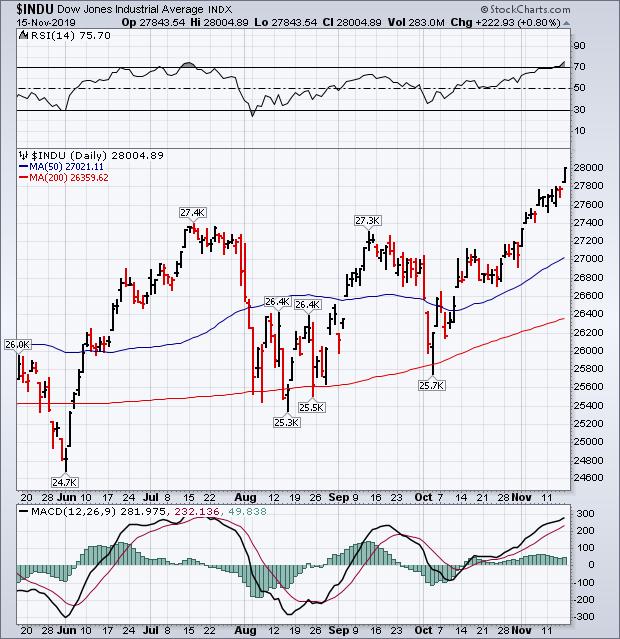
Editor's Note: This article was originally published in John Murphy's Market Message on Friday, November 15th at 4:14pm ET. Stocks are ending the week in record territory. The three charts below show the three major U.S. stock indexes closing at record highs on Friday... Read More
ChartWatchers November 15, 2019 at 06:33 PM
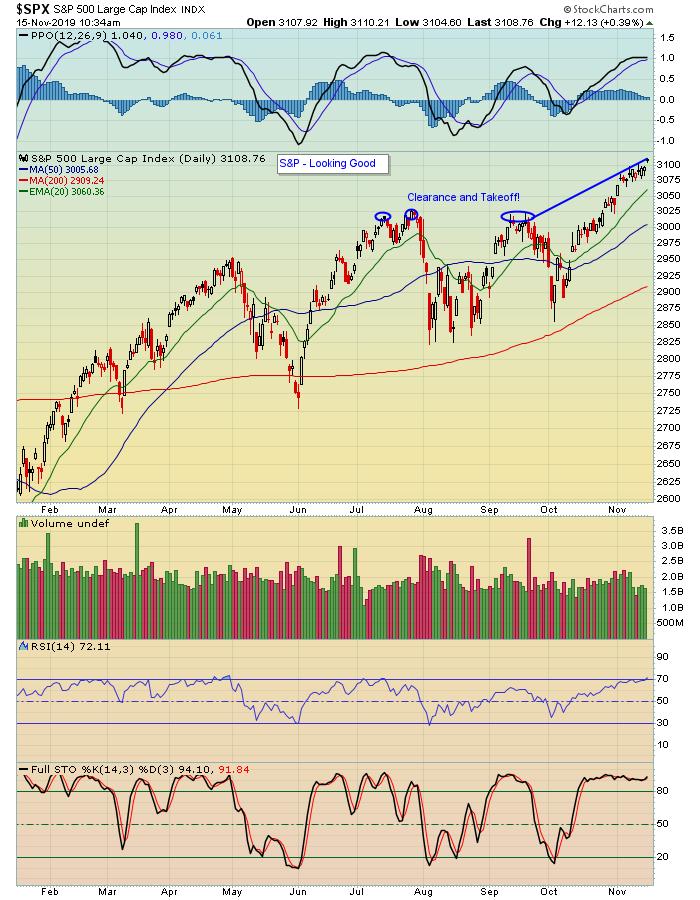
First off, it gives me GREAT pleasure to announce our first ever online Financial Conference, Market Vision 2020, which will take place just as the new year begins. EarningsBeats... Read More
ChartWatchers November 15, 2019 at 06:05 PM

The character of the stock market changed over the last six to seven weeks as the market took on a more offensive tone. Don't get me wrong. The stock market was already in bull mode and the S&P 500 has been above its 200-day SMA since early June... Read More
ChartWatchers November 09, 2019 at 12:19 AM
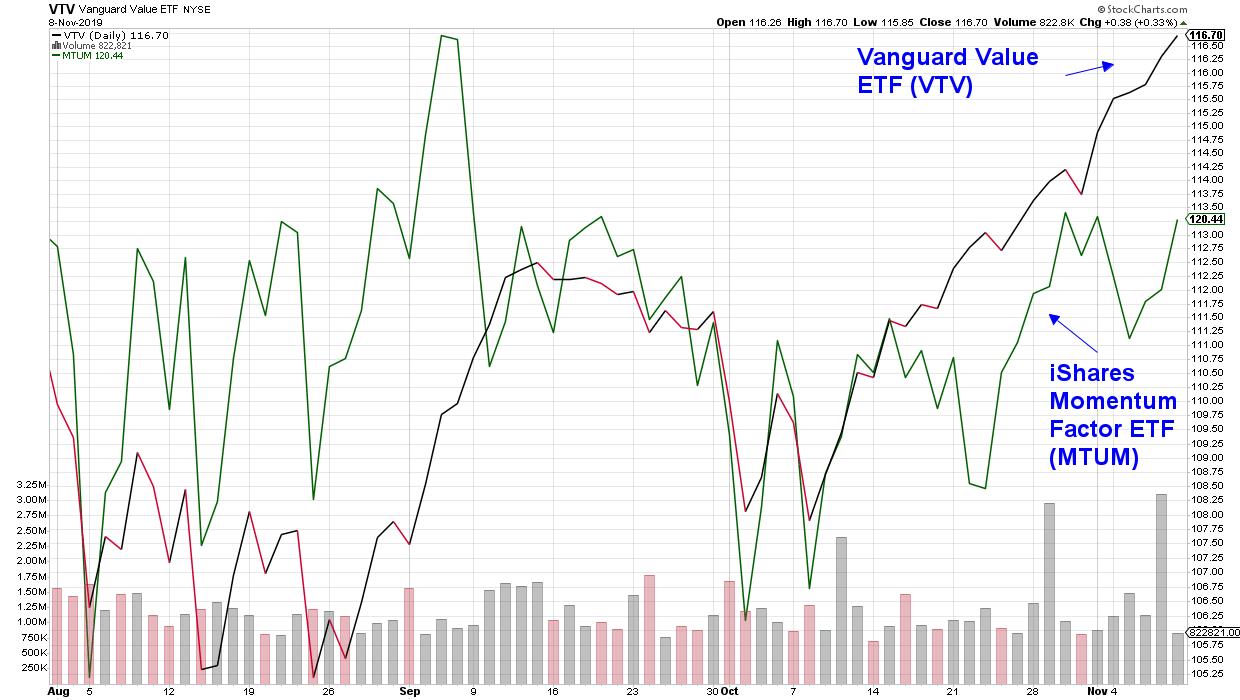
There's been a rotation in the U.S. markets recently as faster moving, high growth stocks have given way to value within the U.S. As you can see in the chart below, the Vanguard Value ETF has been outpacing momentum stocks for about a month now... Read More
ChartWatchers November 08, 2019 at 09:16 PM
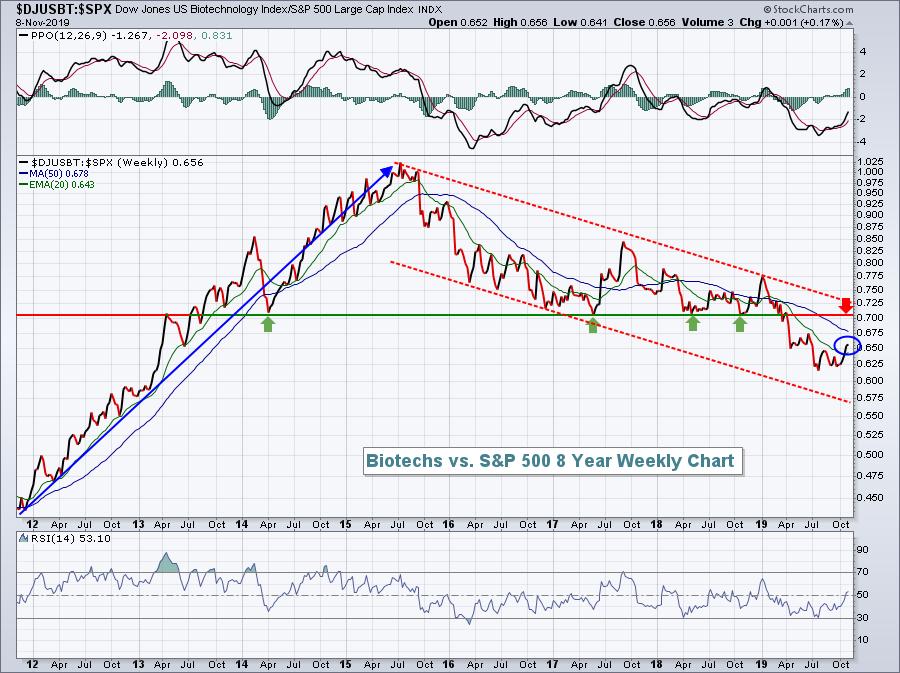
When the biotechs ($DJUSBT) get rolling, make sure to jump on board for the ride! The DJUSBT broke out above 600 at the beginning of 2012; by the time the run was over 3 1/2 years later, it had gained 167%! Since the middle of 2015, this same group of stocks has lost 8%... Read More
ChartWatchers November 08, 2019 at 07:49 PM
As of this article's writing, I have just passed the two-month mark after joining StockCharts.com as Chief Market Strategist... Read More
ChartWatchers November 08, 2019 at 05:52 PM

This week, we rolled out new data coverage for the crypto market, with real-time prices updated 24/7 and full integration into all of the tools and features you know and love on StockCharts... Read More
ChartWatchers November 08, 2019 at 04:34 PM
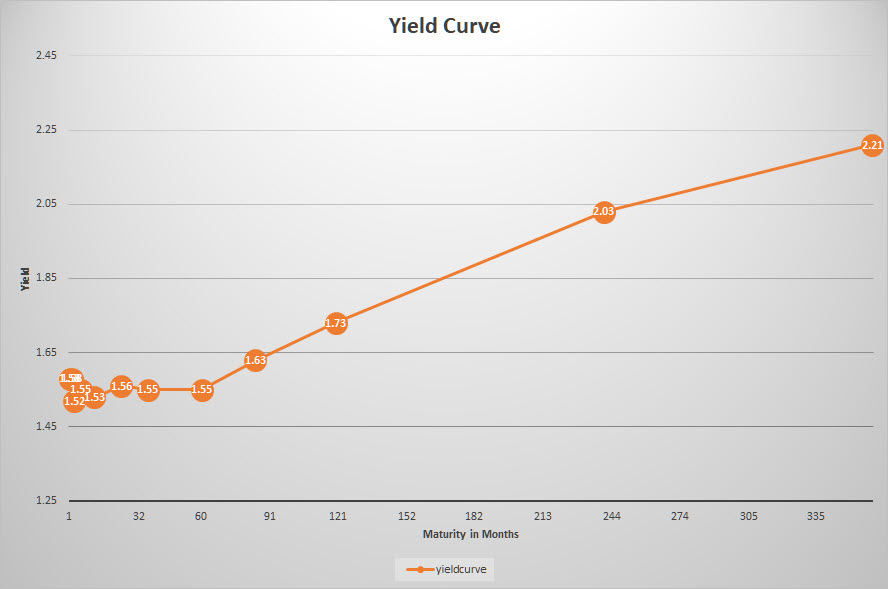
A yield curve is a graphical representation of yields on bonds with different maturities. The most common example is the government bond yield curve, but it is very well possible to render a yield curve for other types of bonds, such as corporate bonds, high yield bonds, etc... Read More
ChartWatchers November 08, 2019 at 02:35 PM
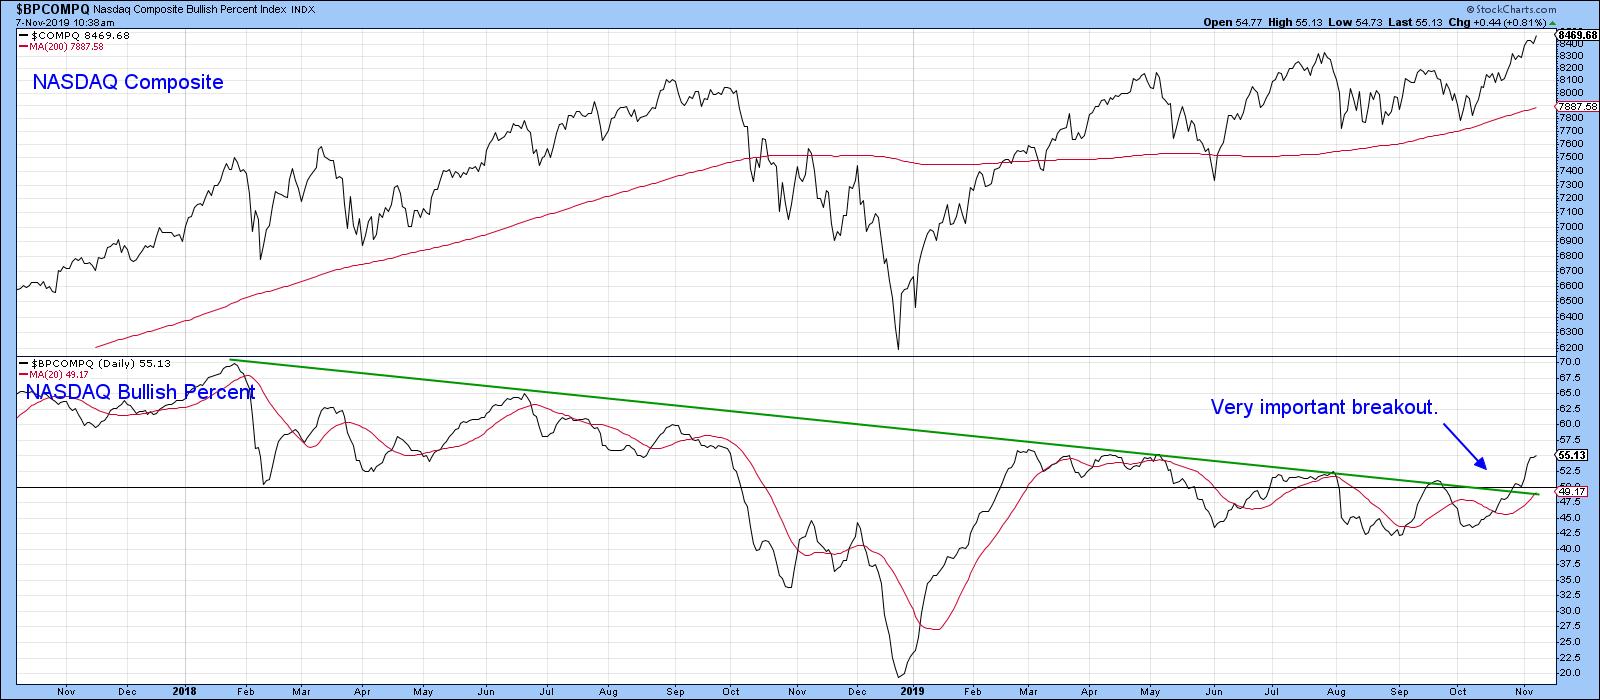
Editor's Note: This article was originally published in Martin Pring's Market Roundup on Thursday, November 7th at 1:28pm ET... Read More
ChartWatchers November 01, 2019 at 06:49 PM
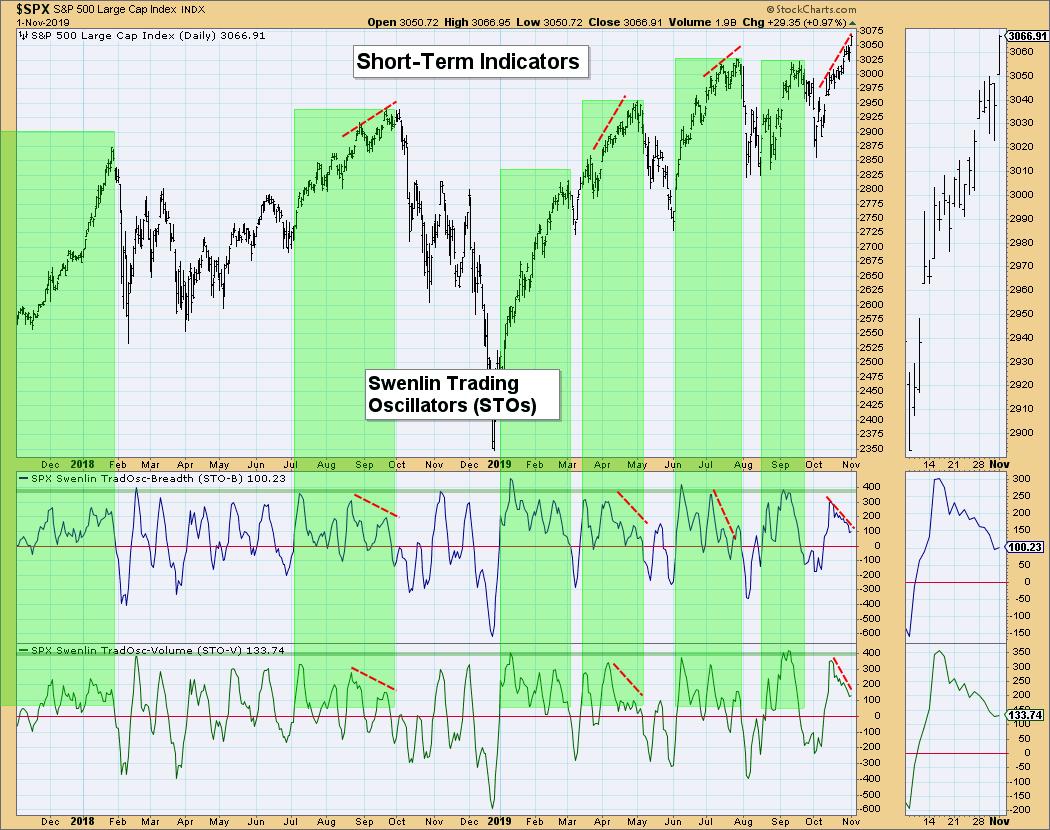
Today saw fresh all-time highs hit on most of the broad market indexes. The weekly Price Momentum Oscillators (PMOs) just generated new Intermediate-Term BUY signals on all four DecisionPoint Scoreboard indexes (SPX, NDX, Dow and OEX)... Read More
ChartWatchers November 01, 2019 at 06:47 PM
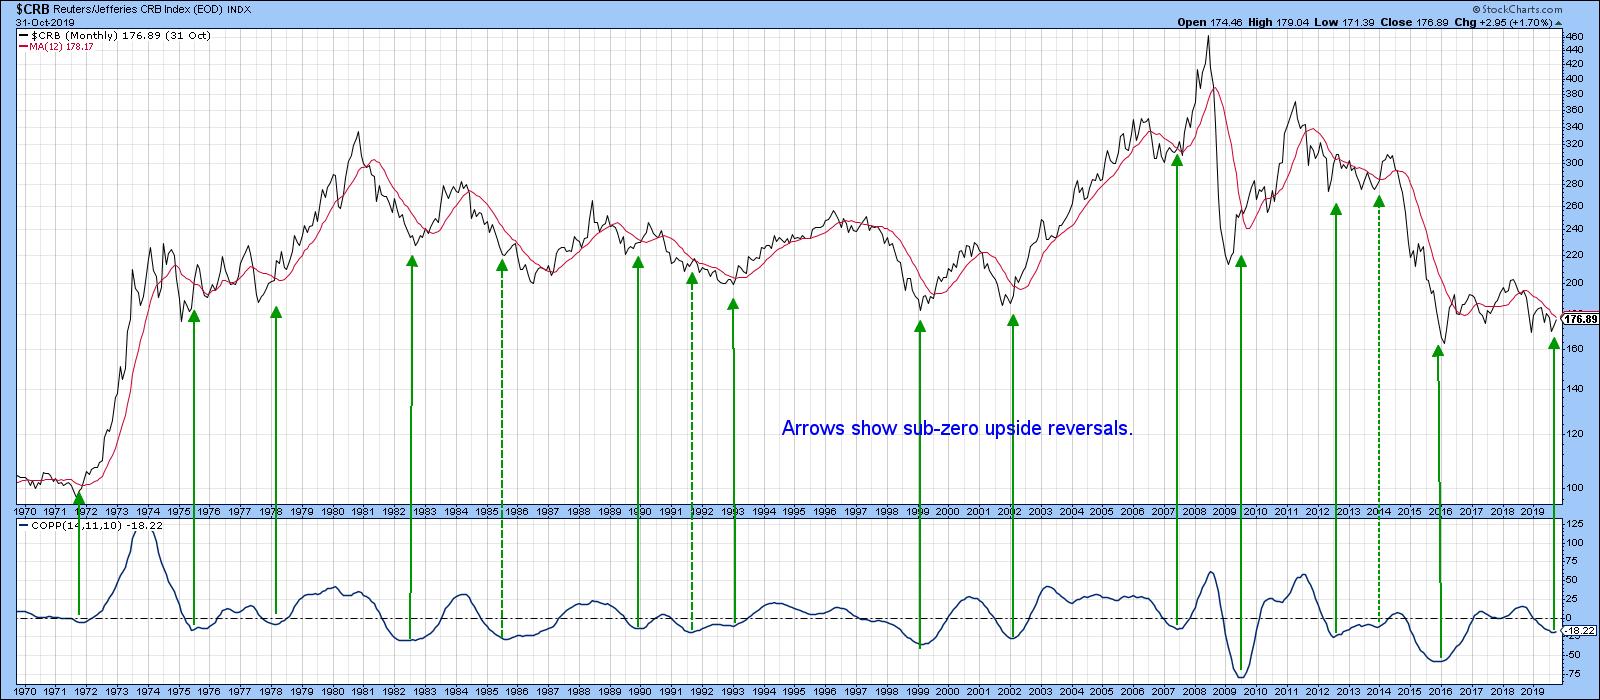
Editor's Note: This article was originally published in Martin Pring's Market Roundup on Friday, November 1st at 1:36pm ET... Read More
ChartWatchers November 01, 2019 at 06:42 PM
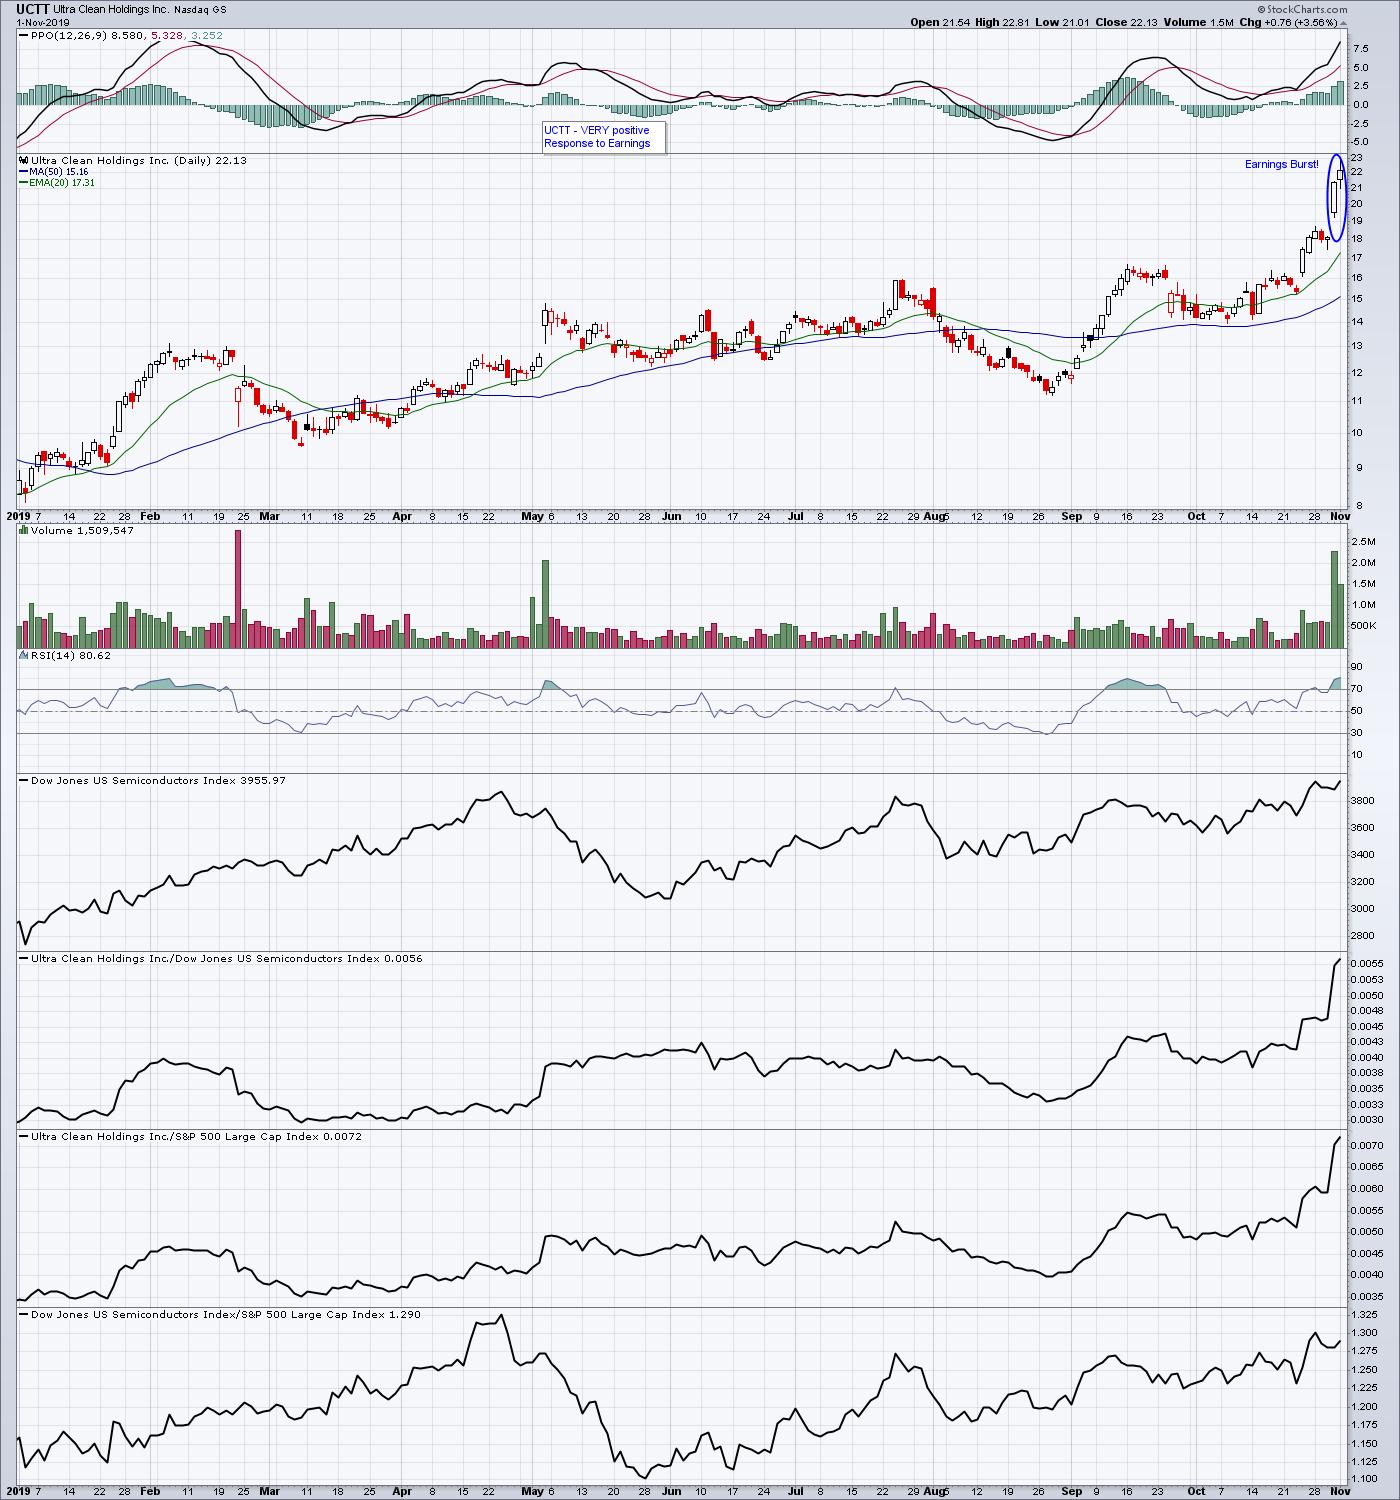
We are now deep into earnings season and, as we can see by the record highs in the NASDAQ and S&P, traders are mostly liking what they are hearing and seeing from companies who are reporting their numbers... Read More
ChartWatchers November 01, 2019 at 06:27 PM
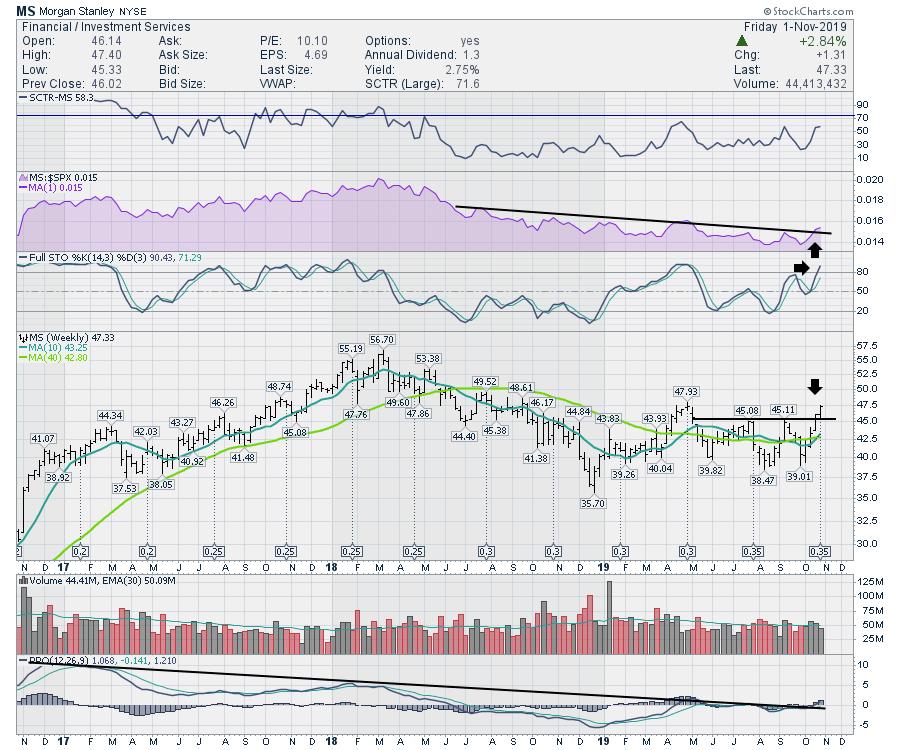
Investment Services are tucked within the Financial Sector and, on Friday, Morgan Stanley (MS) was the first past the post to make higher highs. The chart looks good... Read More
ChartWatchers November 01, 2019 at 03:04 PM

The Nasdaq AD Line is not keeping pace with the Nasdaq Composite, but this is not bearish for the Nasdaq or the market as a whole. Note that the Nasdaq hit a new high in July and again on November 1st, even though the Nasdaq AD Line has been falling since April... Read More