ChartWatchers March 27, 2020 at 11:00 PM
I wrote earlier in the week that, whenever the market rallies by 8-9%, it's obvious that some form of bottom has taken place (however fleeting), so I don't want to state the obvious... Read More
ChartWatchers March 27, 2020 at 10:06 PM
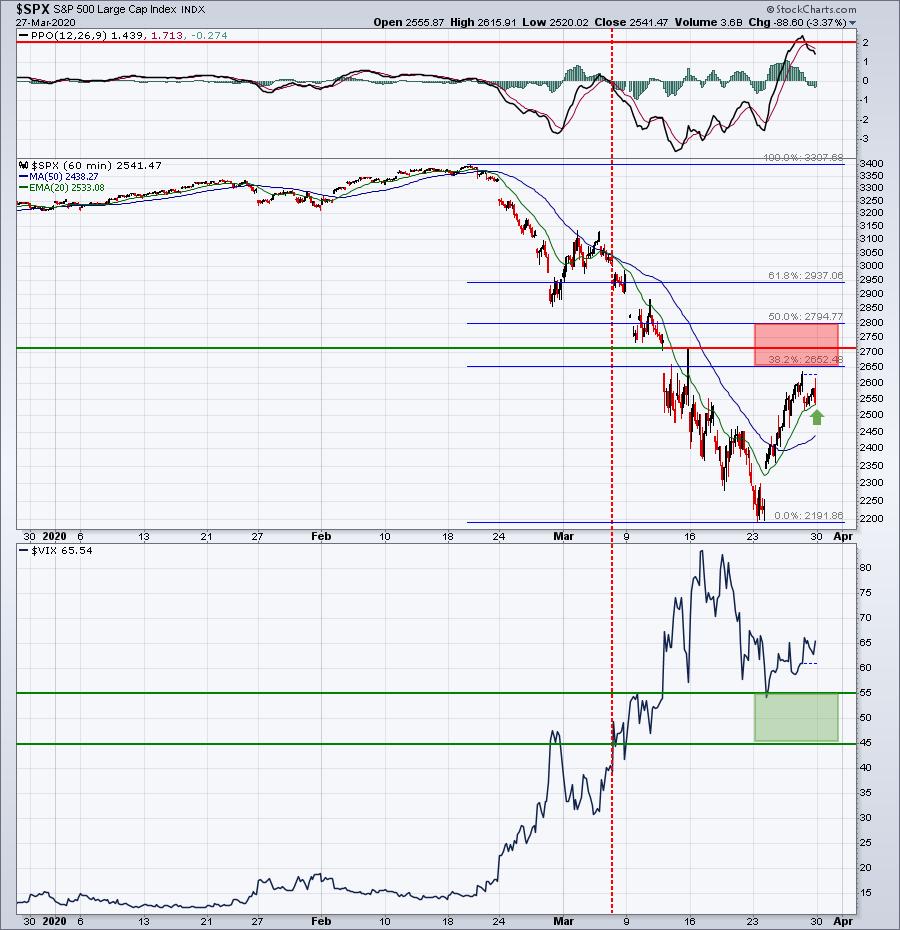
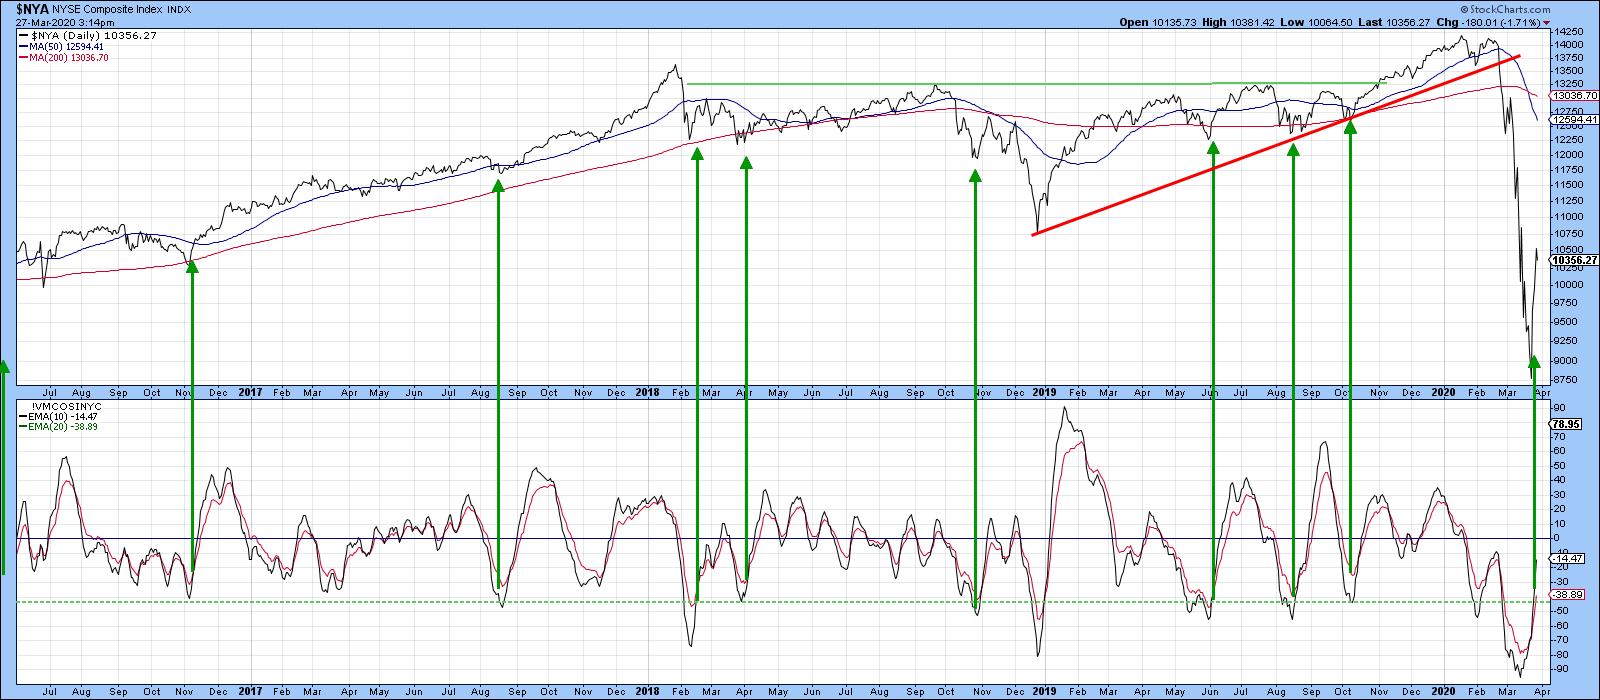
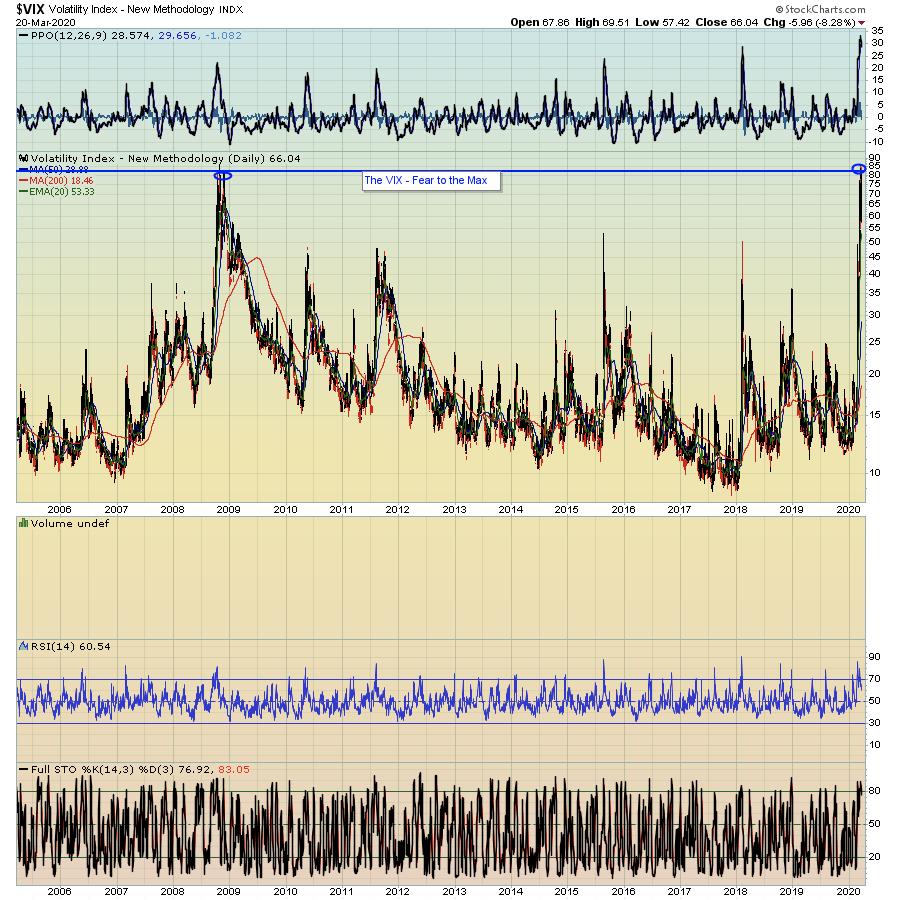
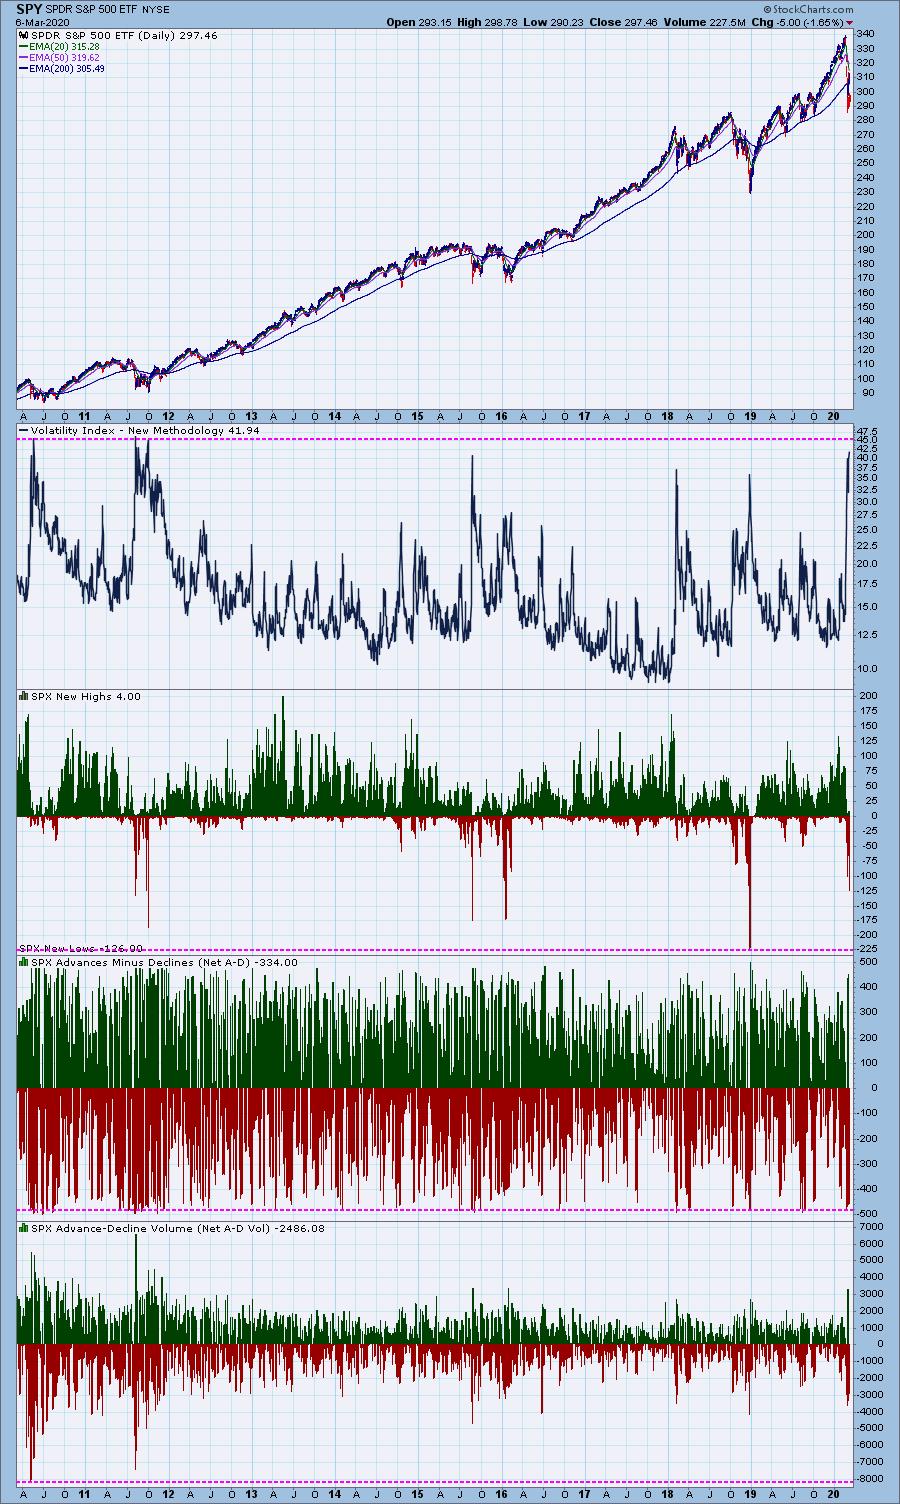
During tumultuous times like these, I pay particular attention to sentiment levels. Extreme fear tends to mark market bottoms, just as the recent Volatility Index ($VIX) reading above 80 coincided with this week's stock market bottom. It's simply the way bottoms form... Read More
ChartWatchers March 27, 2020 at 08:52 PM
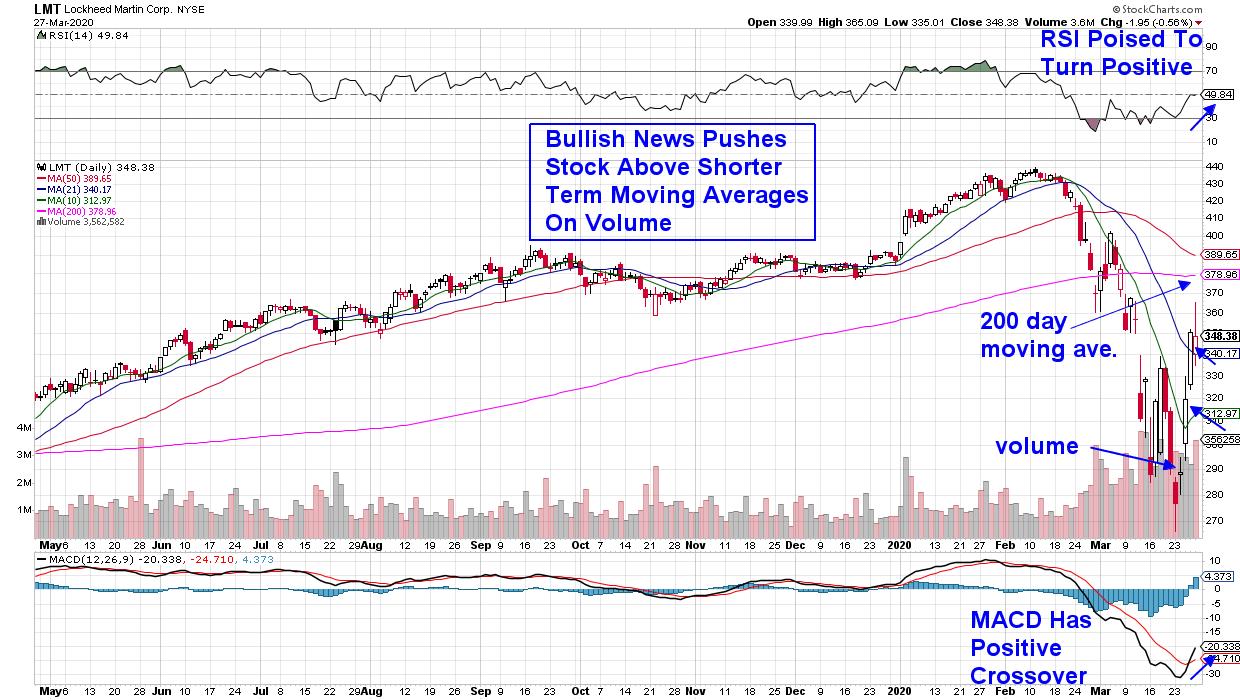
The U.S. government passed a coronavirus relief bill today that's thought to be the largest of its kind in history as Washington tries to dampen the sharp economic decline that's expected from the spreading pandemic... Read More
ChartWatchers March 27, 2020 at 07:48 PM

I very much enjoyed participating in our StockCharts TV special event "Navigating a Bear Market" along with many of my fellow StockCharts contributors... Read More
ChartWatchers March 27, 2020 at 12:24 PM
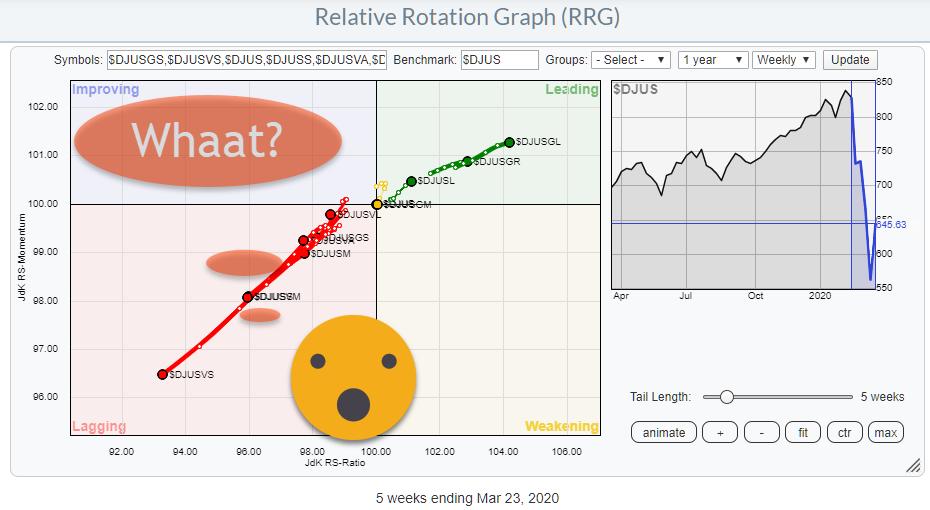
Instead of simply looking at sectors, it also makes sense to keep an eye on segments of the stock market based on different criteria. The Size Factor One example is to group stocks based on Market Capitalization, i.e. Large-, Mid- and Small-Cap stocks... Read More
ChartWatchers March 20, 2020 at 10:36 PM
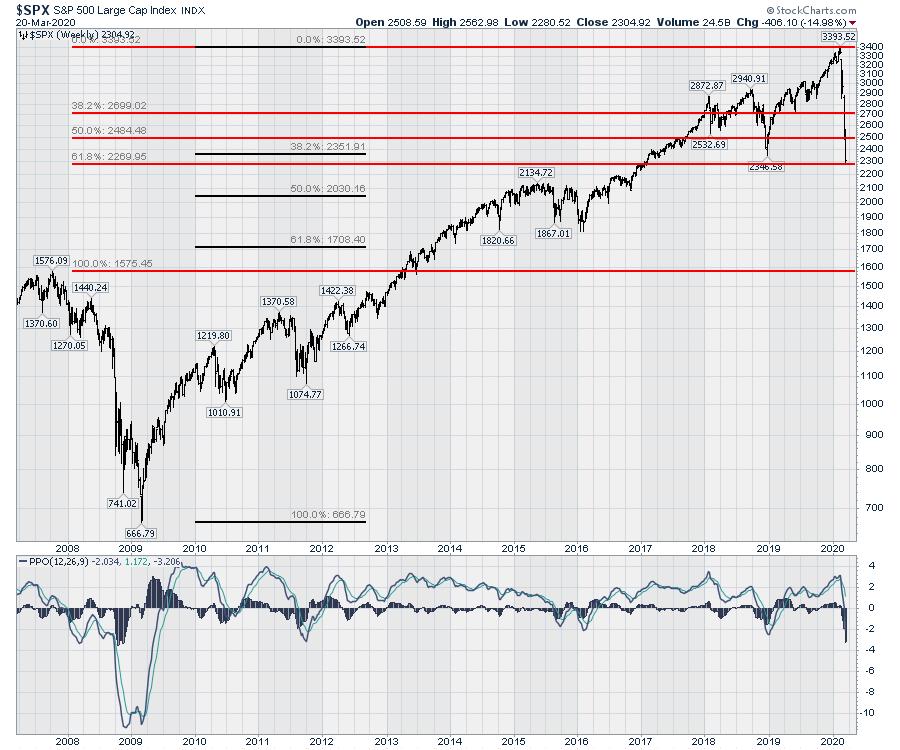
We have now been in the downtrend for one month. The January 19th intraday high (3393) on the SPX is in the books for a little bit as the high, much like 1576 was from 2009. With this week's low, we have moved down to a 50% retracement from the gains after breaking above 2007... Read More
ChartWatchers March 20, 2020 at 07:13 PM
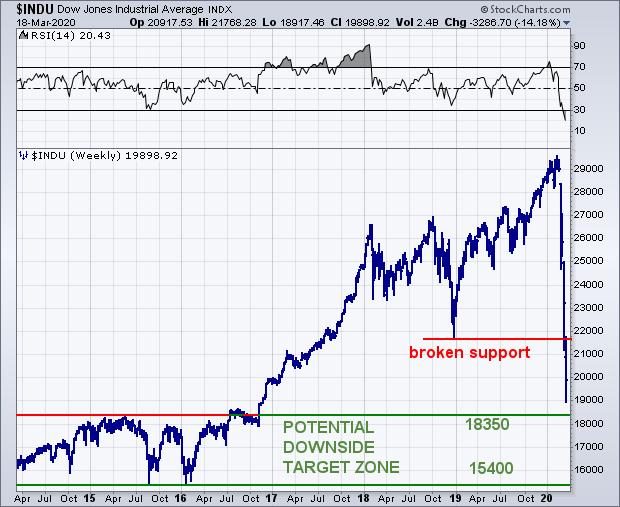
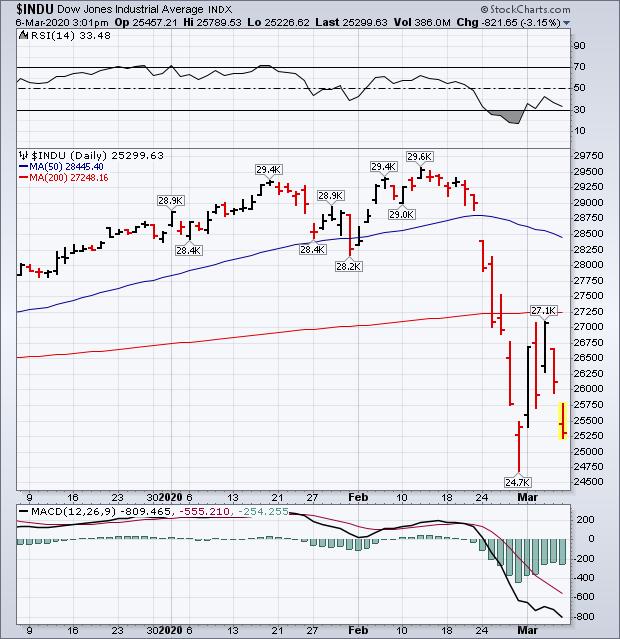
My weekend message showed the Dow Industrials testing important chart support along its late 2018 low. The weekly bars in Chart 1 show the Dow falling below that important support line this week. That raises the likelihood of even lower prices. The question is how low... Read More
ChartWatchers March 20, 2020 at 06:59 PM
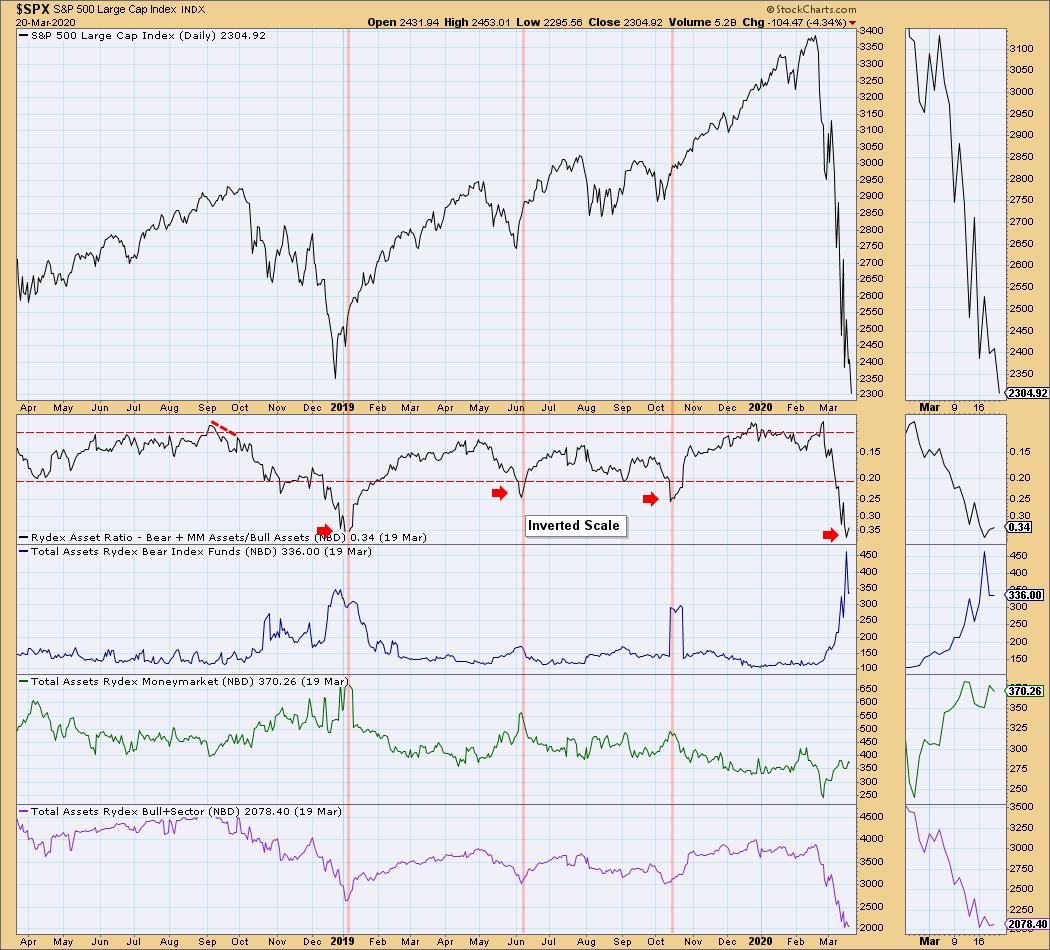
I'm so excited to report sentiment to you this weekend with commentary added from Mark Young of WallStreetSentiment.com... Read More
ChartWatchers March 20, 2020 at 06:58 PM
Generally, my articles focus on corporate earnings. But let's face it - earnings have taken a back seat these days, with traders more in survival mode... Read More
ChartWatchers March 20, 2020 at 03:43 PM
The broad market environment is bearish and volatility remains high, even with stock alternatives, such as gold and bonds. This is hardly a conducive environment for trading or investing, but there are alternatives, such as a bear market project... Read More
ChartWatchers March 13, 2020 at 11:00 PM
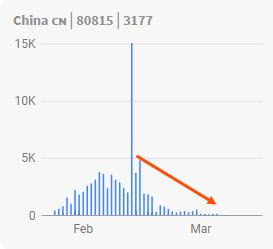
This week has seen U.S. administration fiscal proposals, as well as 1.5 trillion dollars in Fed support, aimed at limiting the economic damage from COVID-19. Friday saw a travel ban put into effect, along with a state of emergency... Read More
ChartWatchers March 13, 2020 at 10:24 PM
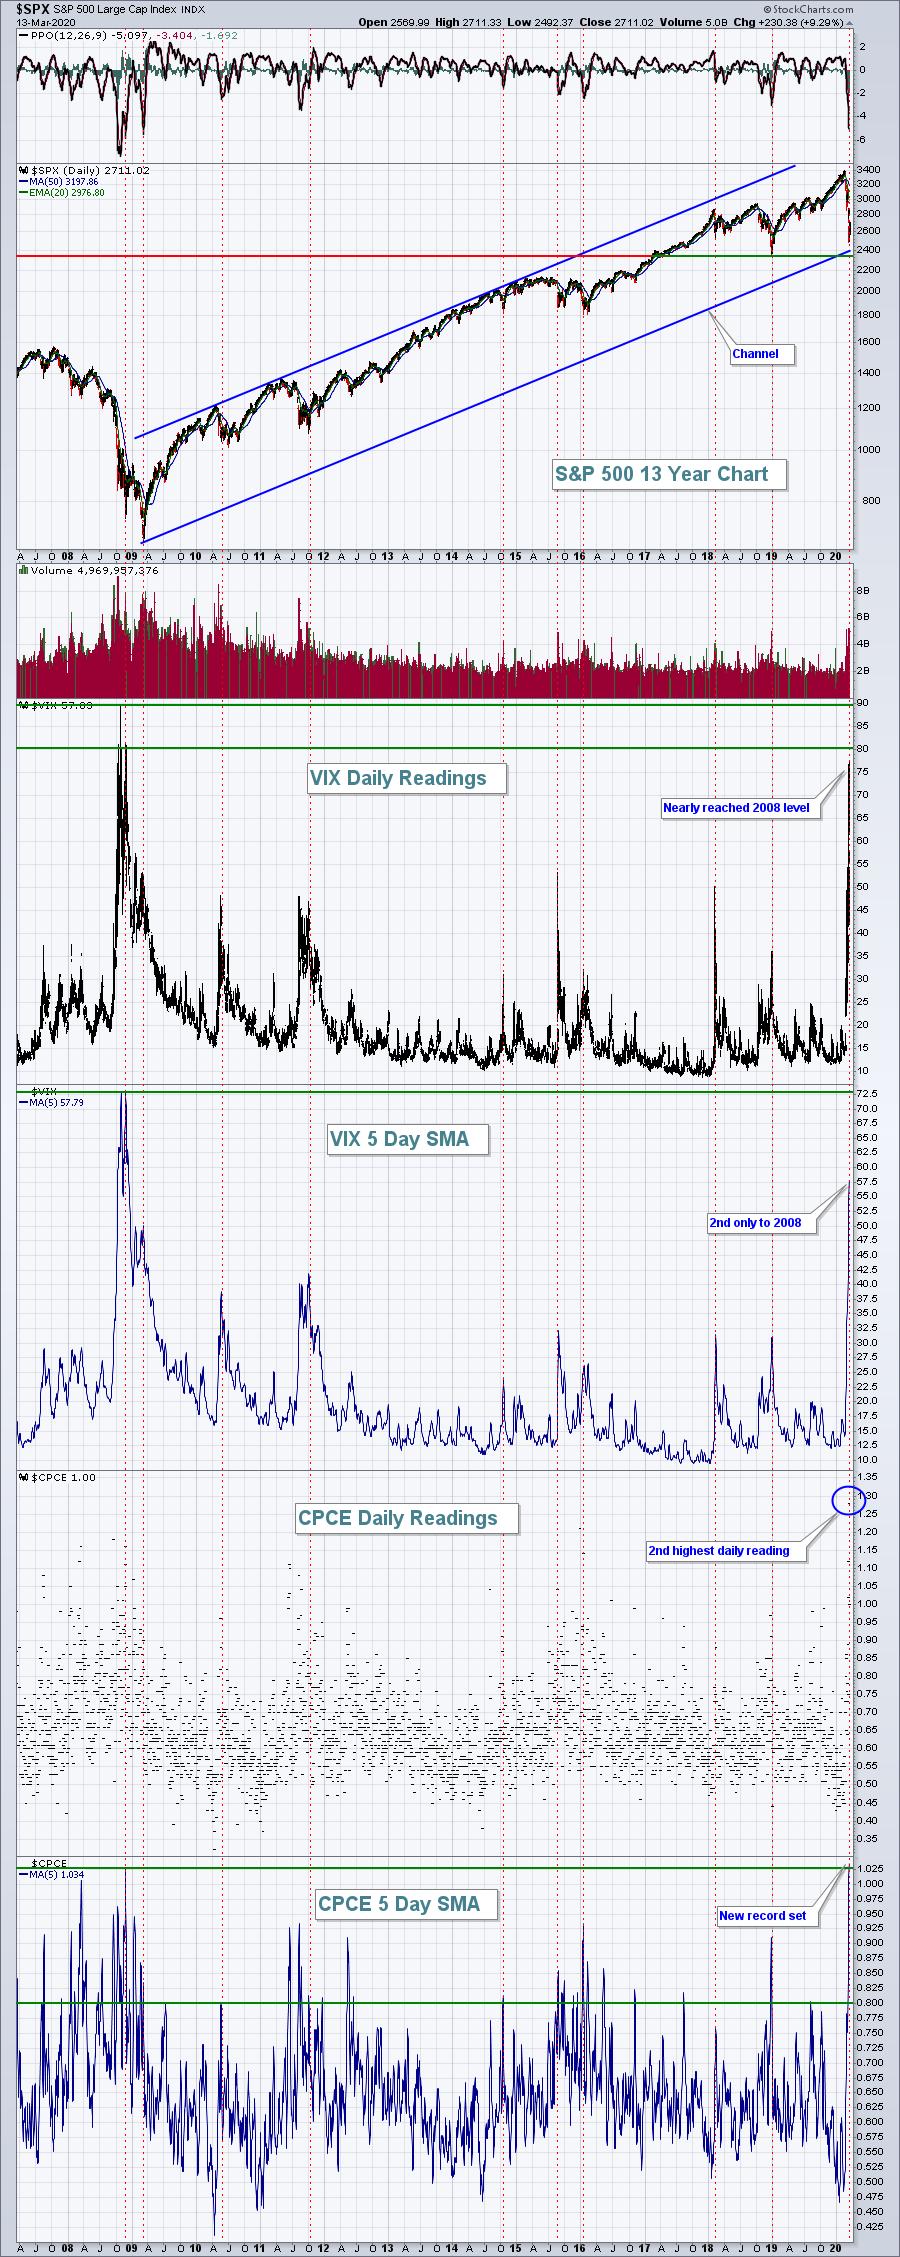
The stock market has a mind of its own, so I never like to say that it MUST do one thing or another. But I'm firmly in the camp of this being a cyclical bear market, rather than a secular bear market... Read More
ChartWatchers March 13, 2020 at 09:45 PM
It was not a week for the faint of heart as the markets posted daily roller coaster type swings that had one day's action wiping out the prior day. The S&P 500 was down as much as 17% at one point before Friday's relief rally helped stem losses... Read More
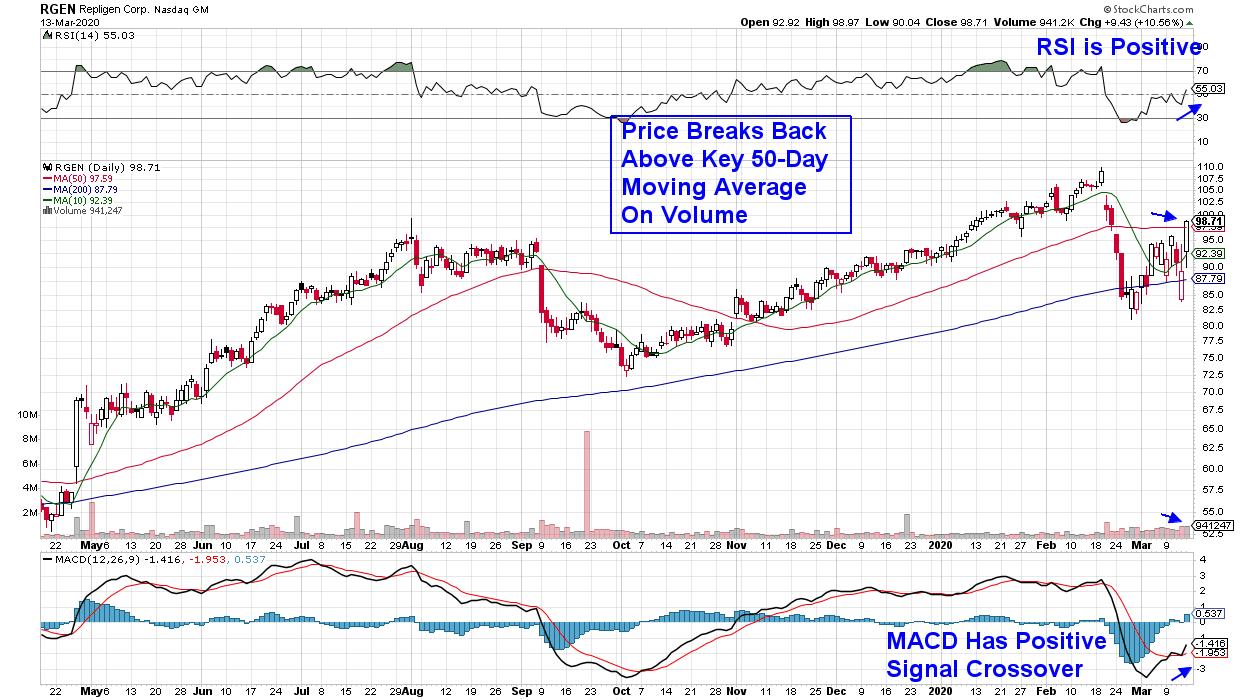
ChartWatchers March 13, 2020 at 08:08 PM
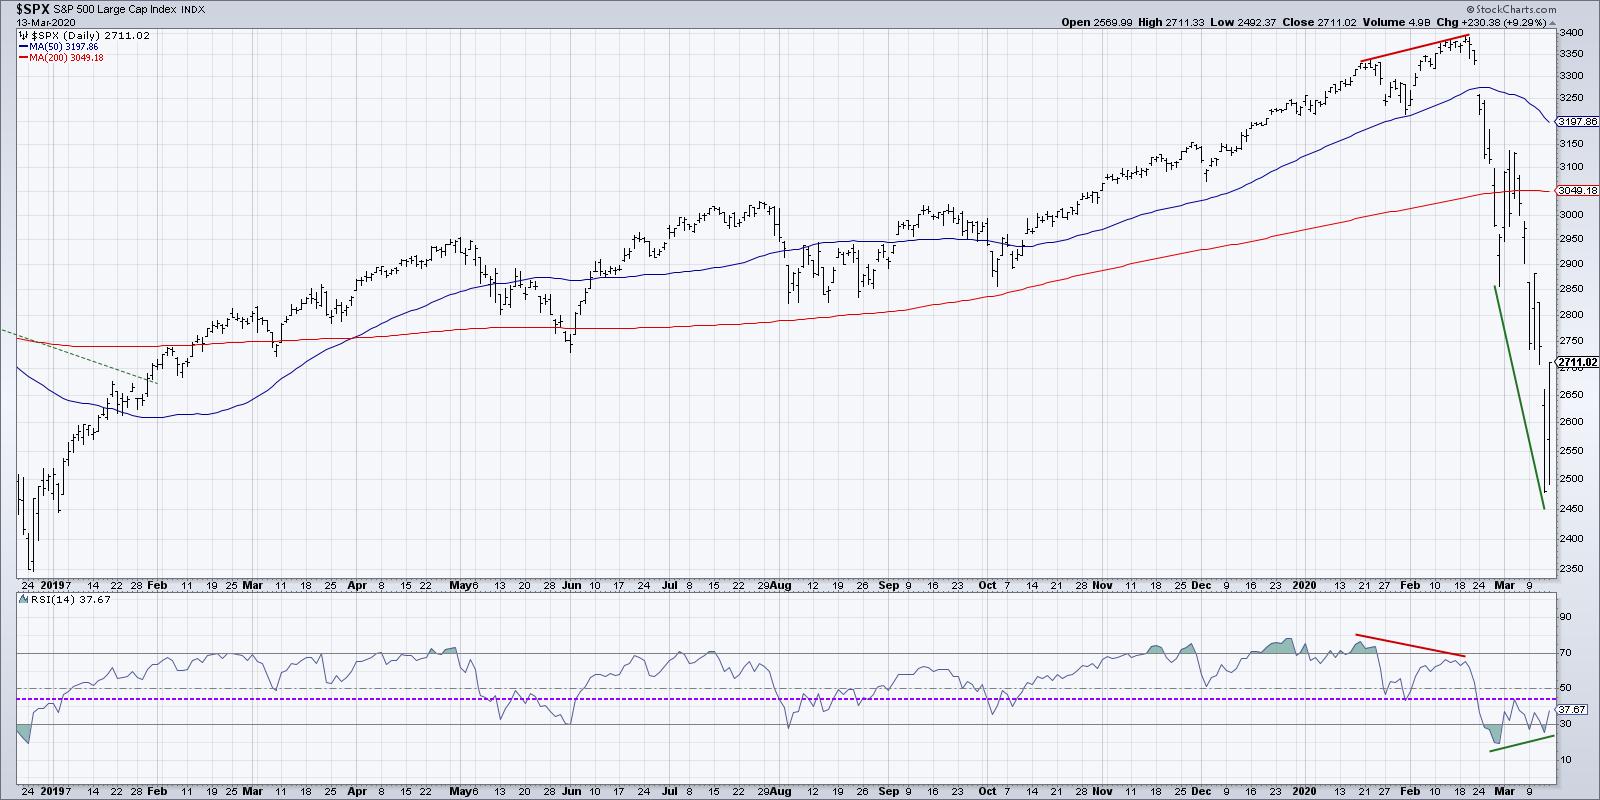
Every Friday on my show The Final Bar, we answer viewer questions from throughout the past week. One of today's questions related to the potential bullish divergence on the S&P 500 using price and RSI... Read More
ChartWatchers March 13, 2020 at 03:21 PM

The mayhem in the markets over the past three weeks has clearly caused a rotation out of the more offensive sectors towards defensive ones. The sectors with the clearest rotations are mentioned on the chart above... Read More
ChartWatchers March 06, 2020 at 08:30 PM
Another day of heavy selling has marked the end of this week's rebound, and a likely retest of last week's lows. Another plunge in bond yields to record lows and a 10% plunge in the price of oil are just two factors contributing to the stock selling... Read More
ChartWatchers March 06, 2020 at 06:23 PM
Before I get started, I wanted to let everyone know that DecisionPoint... Read More
ChartWatchers March 06, 2020 at 05:05 PM
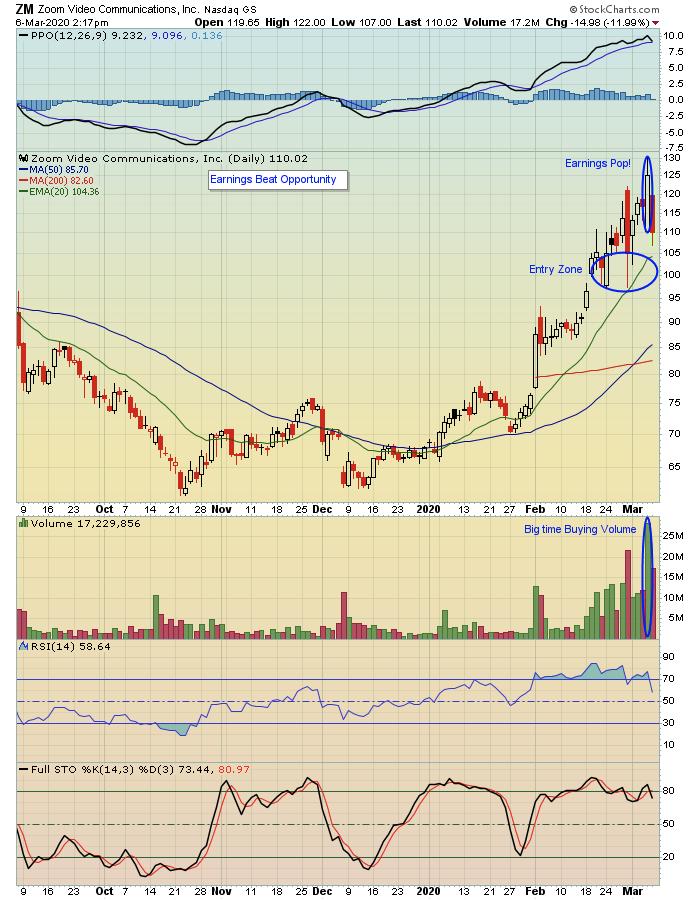
With the market in turmoil, many traders are in survival mode, never mind looking for new opportunities. Yet there are still companies reporting earnings that show the bottom line is still king... Read More
ChartWatchers March 06, 2020 at 04:51 PM
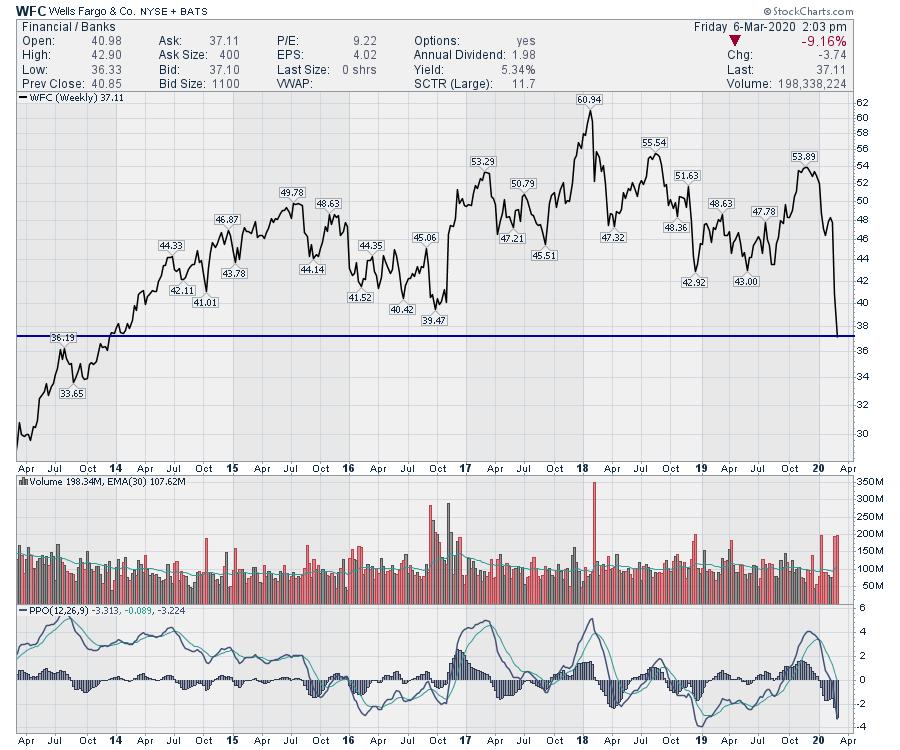
Banks in the USA have been hit, but nearly as hard as the rest of the world. While JPM broke a four-year trend line this week, WFC bounced down to six-year lows. Europe looks dismal. Let's look at HSBC... Read More
ChartWatchers March 06, 2020 at 04:45 PM

Support levels and bullish retracement zones are questionable, at best, in bear market environments. Why? Because the path of least resistance is down in a bear market... Read More