ChartWatchers May 29, 2020 at 07:57 PM
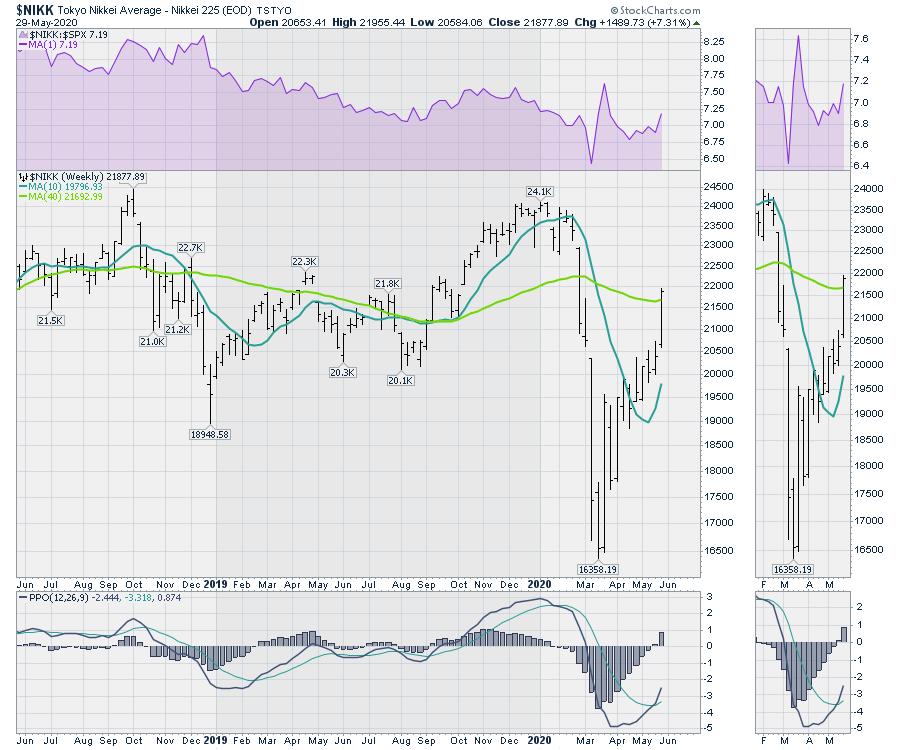
One of the major risks of the global slowdown is the number of companies that are forced to close due to lack of cash flow or credit risk. Jerome Powell jumped on the credit risk issue early on to avoid contagion in the USA... Read More
ChartWatchers May 29, 2020 at 07:11 PM
I love getting email from my readers and this particular email was great. He felt like he was asking a ridiculous question, but it is a common one that I don't think is asked out loud... Read More
ChartWatchers May 29, 2020 at 07:04 PM
March Was a Really Strong Bottom Tuesday's action looks bullish on the surface, but may signal the end of the rally... Read More
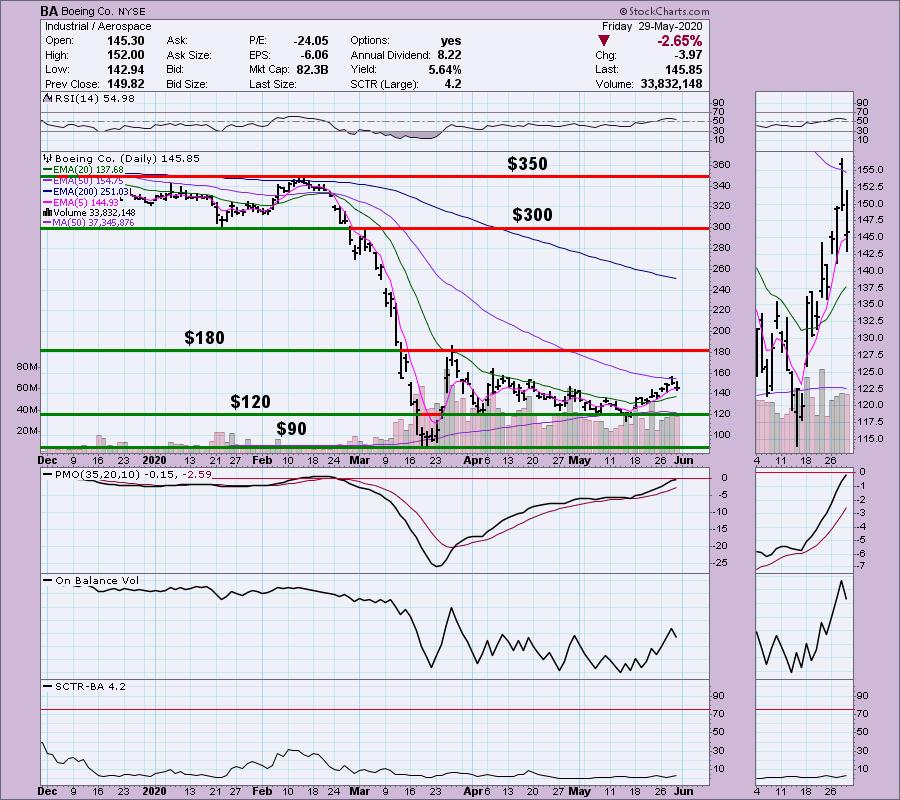
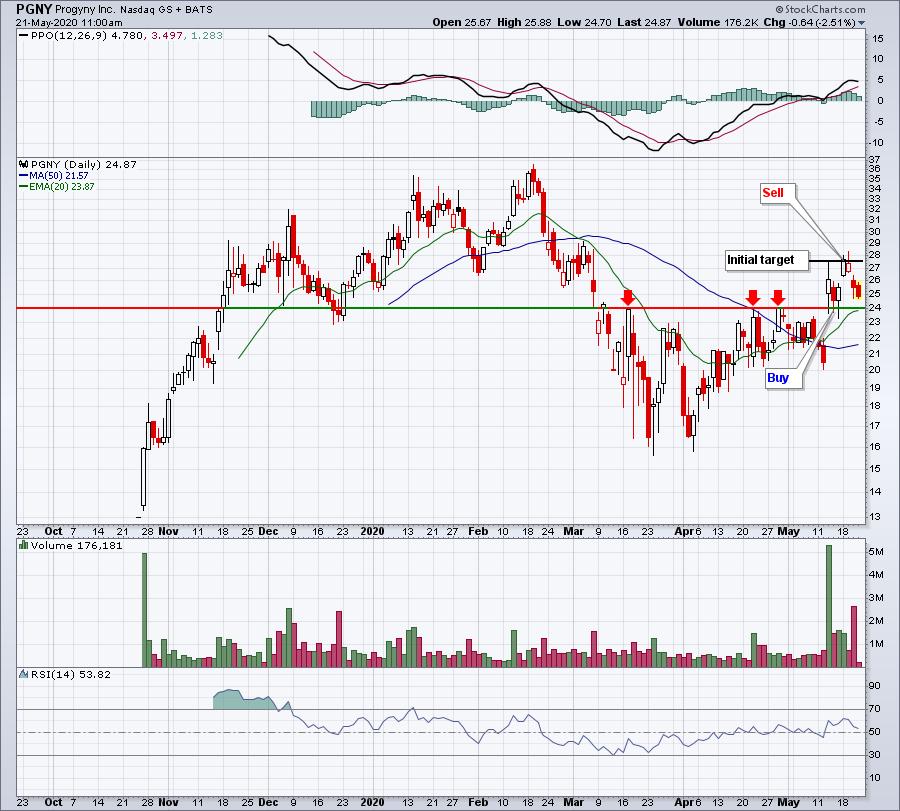
ChartWatchers May 29, 2020 at 06:37 PM
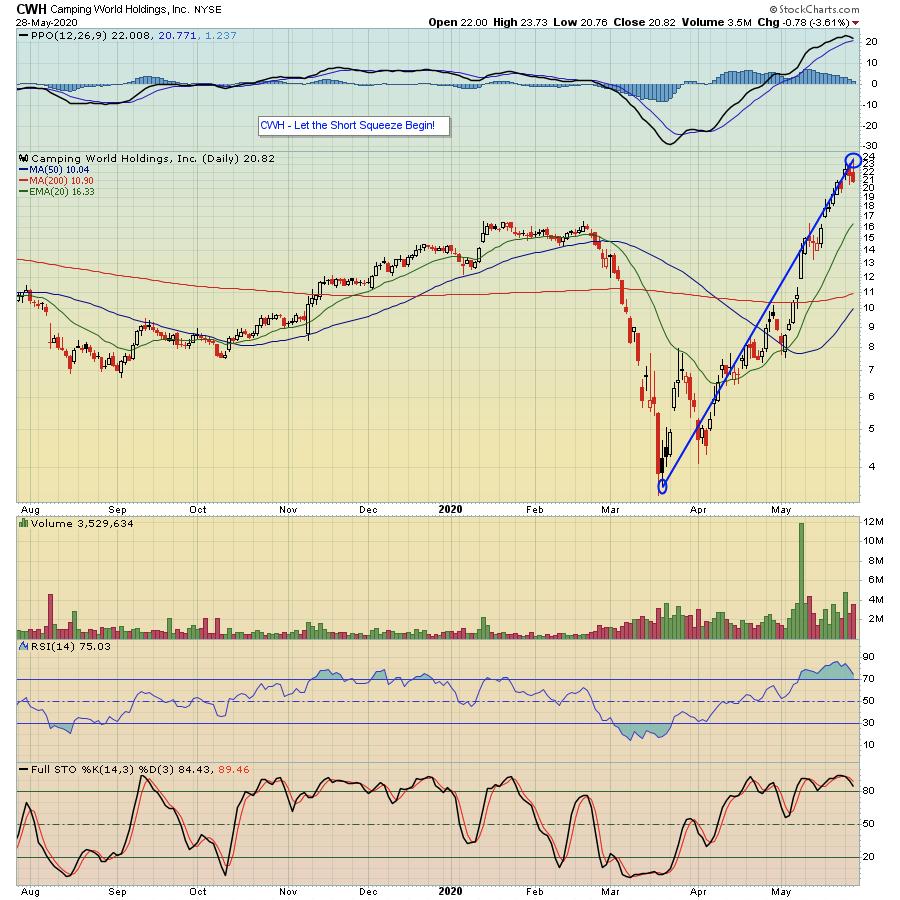
When looking for solid long trading candidates, one of the things astute traders look for are those stocks with high short interest. In other words, those stocks that traders are heavily betting against... Read More
ChartWatchers May 29, 2020 at 04:44 PM
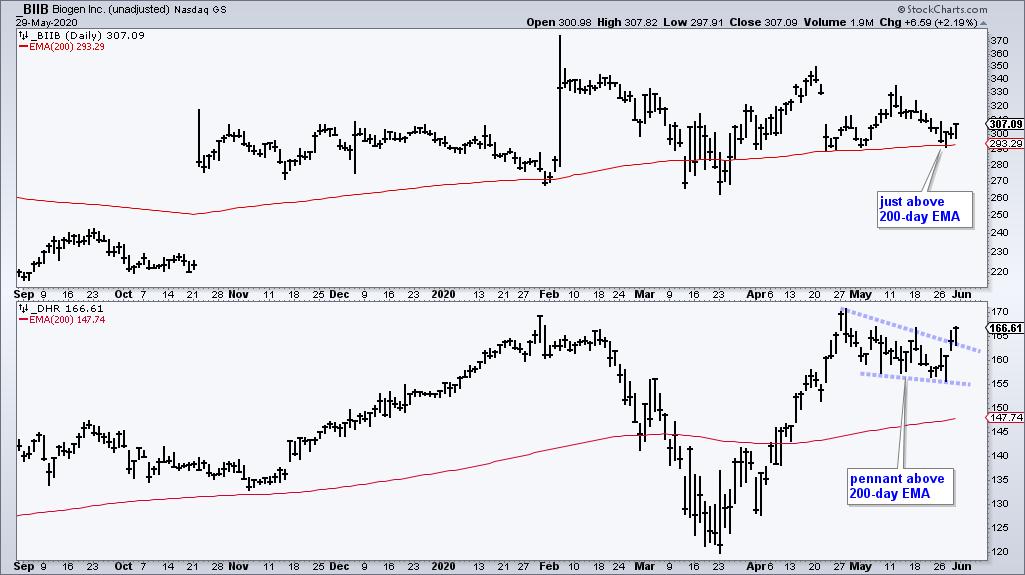
Chartists can separate the leading sectors from the lagging sectors by sorting with various breadth indicators. The 200-day EMA is a long-term trend indicator that can also be used as a breadth indicator... Read More
ChartWatchers May 22, 2020 at 10:54 PM
The unforeseen usefulness of robots during the current global lockdown has kicked up interest in an already-growing area of the markets... Read More
ChartWatchers May 22, 2020 at 09:08 PM
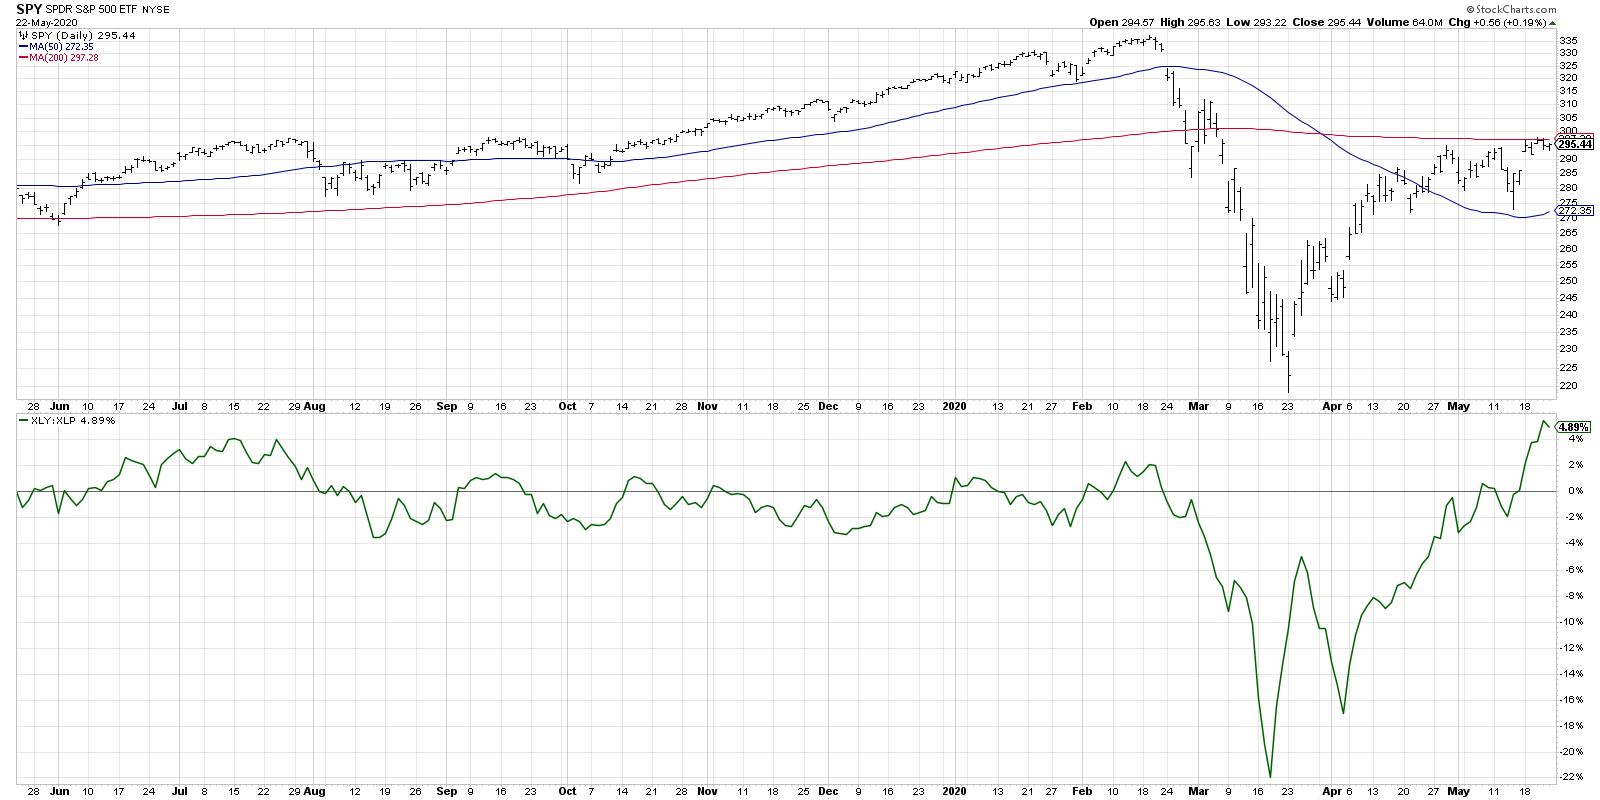
One of my favorite ratios to track offense vs. defense within the equity markets is the Consumer Discretionary sector (XLY) divided by the Consumer Staples sector (XLP). But a look under the hood shares narrow leadership and questionable upside... Read More
ChartWatchers May 22, 2020 at 09:00 PM
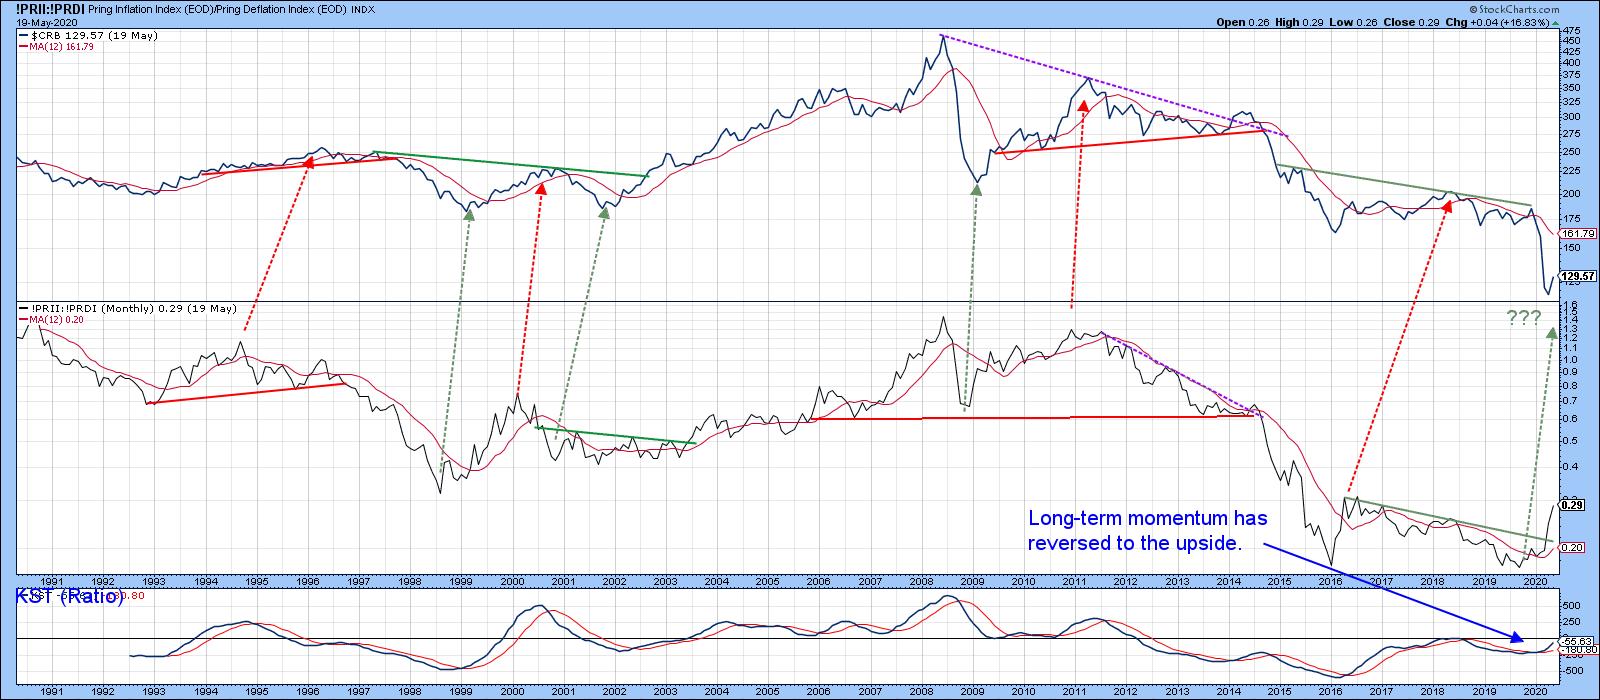
The Stock Market is Forecasting Higher Commodity Prices [One big] thing going positive for commodities is my Inflation/Deflation ratio... Read More
ChartWatchers May 22, 2020 at 03:25 PM
I have a routine that I've implemented where I typically review market action around 10:00am ET, 30 minutes after the market has opened... Read More
ChartWatchers May 22, 2020 at 02:26 PM
Some time ago, I started to play around with BETA as a metric to gauge risk appetite for sectors, then went from there to the general market. If you search for BETA in ChartSchool you will find this entry: Beta: A measure of a security's systematic or market risk... Read More
ChartWatchers May 15, 2020 at 08:40 PM
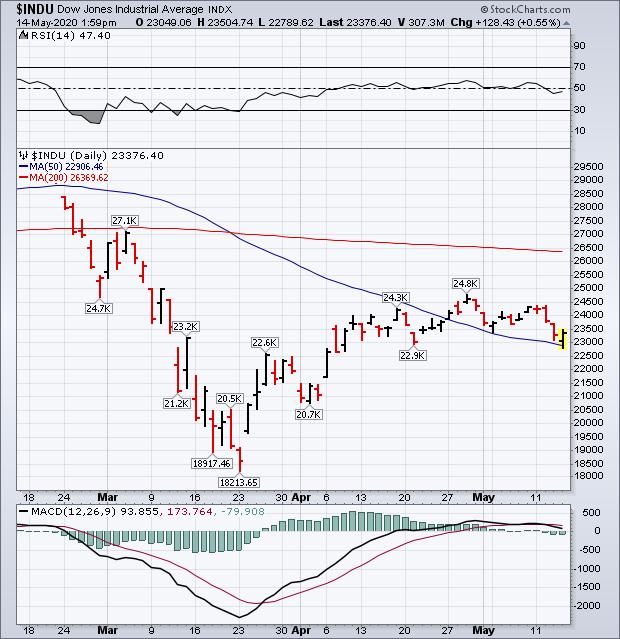
After a weak start this morning, major stock indexes are stabilizing near some short-term support levels. Chart 1 shows the Dow Industrials finding support at its 50-day moving average and its mid-April intraday low at 22900. Chart 2 shows the S&P 500 holding support at 2797... Read More
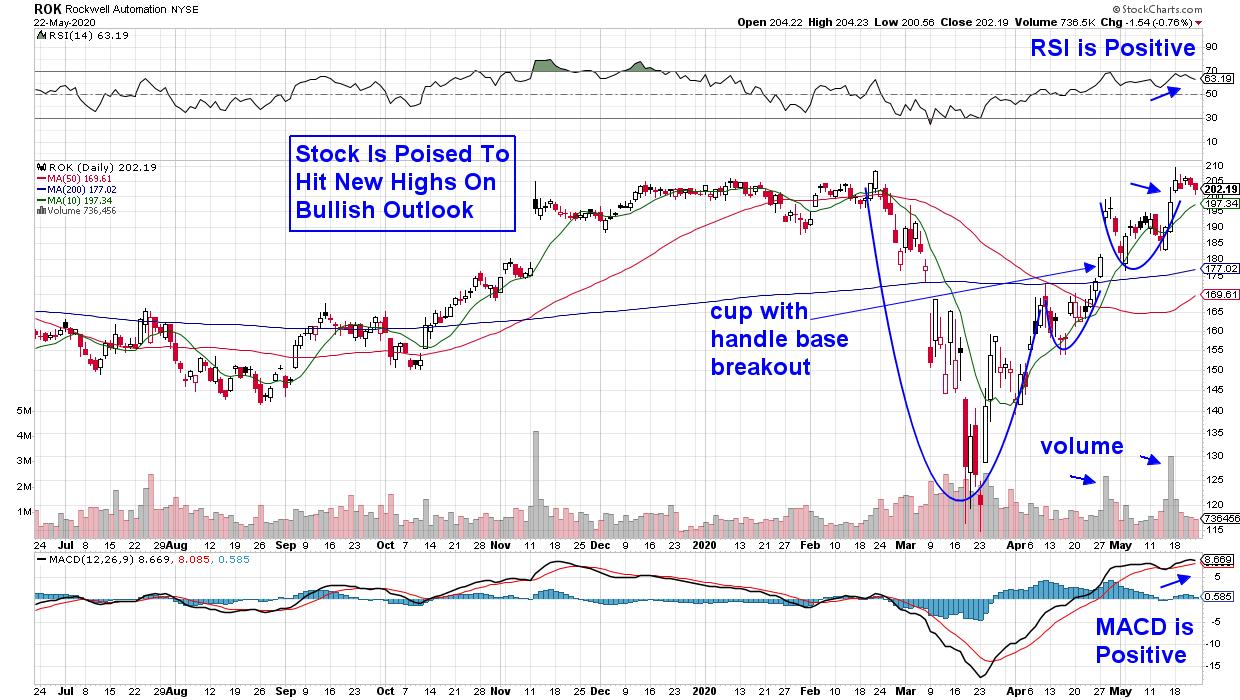
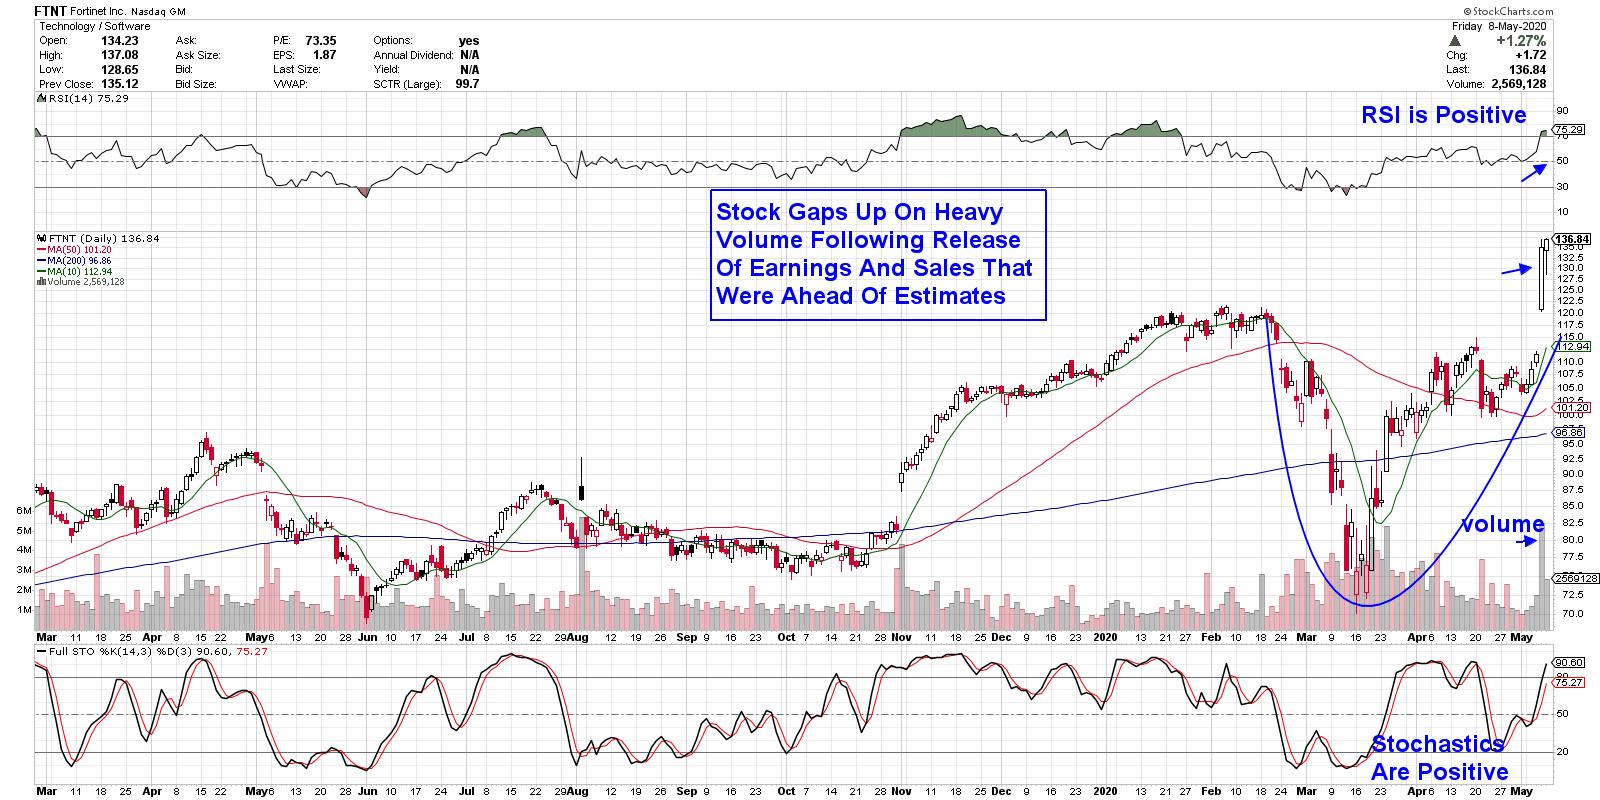
ChartWatchers May 15, 2020 at 08:32 PM
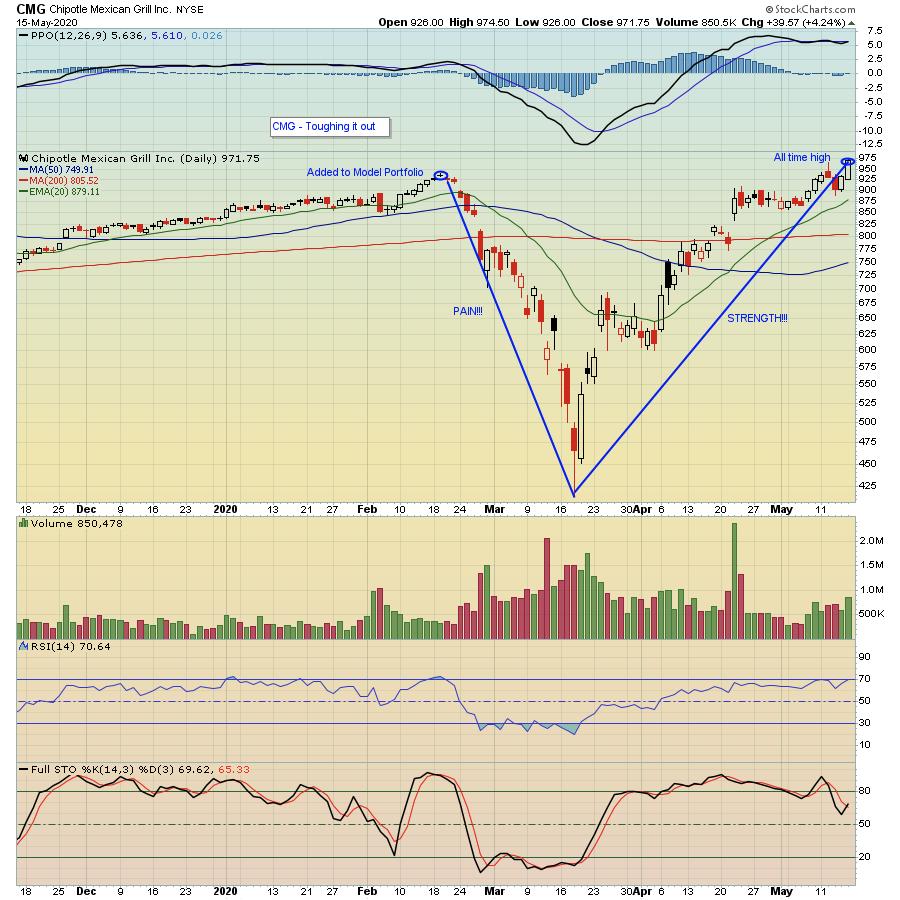
When you stop to think about the overall environment we've all been working in these past few months, it's amazing to think there are some stocks that are at their all-time highs. Of course, whenever there is a crisis, there are stocks that benefit... Read More
ChartWatchers May 15, 2020 at 05:50 PM
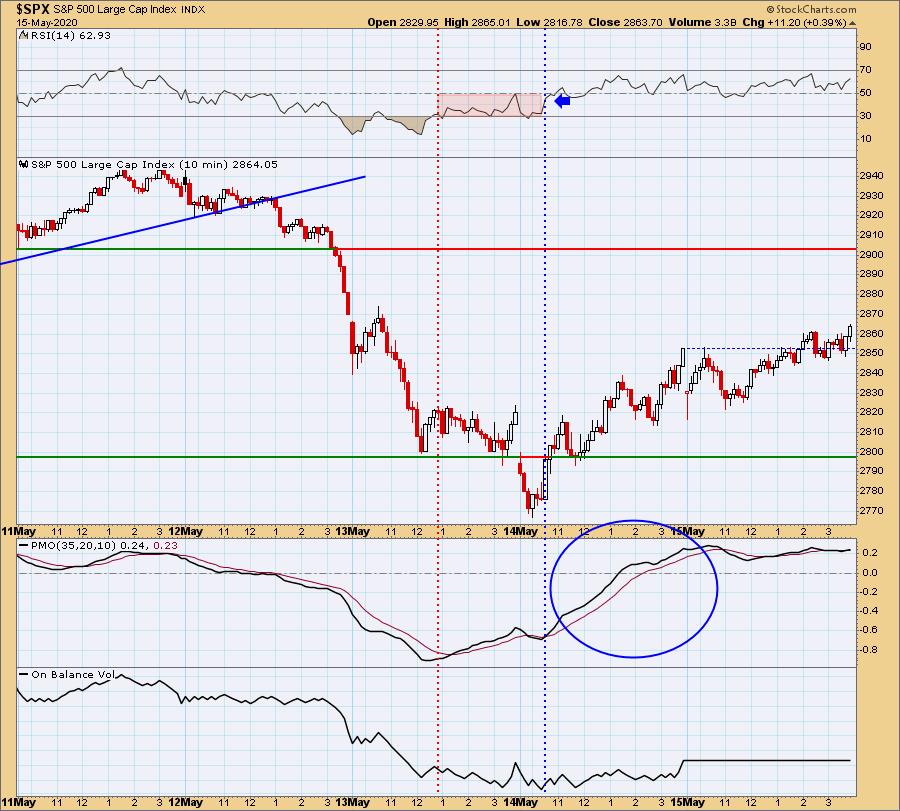
I received an email after trading on Wednesday 5/14 that included a great question about catching mid-day reversals: "I struggle the most in days like today (5/14) where the market goes one way and then it changes direction... Read More
ChartWatchers May 15, 2020 at 04:55 PM
StockCharts calculates and publishes the Bullish Percent Indexes for several major indexes and sectors. Just search for the term $BP to find them because all the symbols begin with these three characters... Read More
ChartWatchers May 15, 2020 at 02:01 PM
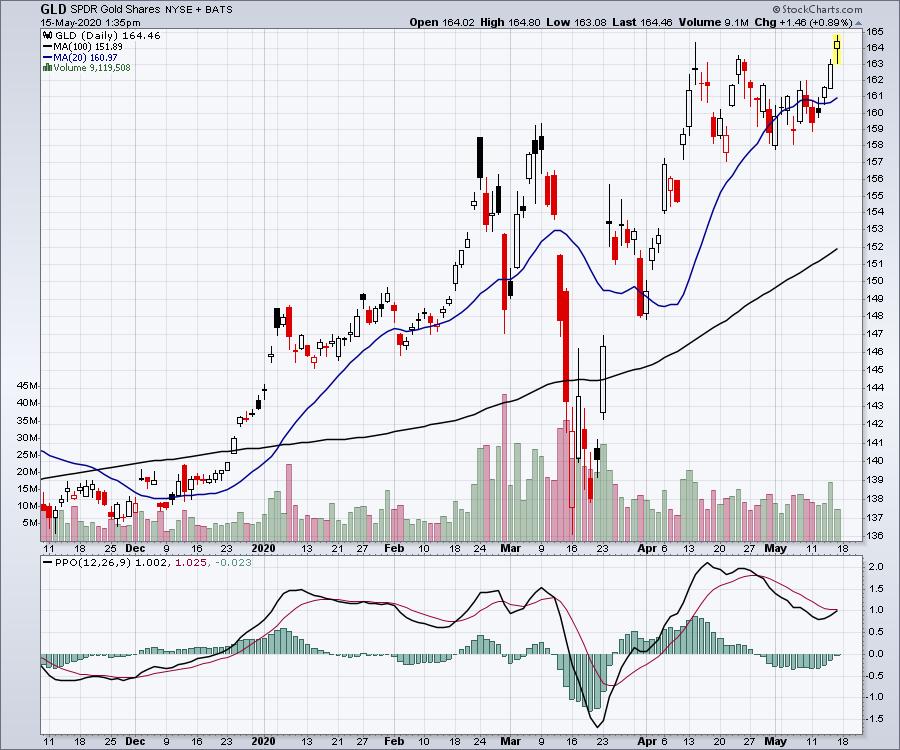
After jogging sideways for weeks, Gold (GLD) finally appears ready to start running. With the Thursday and Friday candles, it is pushing to higher highs again! One of the things we like to see is when the gold miners (GDX) outperform the gold stocks... Read More
ChartWatchers May 08, 2020 at 10:36 PM
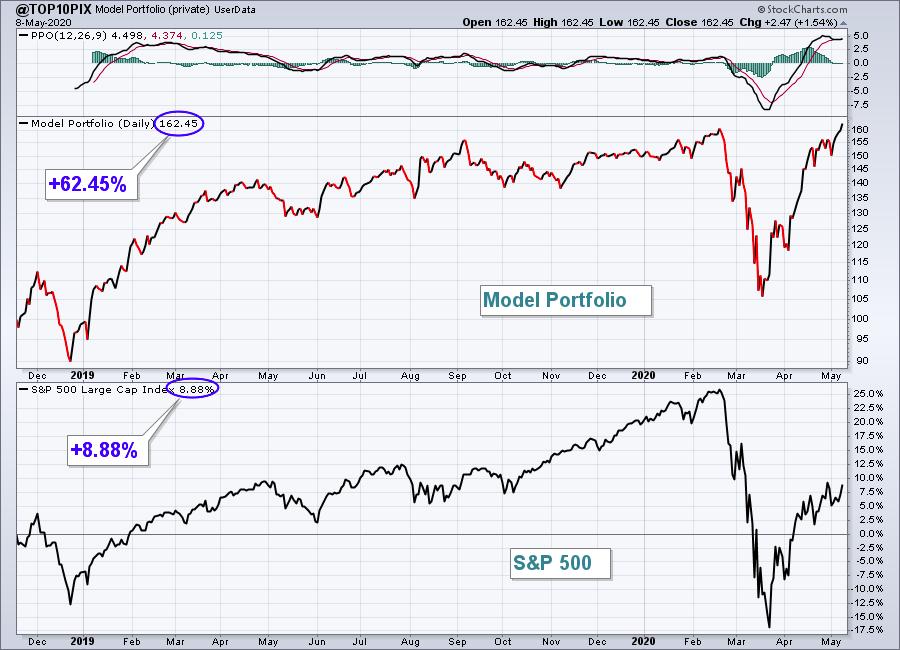
The S&P 500 closed at an all-time high on February 19, 2020 when it reached 3386.15. At its Friday close of 2929.80, the benchmark index remained 456.35 points, or 13.48%, shy of that high. February 19th was also the date that I announced our latest portfolio stocks... Read More
ChartWatchers May 08, 2020 at 10:29 PM
It's been quite a week for the markets, as a gradual reopening from a global lockdown has investors hopeful that economic damage from the pandemic might be stemmed... Read More
ChartWatchers May 08, 2020 at 08:04 PM
Most of my guests in recent weeks on The Final Bar have embraced the "we're due for a pullback" thesis... Read More
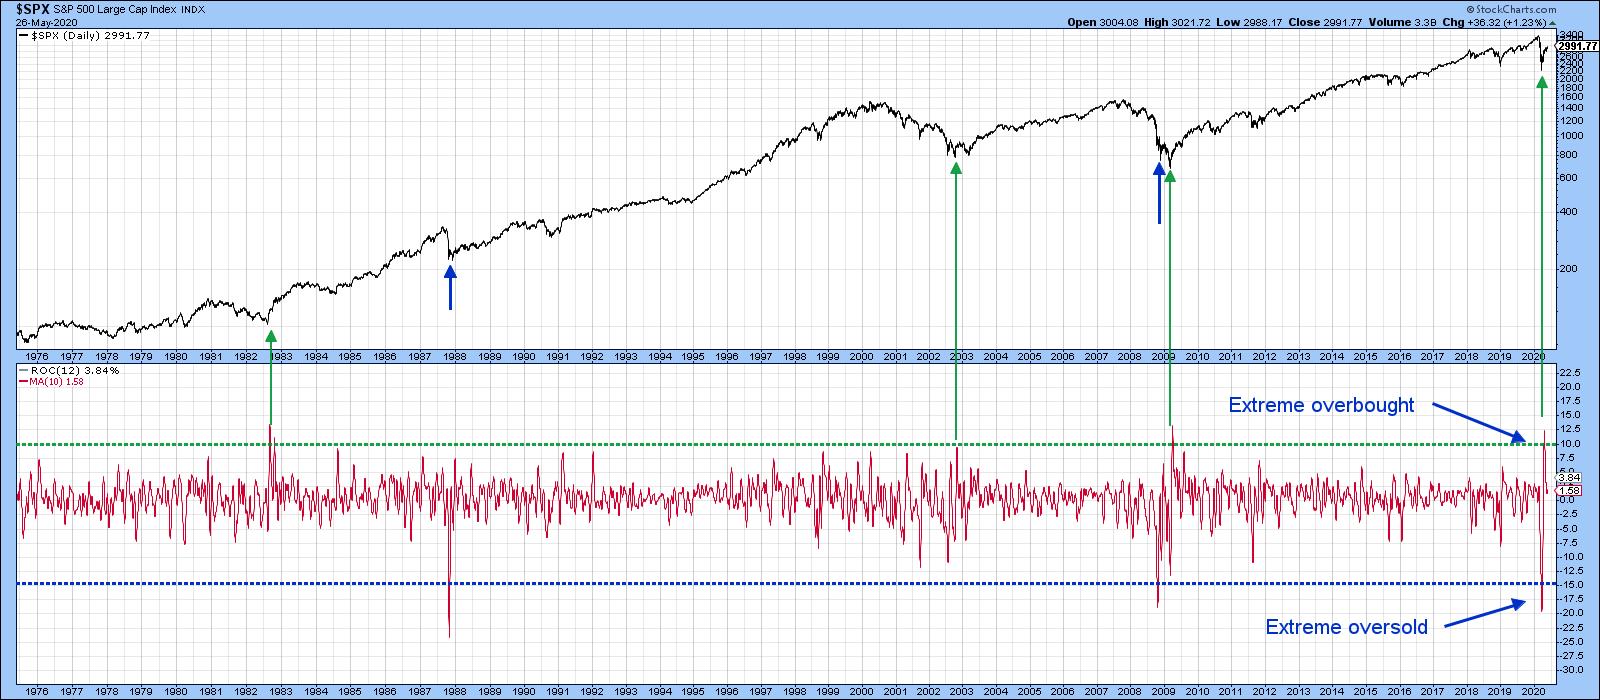
ChartWatchers May 08, 2020 at 06:44 PM
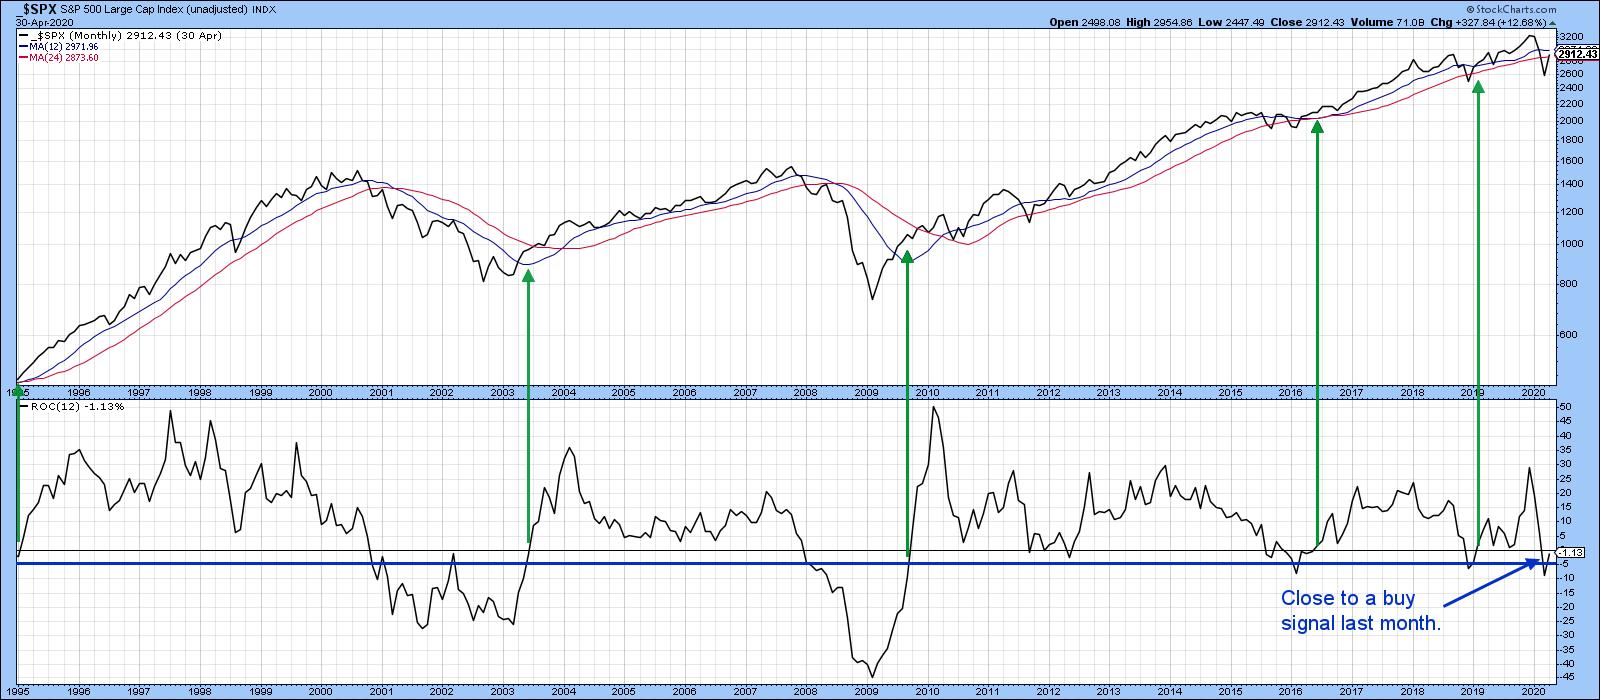
Sixty-Five Year Record of Success One of my favorite long-term indicators involves the 12-month ROC of the S&P Composite falling below the -5% level and subsequently rallying back above zero... Read More
ChartWatchers May 08, 2020 at 02:22 PM

Sometimes it is unclear how daily and weekly RRGs align with each other. Just to be clear, this is not the same as the difference between daily and weekly RRGs. With regard to that difference, there is a ChartSchool article that explains it in detail... Read More
ChartWatchers May 01, 2020 at 09:00 PM
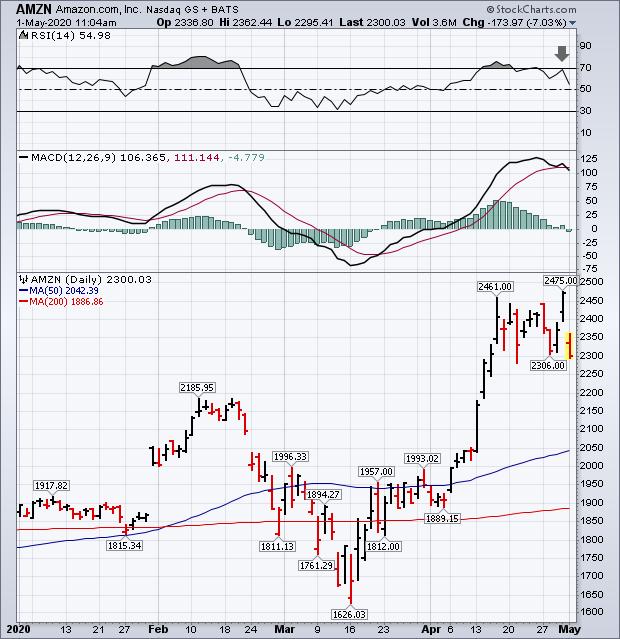
Stocks in general are undergoing some profit-taking today. And consumer cyclicals are one of the day's weakest groups. A big reason for that is today's big drop in Amazon.com (AMZN)... Read More
ChartWatchers May 01, 2020 at 06:56 PM
Last Wednesday, the NASDAQ got within just a few very strong sessions of reaching its all-time high... Read More
ChartWatchers May 01, 2020 at 06:39 PM
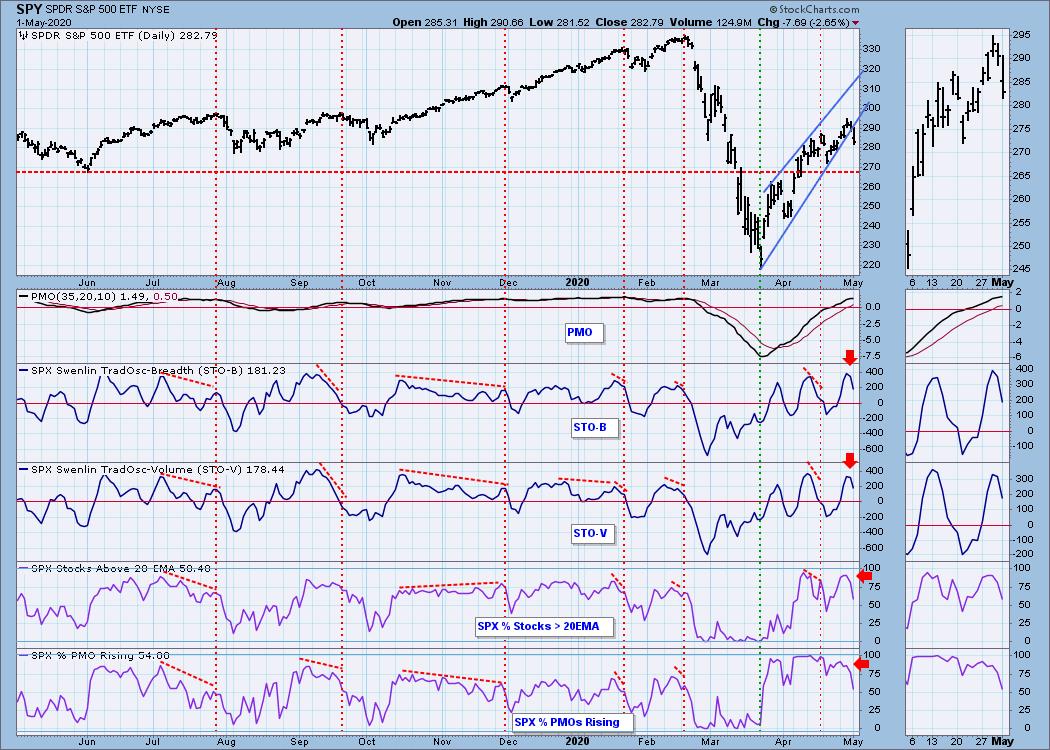
Yet again, the Swenlin Trading Oscillators gave our readers early warning for today's decline. I have written about their previous successes in ChartWatchers, but I wanted to report back to you that they are continuing to be leading indicators... Read More
ChartWatchers May 01, 2020 at 04:58 PM

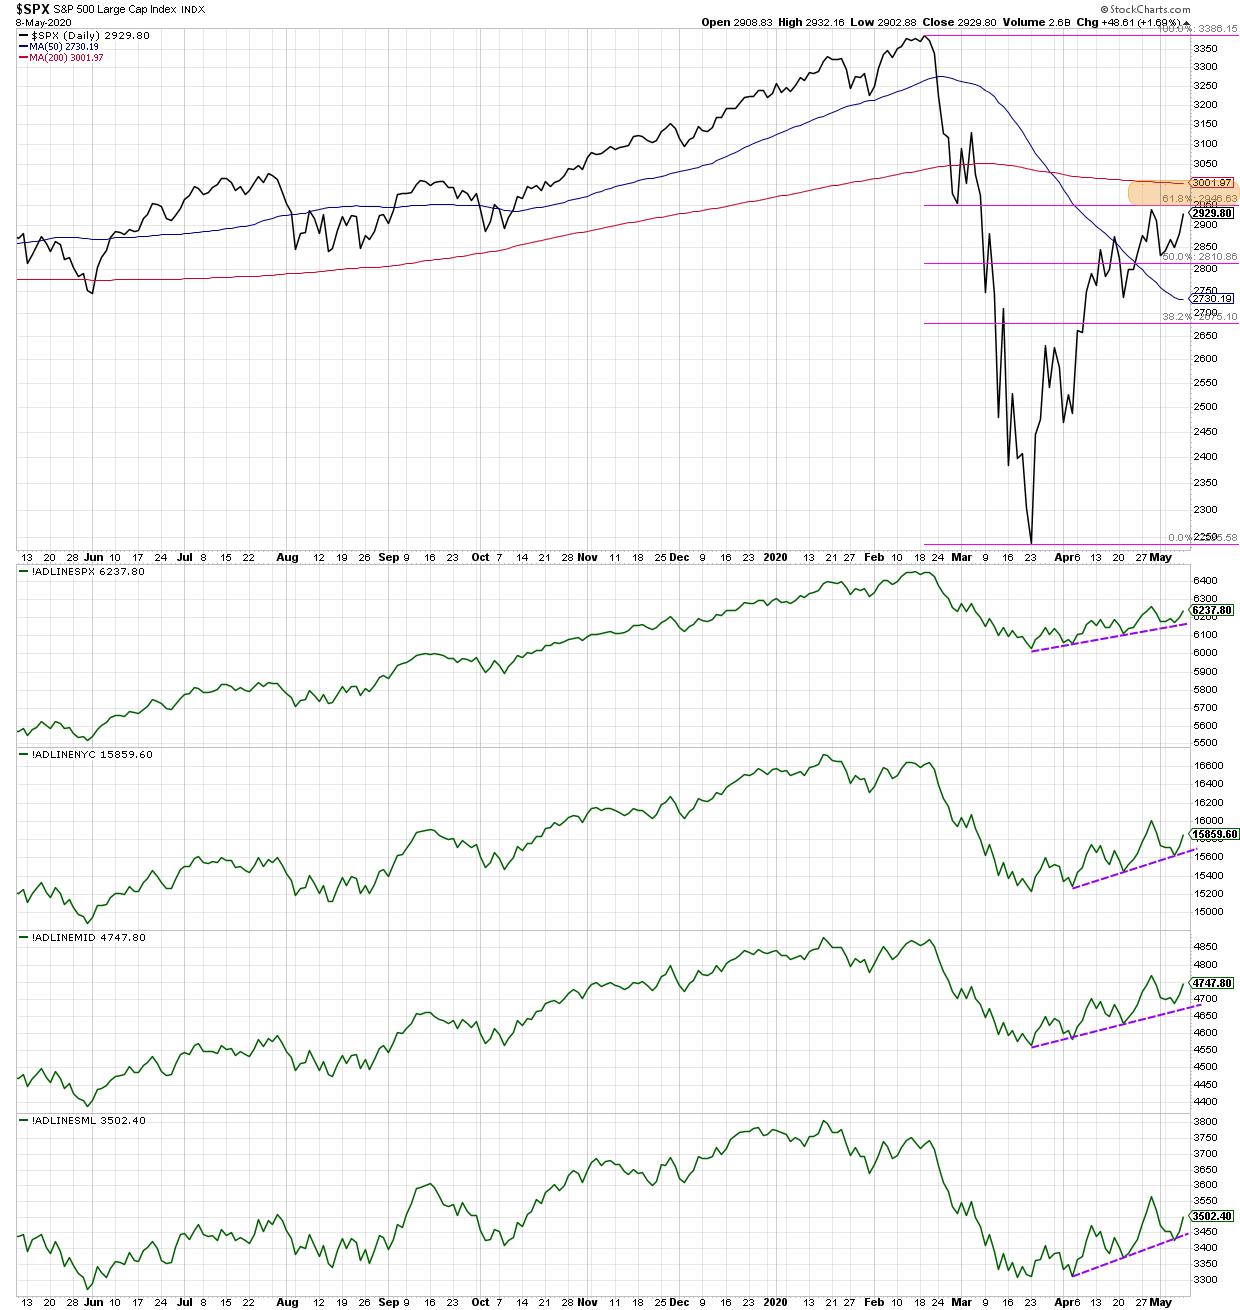
Despite a massive advance the last six weeks, the bulk of the evidence indicates that we are still in a bear market environment. The advance off the March low, while impressive on its own, still pales in comparison to the prior decline. The S&P 500 SPDR retraced around 61... Read More
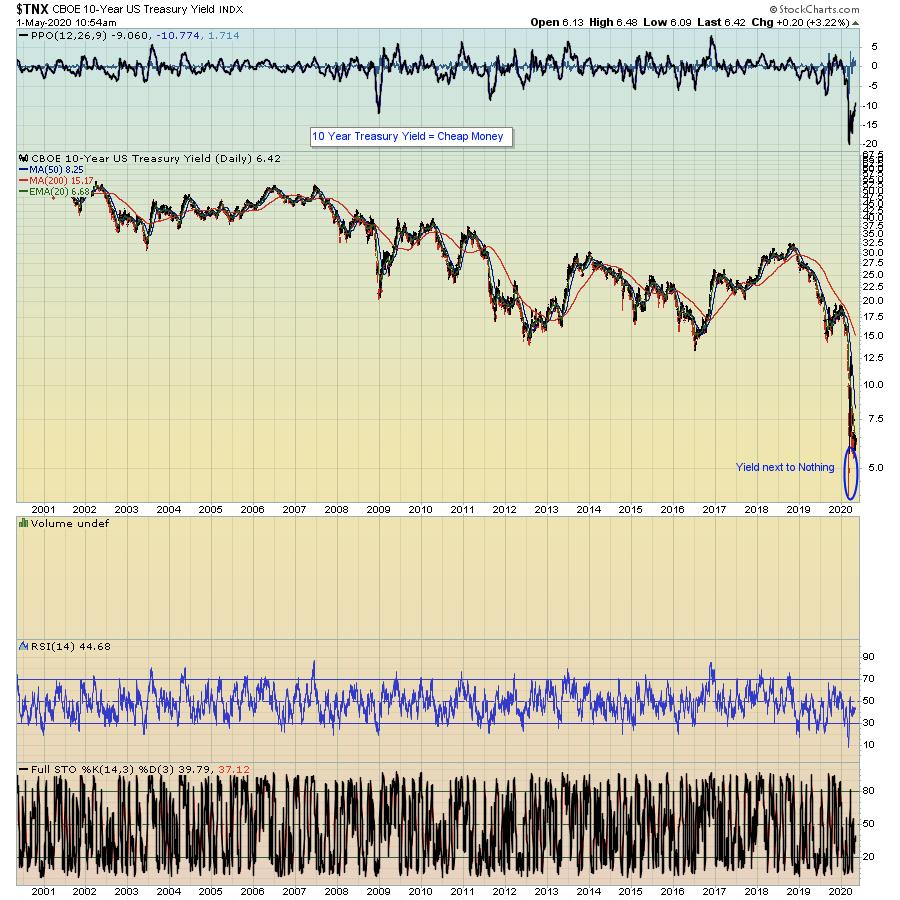
ChartWatchers May 01, 2020 at 02:34 PM
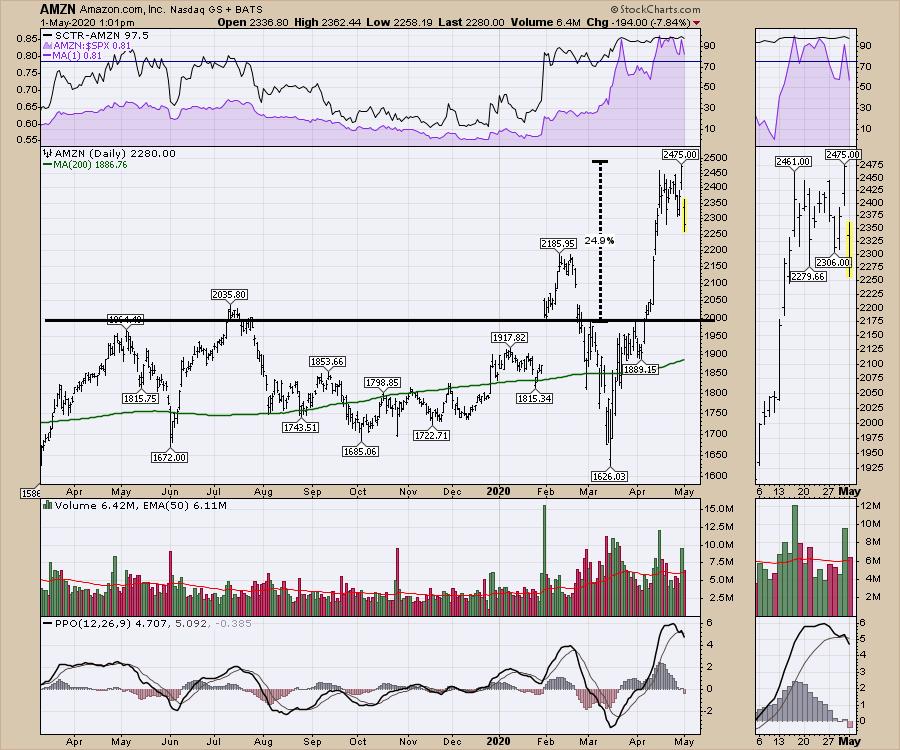
It seems odd that the best company in the COVID-19 backdrop gets crushed after earnings. AMZN is down $200 after their earnings announcement. It is still a great company, but that is a vicious reversal. Currently, it is giving back 40% of the breakout... Read More