ChartWatchers March 27, 2021 at 12:43 AM
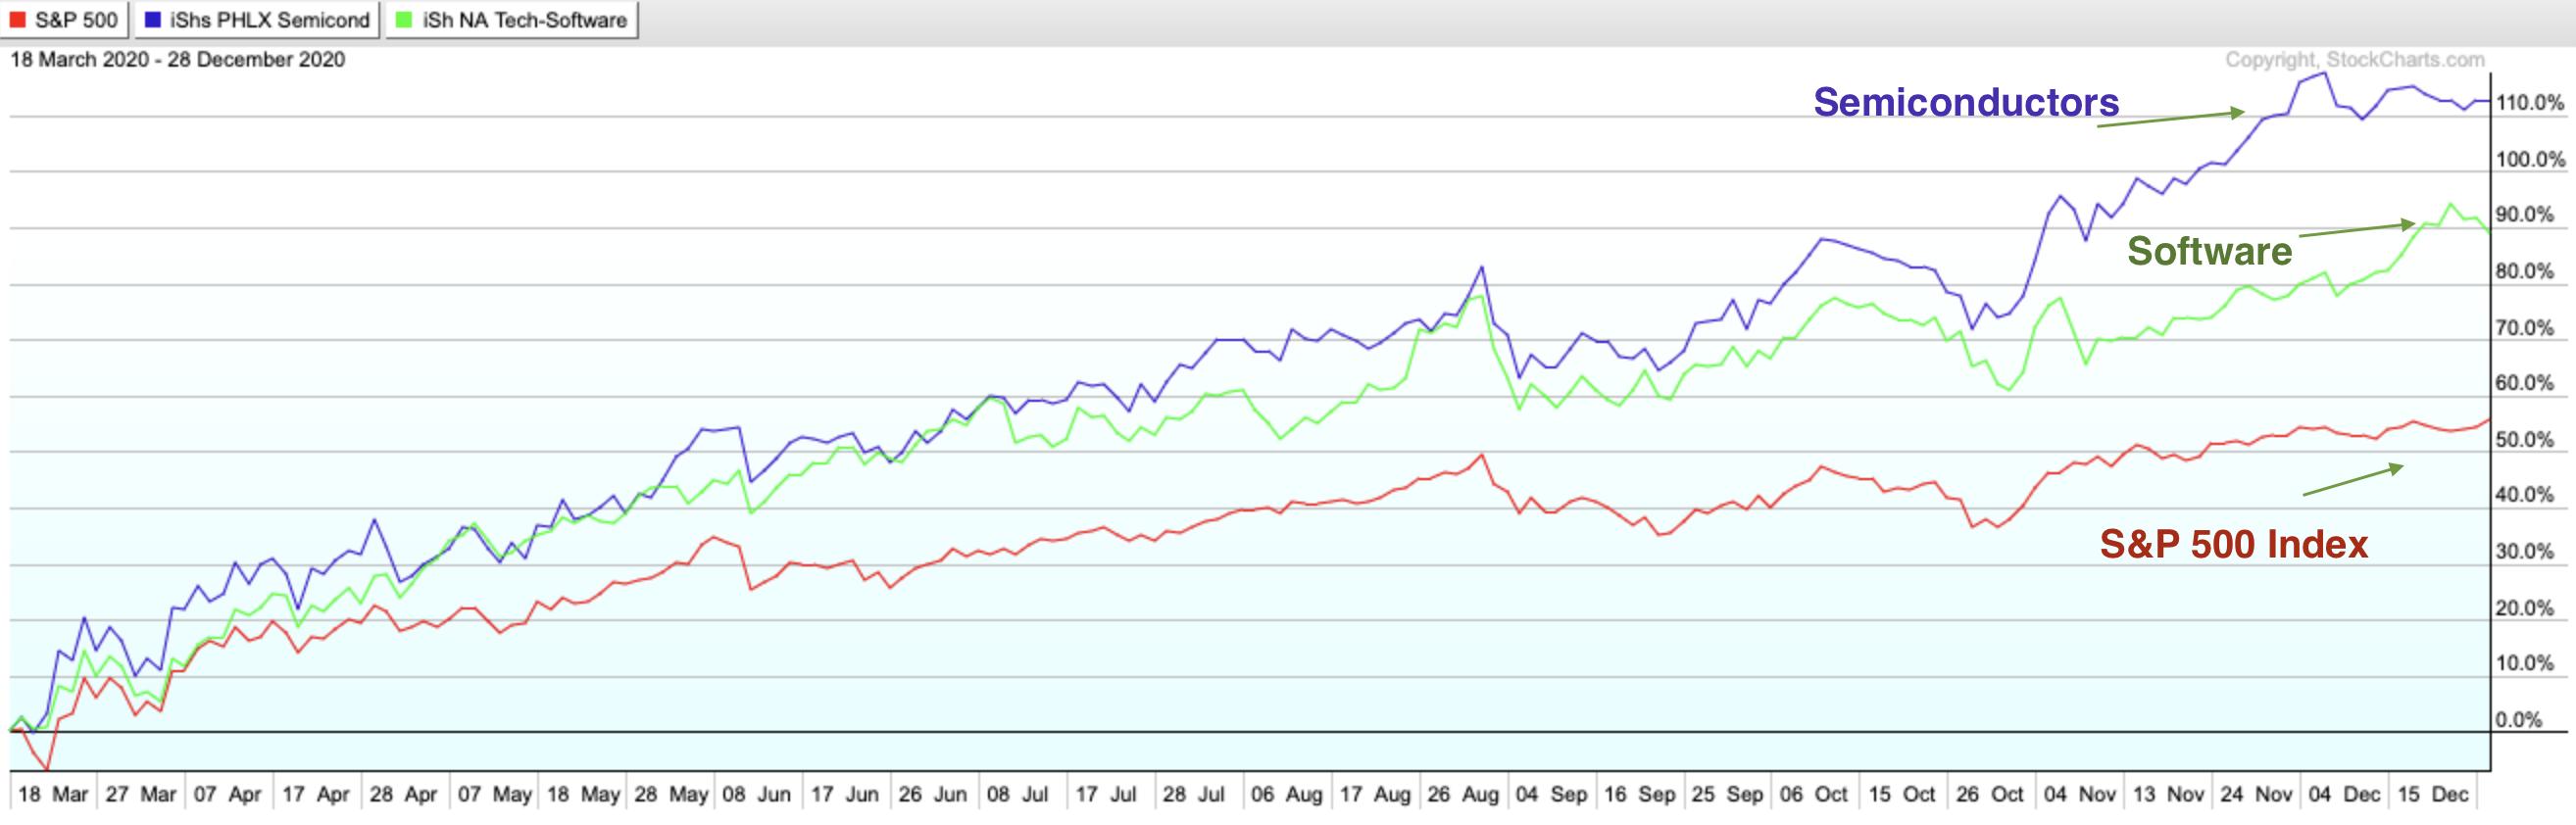
Have you ever noticed that top-performing stocks travel in groups? Just look at last year's biggest winners out of the bear market, where Technology stocks far outpaced the markets. Within Technology, many out-performers were Cloud Computing related stocks... Read More
ChartWatchers March 26, 2021 at 10:17 PM
I'm sure that most of you have heard that old Wall Street adage "buy on rumor, sell on news." Well, it's never truer than with earnings. Wall Street meets with management teams prior to the end of the fiscal quarter and gathers a lot of information... Read More
ChartWatchers March 26, 2021 at 10:04 PM
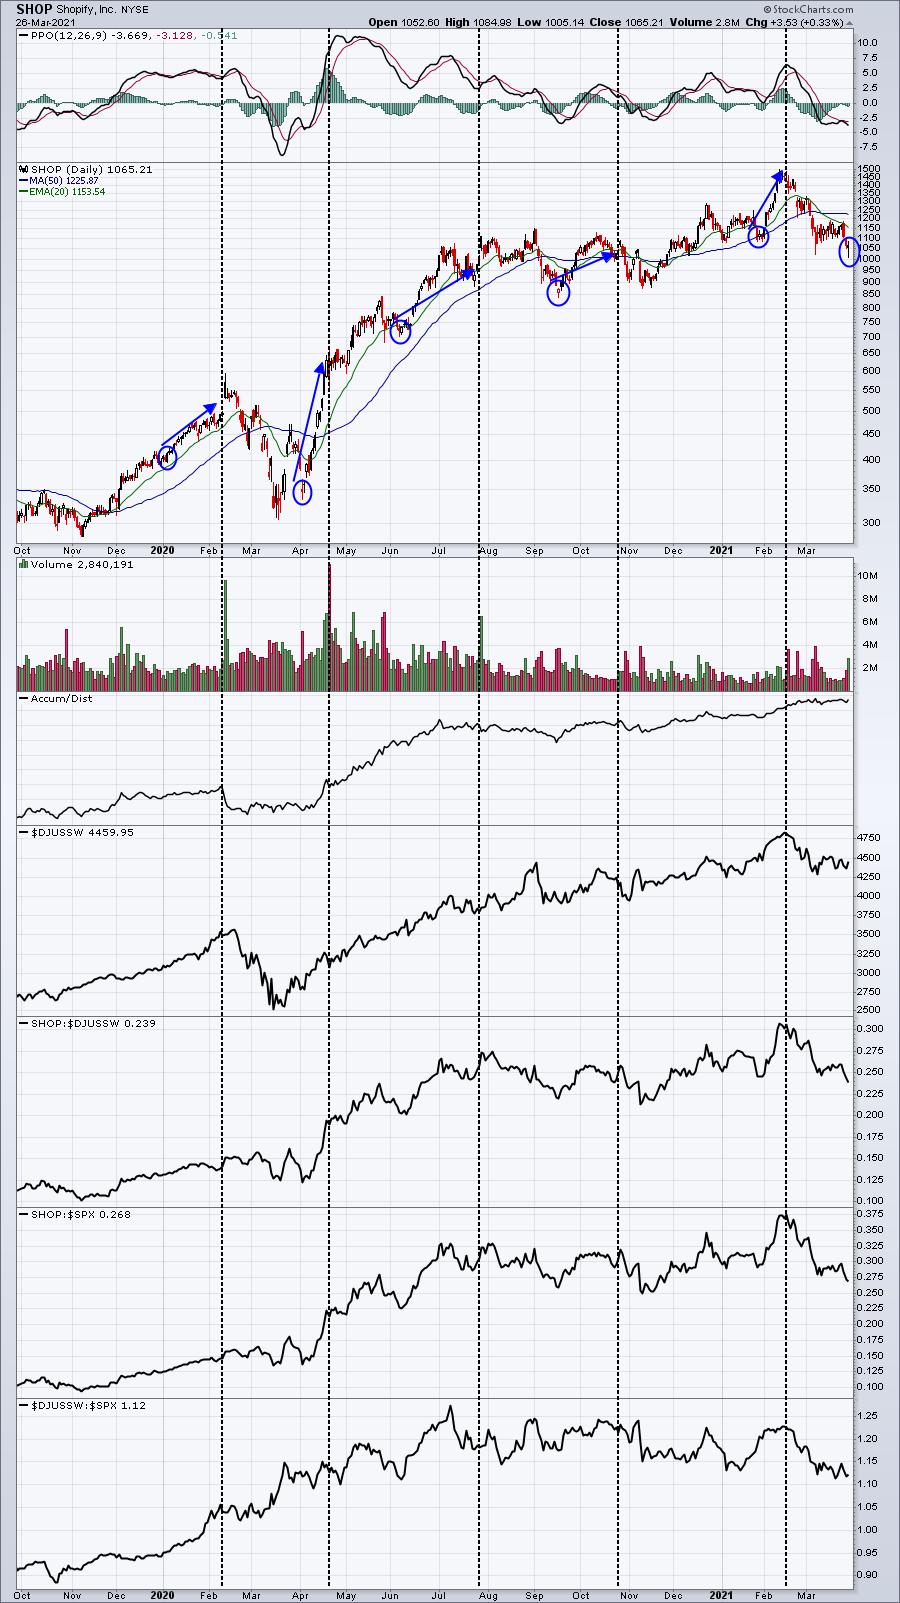
Relative strength is one of the most important parts of my technical toolkit. Basically, the idea is to lean into stocks that are working and lean away from stocks that are not working... Read More
ChartWatchers March 26, 2021 at 08:00 PM
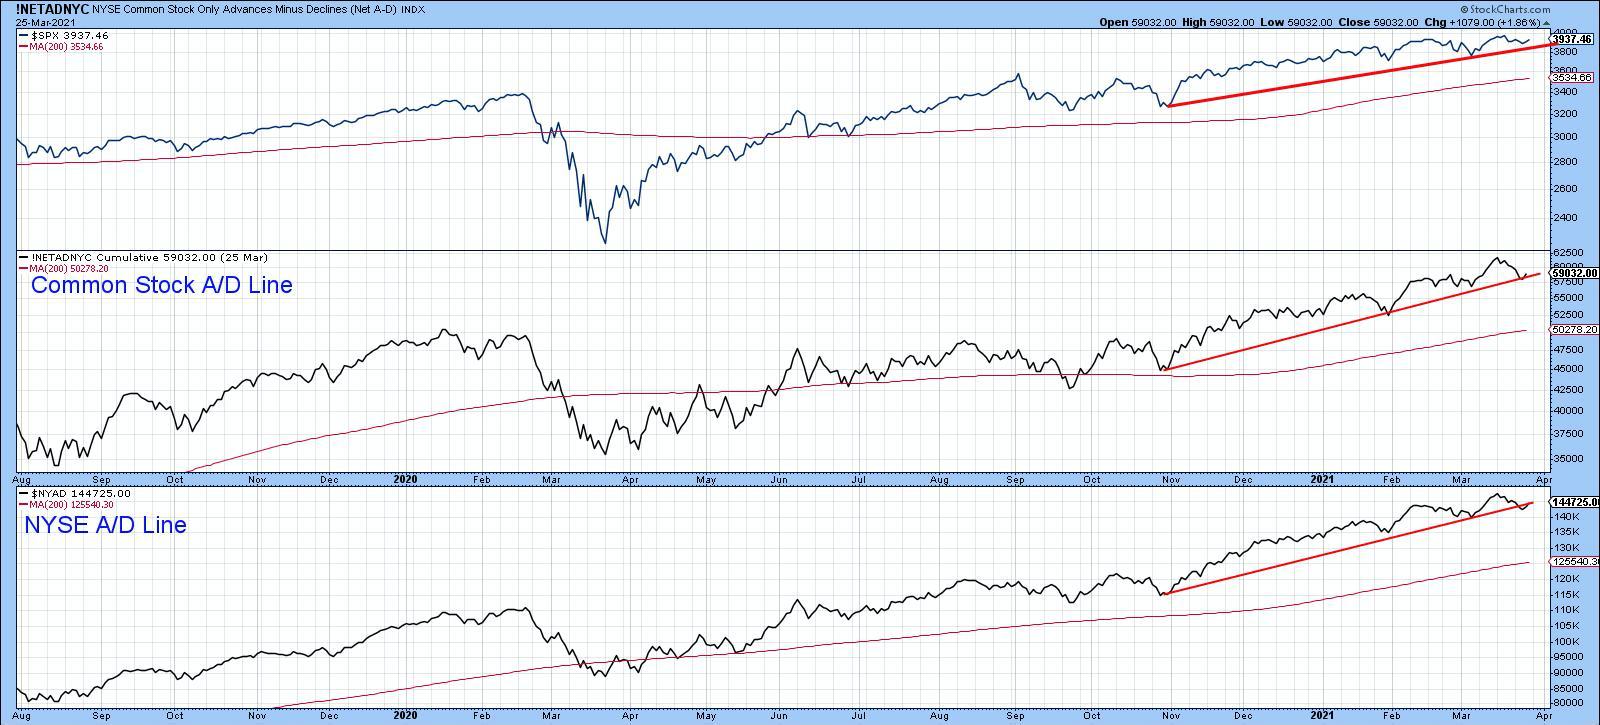
It's never a good idea to try and predict contra-trend moves in a strong equity bull market, because the benefit of the doubt always goes with the prevailing trend. If false moves develop, they have a strong tendency to develop on the downside... Read More
ChartWatchers March 26, 2021 at 05:23 PM

There is no doubt about it; Tech(nology) is an important sector. As a matter of fact, it is a crucial sector... Read More
ChartWatchers March 20, 2021 at 02:17 AM
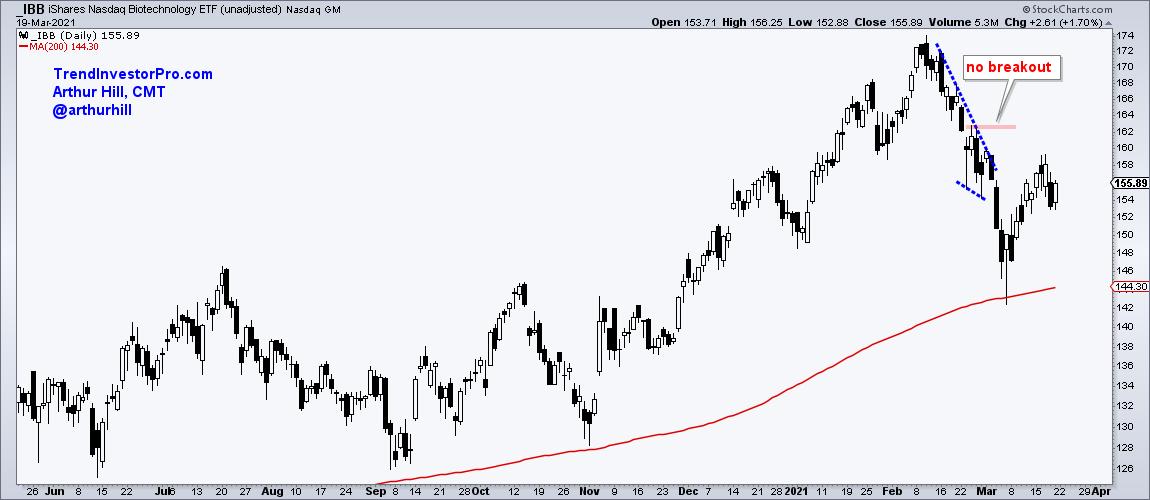
I wrote about the Biotech ETF (IBB) on February 28th as it pulled back from a new high. The pullback was viewed as a correction within the bigger uptrend, but the correction extended further than expected... Read More
ChartWatchers March 19, 2021 at 09:07 PM
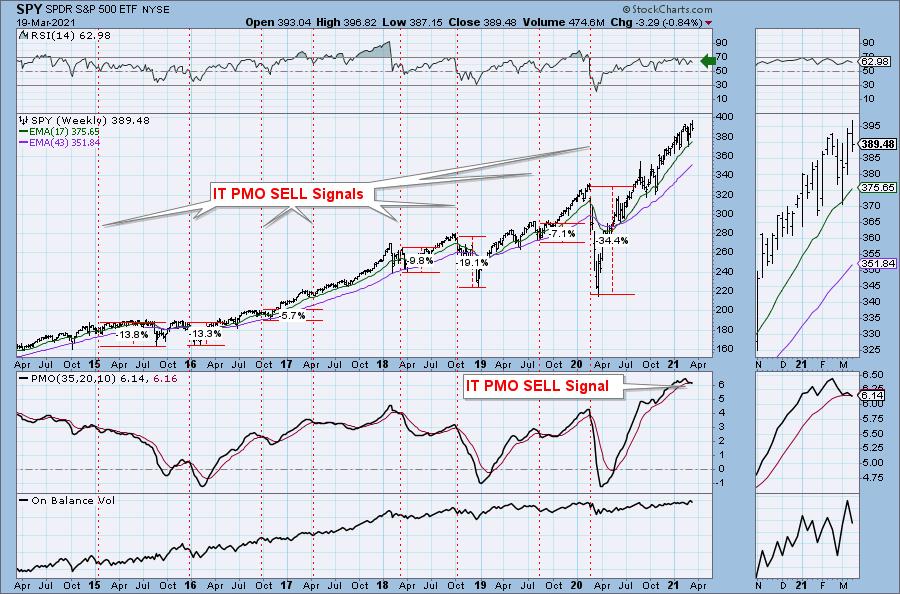
Today, the weekly PMO crossed below its signal line, which hasn't occurred since the early 2020 bull market top. The chart isn't all bad given the positive RSI and rising OBV... Read More
ChartWatchers March 19, 2021 at 07:25 PM
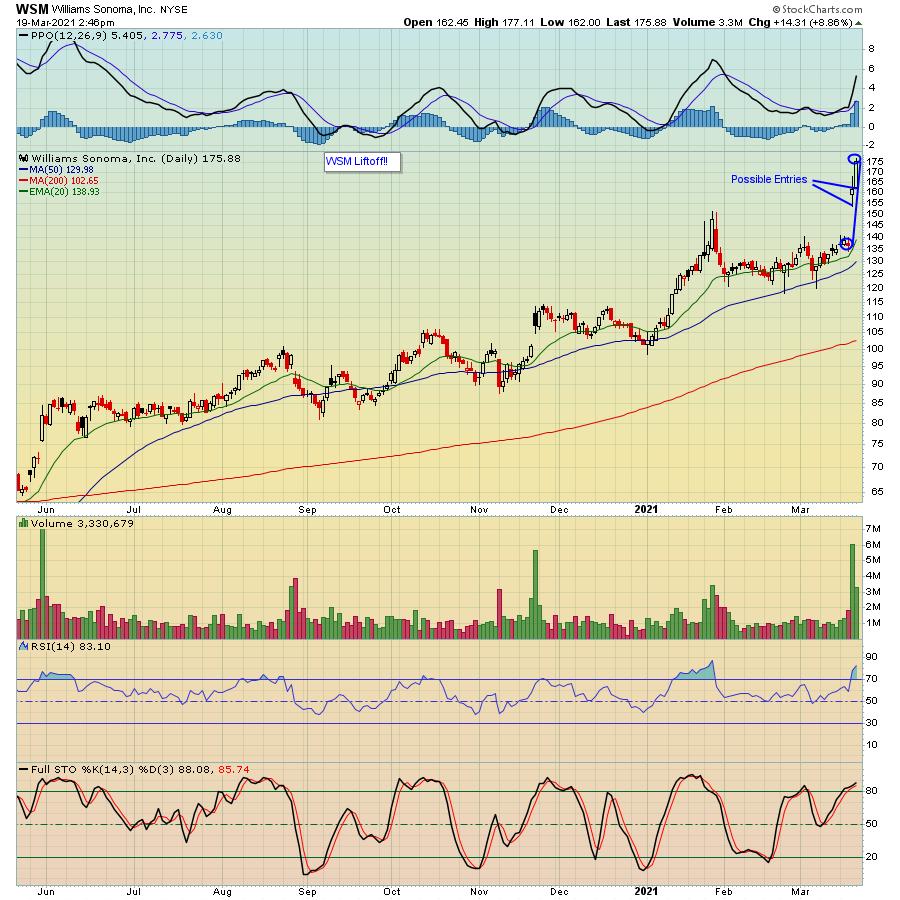
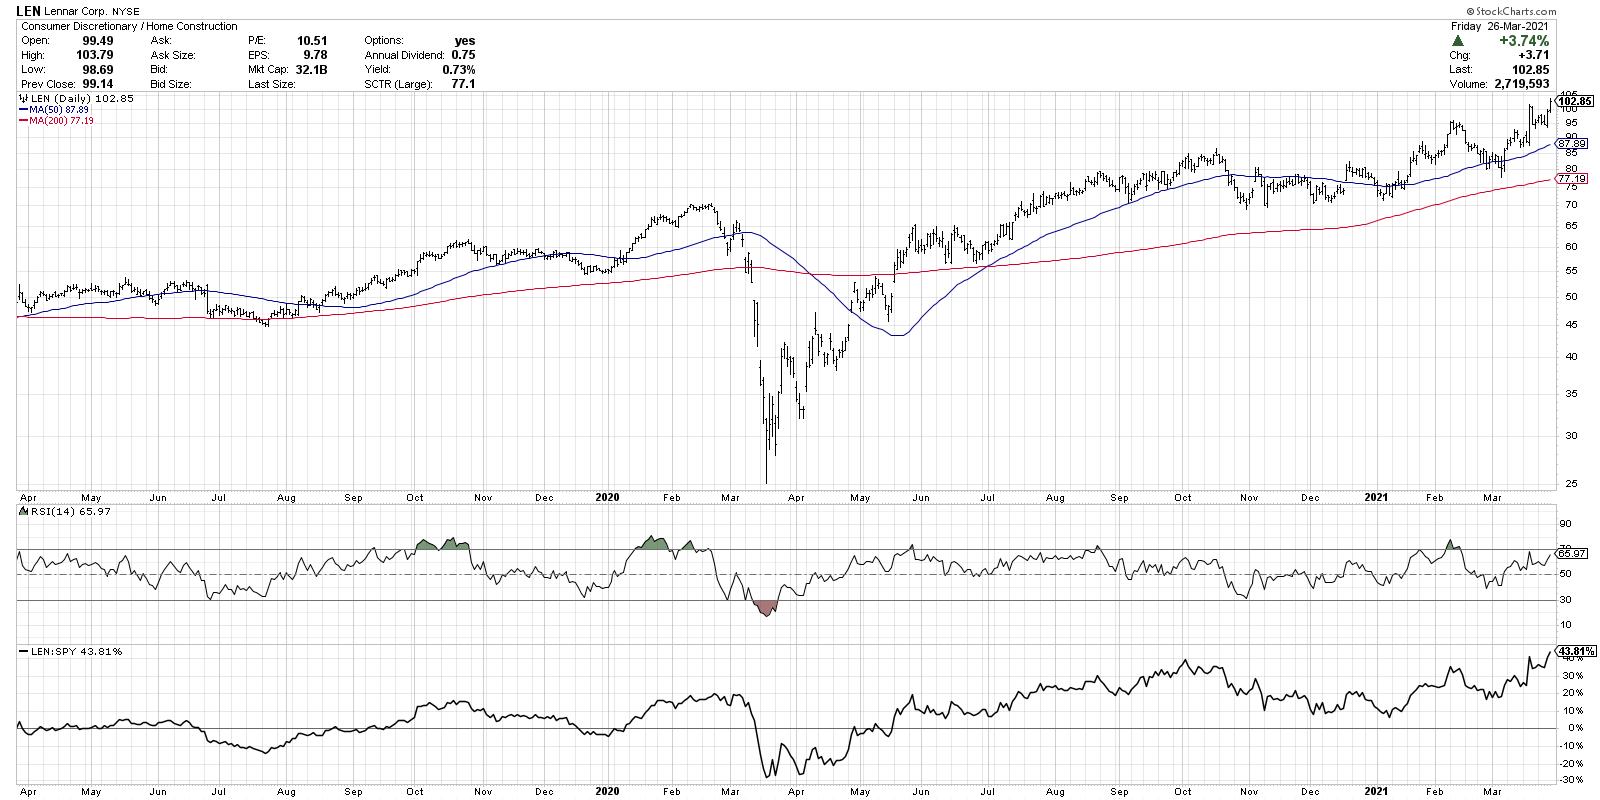
Williams Sonoma, Inc (WSM) reported their earnings this past week and proved that, even in a choppy market environment, strong earnings can be rewarded... Read More
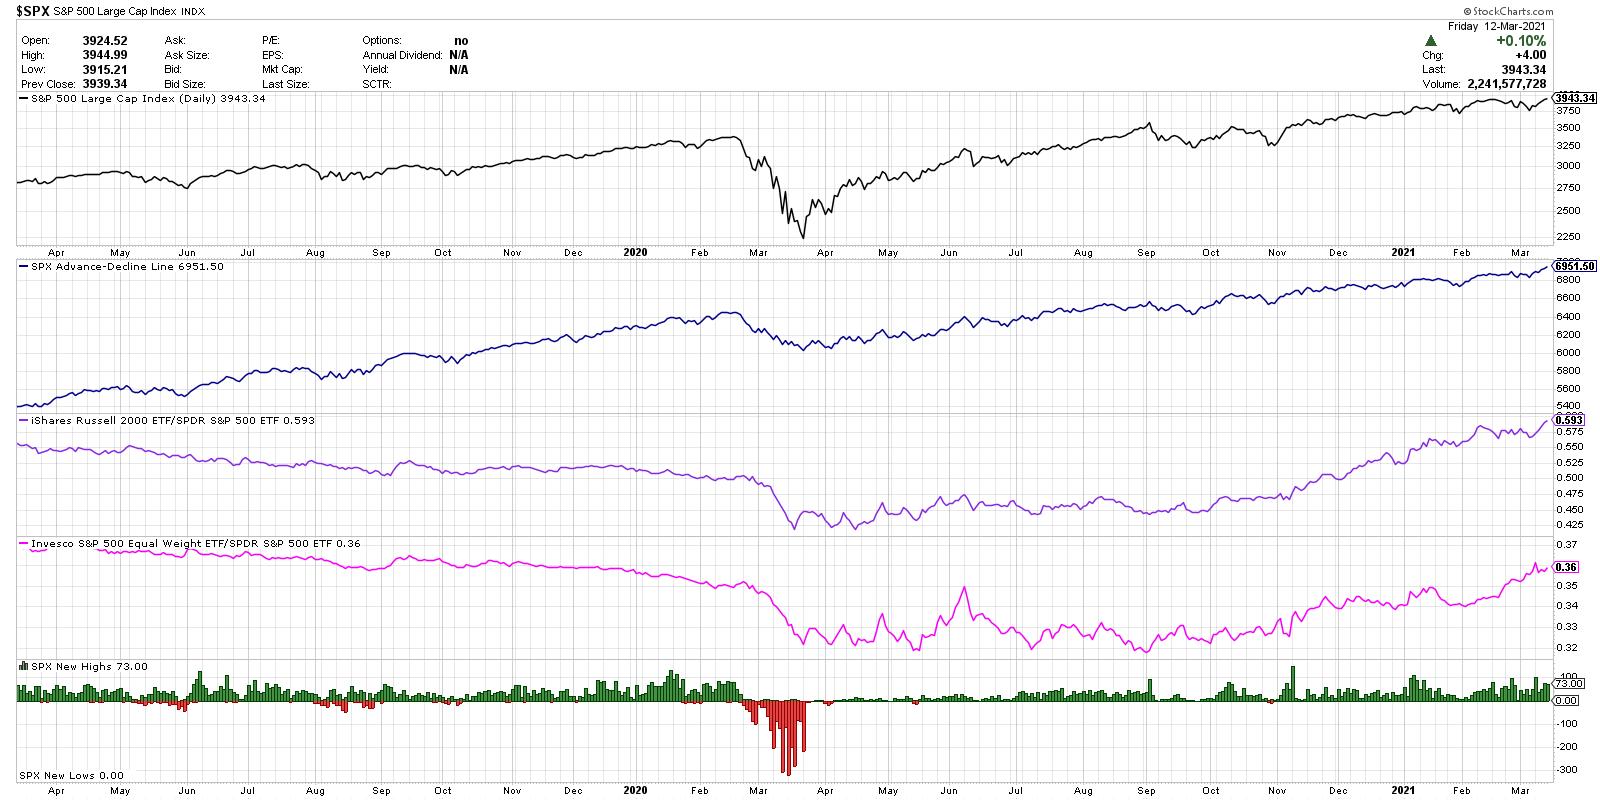
ChartWatchers March 12, 2021 at 11:34 PM
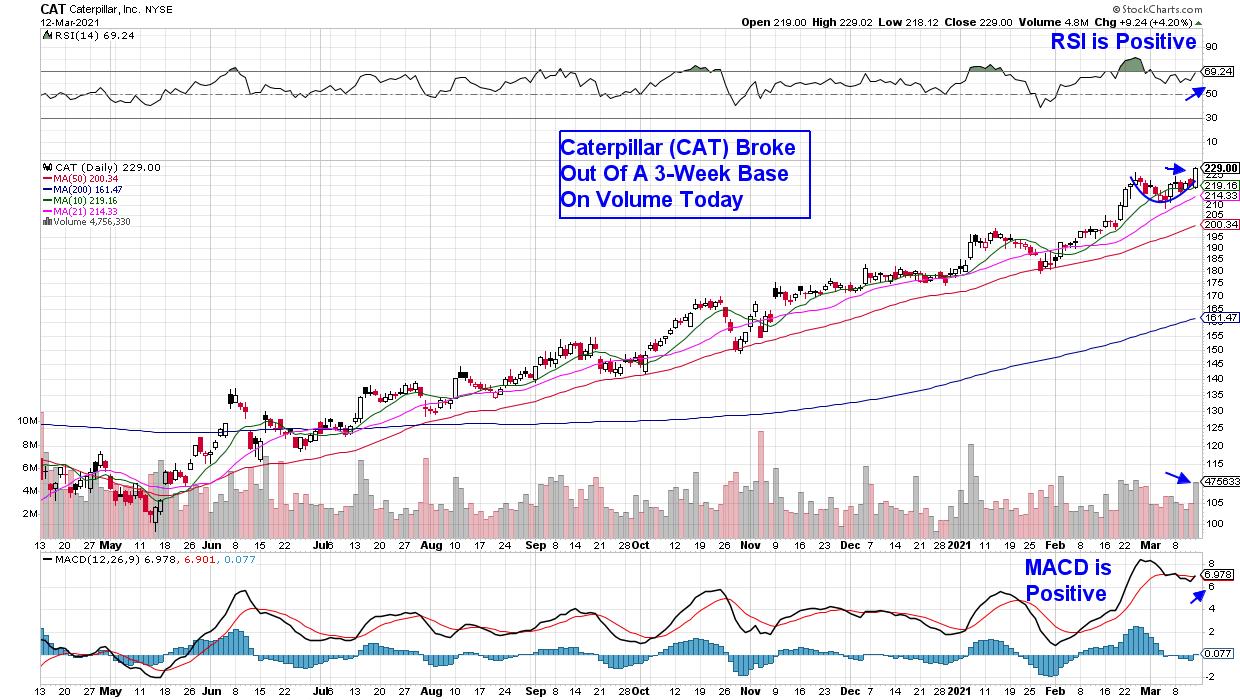
The Dow Jones Industrial Average powered to its fifth consecutive record high today as investors bought shares of companies that'll benefit from a strong reopening of the U.S. economy... Read More
ChartWatchers March 12, 2021 at 09:56 PM
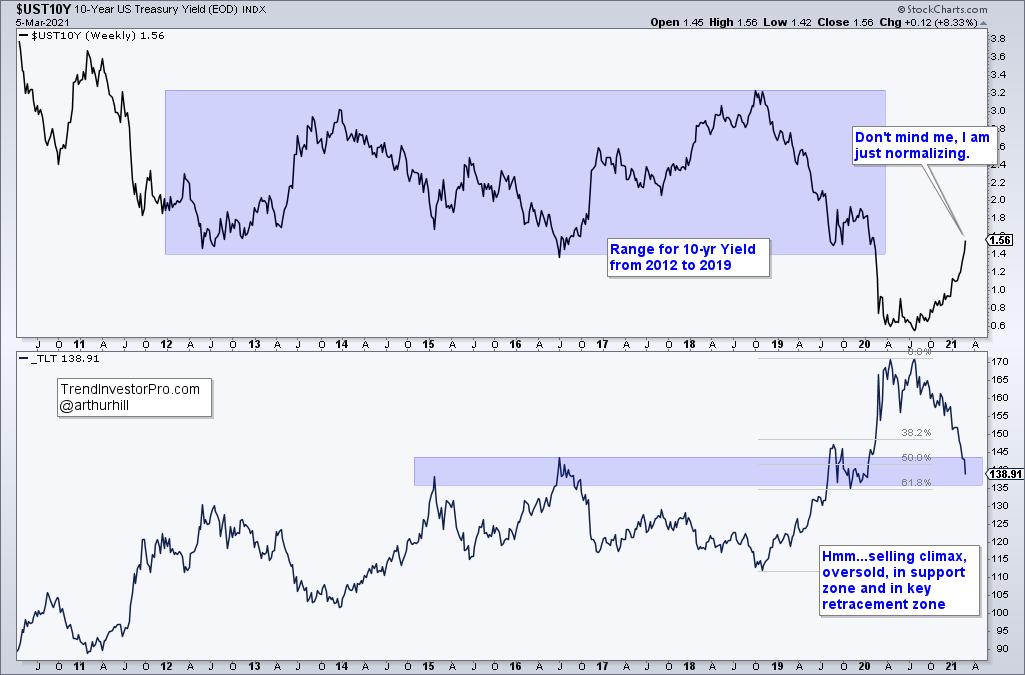
At the time of my last ChartWatchers article two weeks ago, the 10-year treasury yield ($TNX) had just closed at 1.46% after reaching an intra-week high at 1.61%. Well, we didn't stop there. The TNX had a big day on Friday, gaining nearly 11 basis points and closing at 1... Read More
ChartWatchers March 12, 2021 at 09:09 PM
I have learned over my career to be skeptical. I have learned to question my investment thesis and actively argue the other side of any position to challenge my own analysis. I have learned to actively search out people that disagree with me and try to see what they are seeing... Read More
ChartWatchers March 12, 2021 at 06:33 PM

The Growth/Value relationship is always interesting to keep an eye on -- but even more so recently. For a long period of time, roughly from late 2018 until Q3 2020, Growth stocks were beating Value hands down... Read More
ChartWatchers March 05, 2021 at 09:00 PM
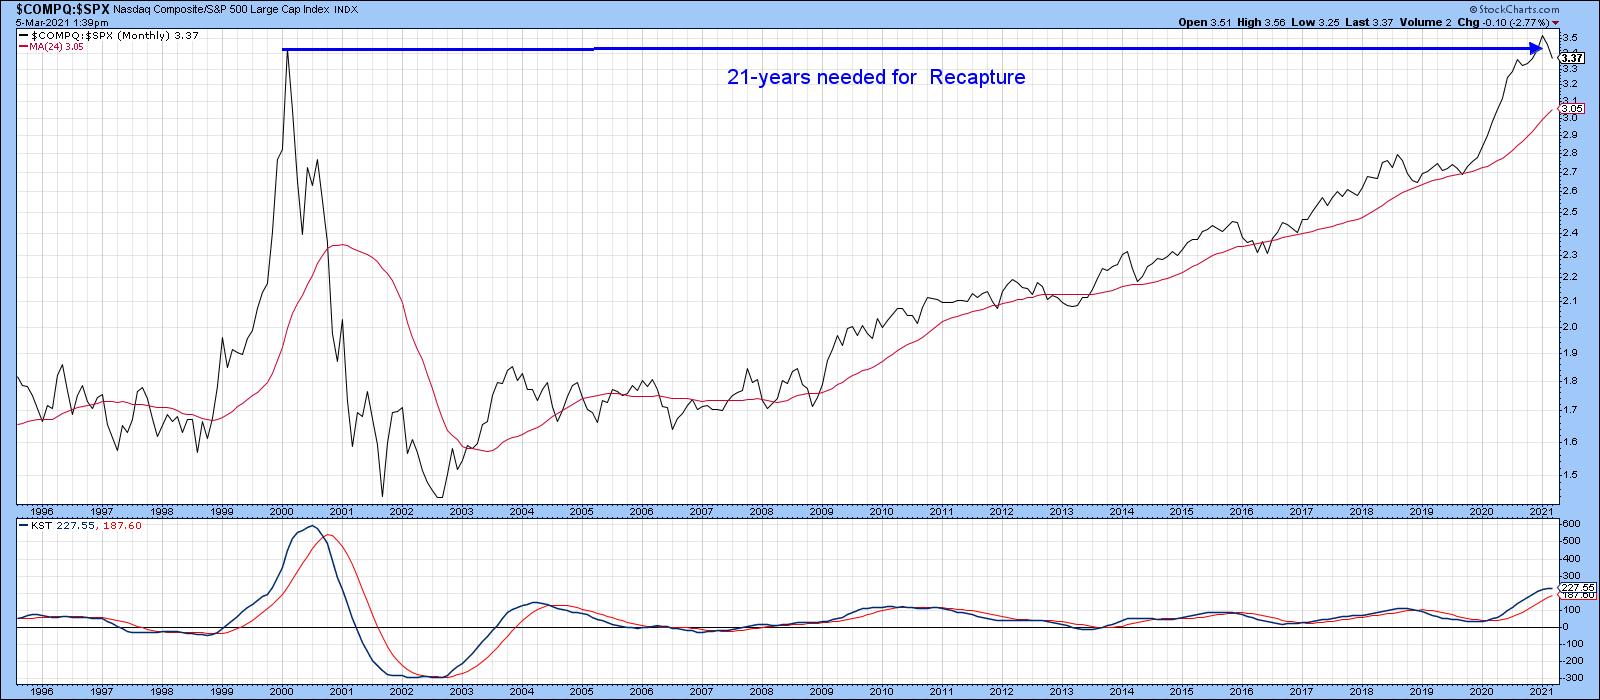
Technology, as reflected in the tech-dominated NASDAQ Composite, peaked as a group in 2000 and sank in popularity for the next 3 years. Since then, as shown by the relative graph in Chart 1, it has recaptured all of that lost ground... Read More
ChartWatchers March 05, 2021 at 08:32 PM
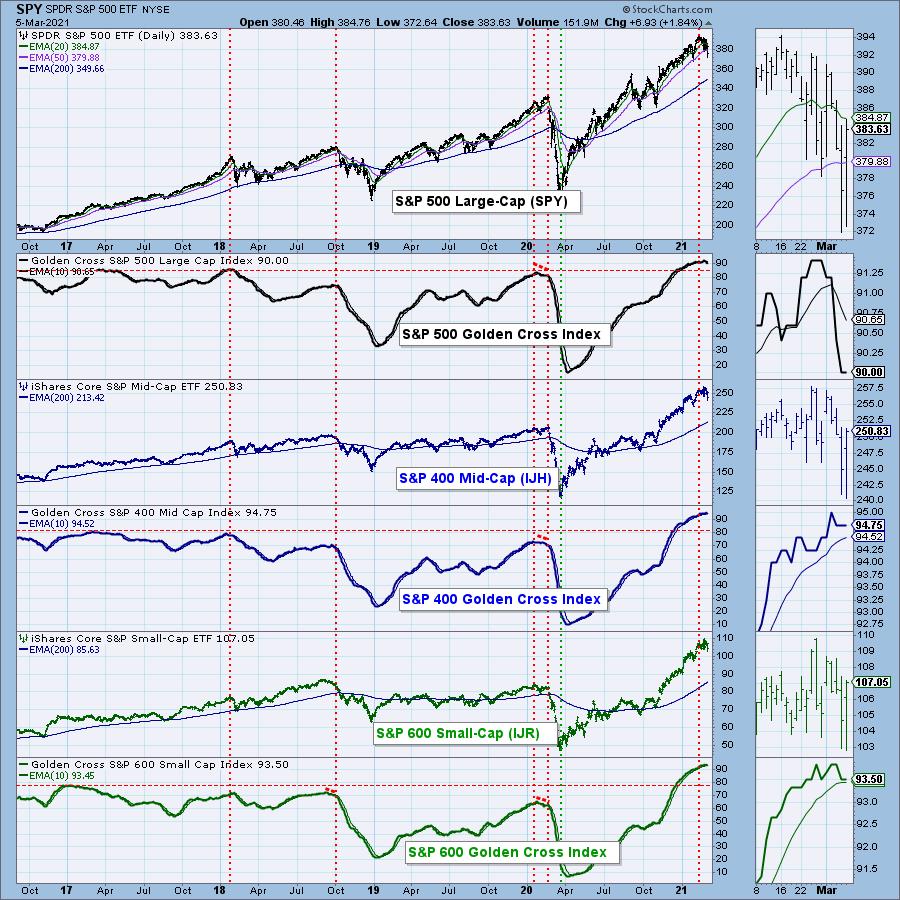
Carl Swenlin ingeniously created the newest DecisionPoint indicators, called the "Golden Cross Index" and "Silver Cross Index". It is actually a simple concept, and one he and I were both surprised hadn't been created yet... Read More
ChartWatchers March 05, 2021 at 07:00 PM
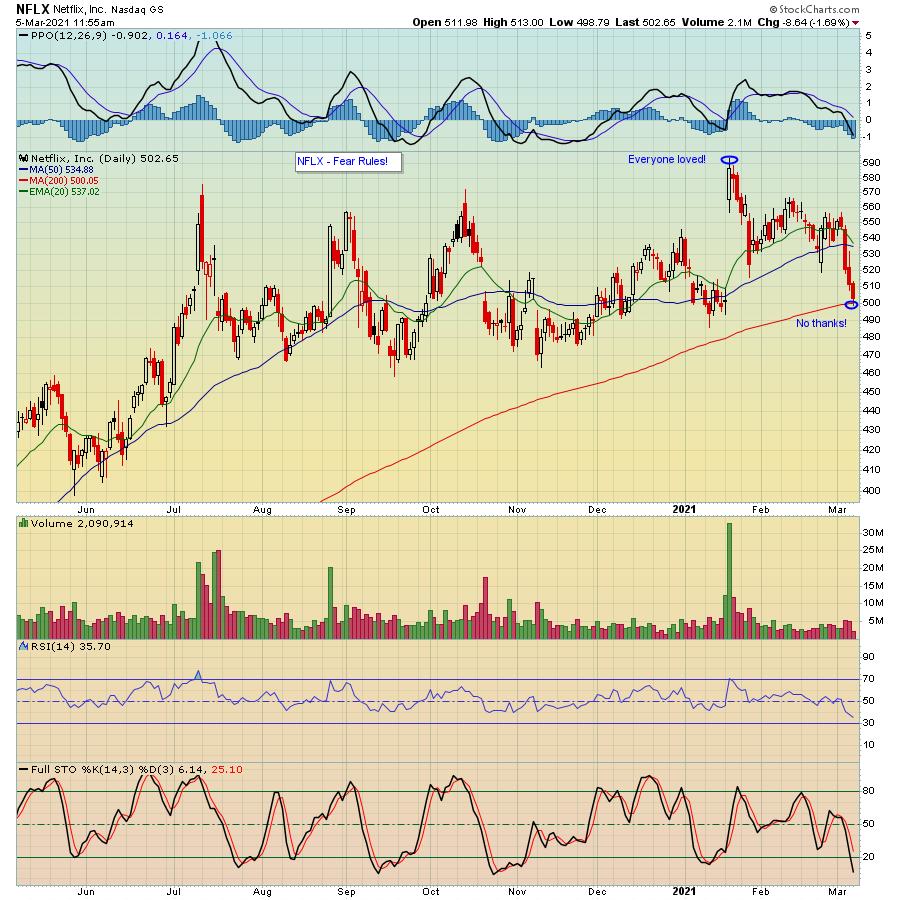
Everyone is giving up on growth stocks, especially given the sharp rise in rates, with the 10 Year US Treasury Note rising as high as 1.62% on Friday. And now, any good news - i.e., a solid jobs report - is seen as bad news, with concerns of a hot economy. Go figure... Read More
ChartWatchers March 05, 2021 at 06:46 PM
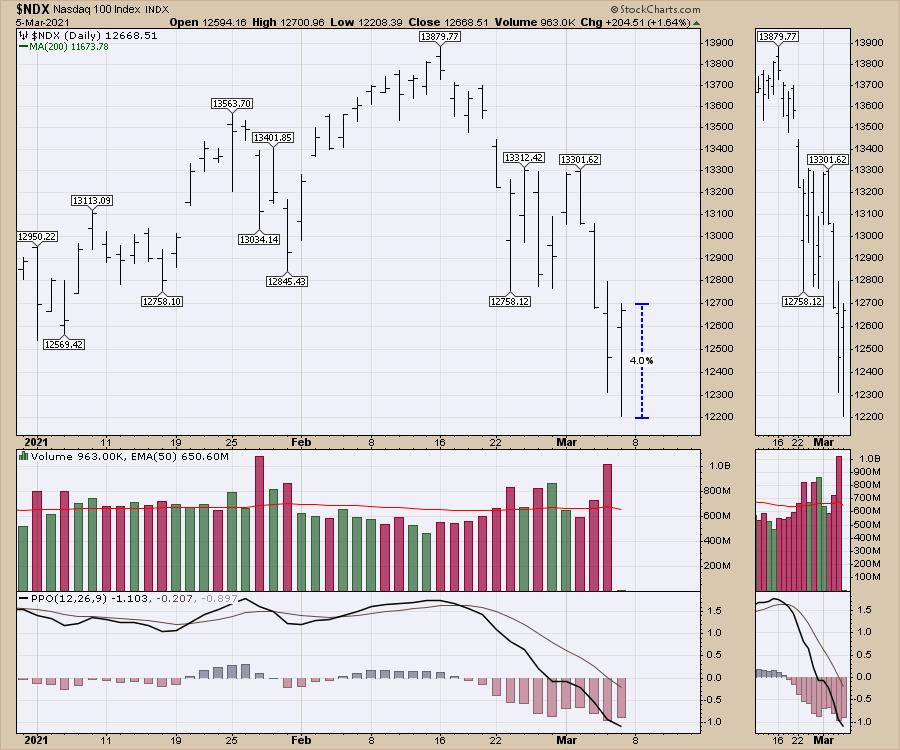
The Friday sch-w-wing on the markets was a welcome respite from the hard selling in the Technology and innovation space. The Nasdaq soared 4.0% from low to high. I like these strong intraday reversals... Read More
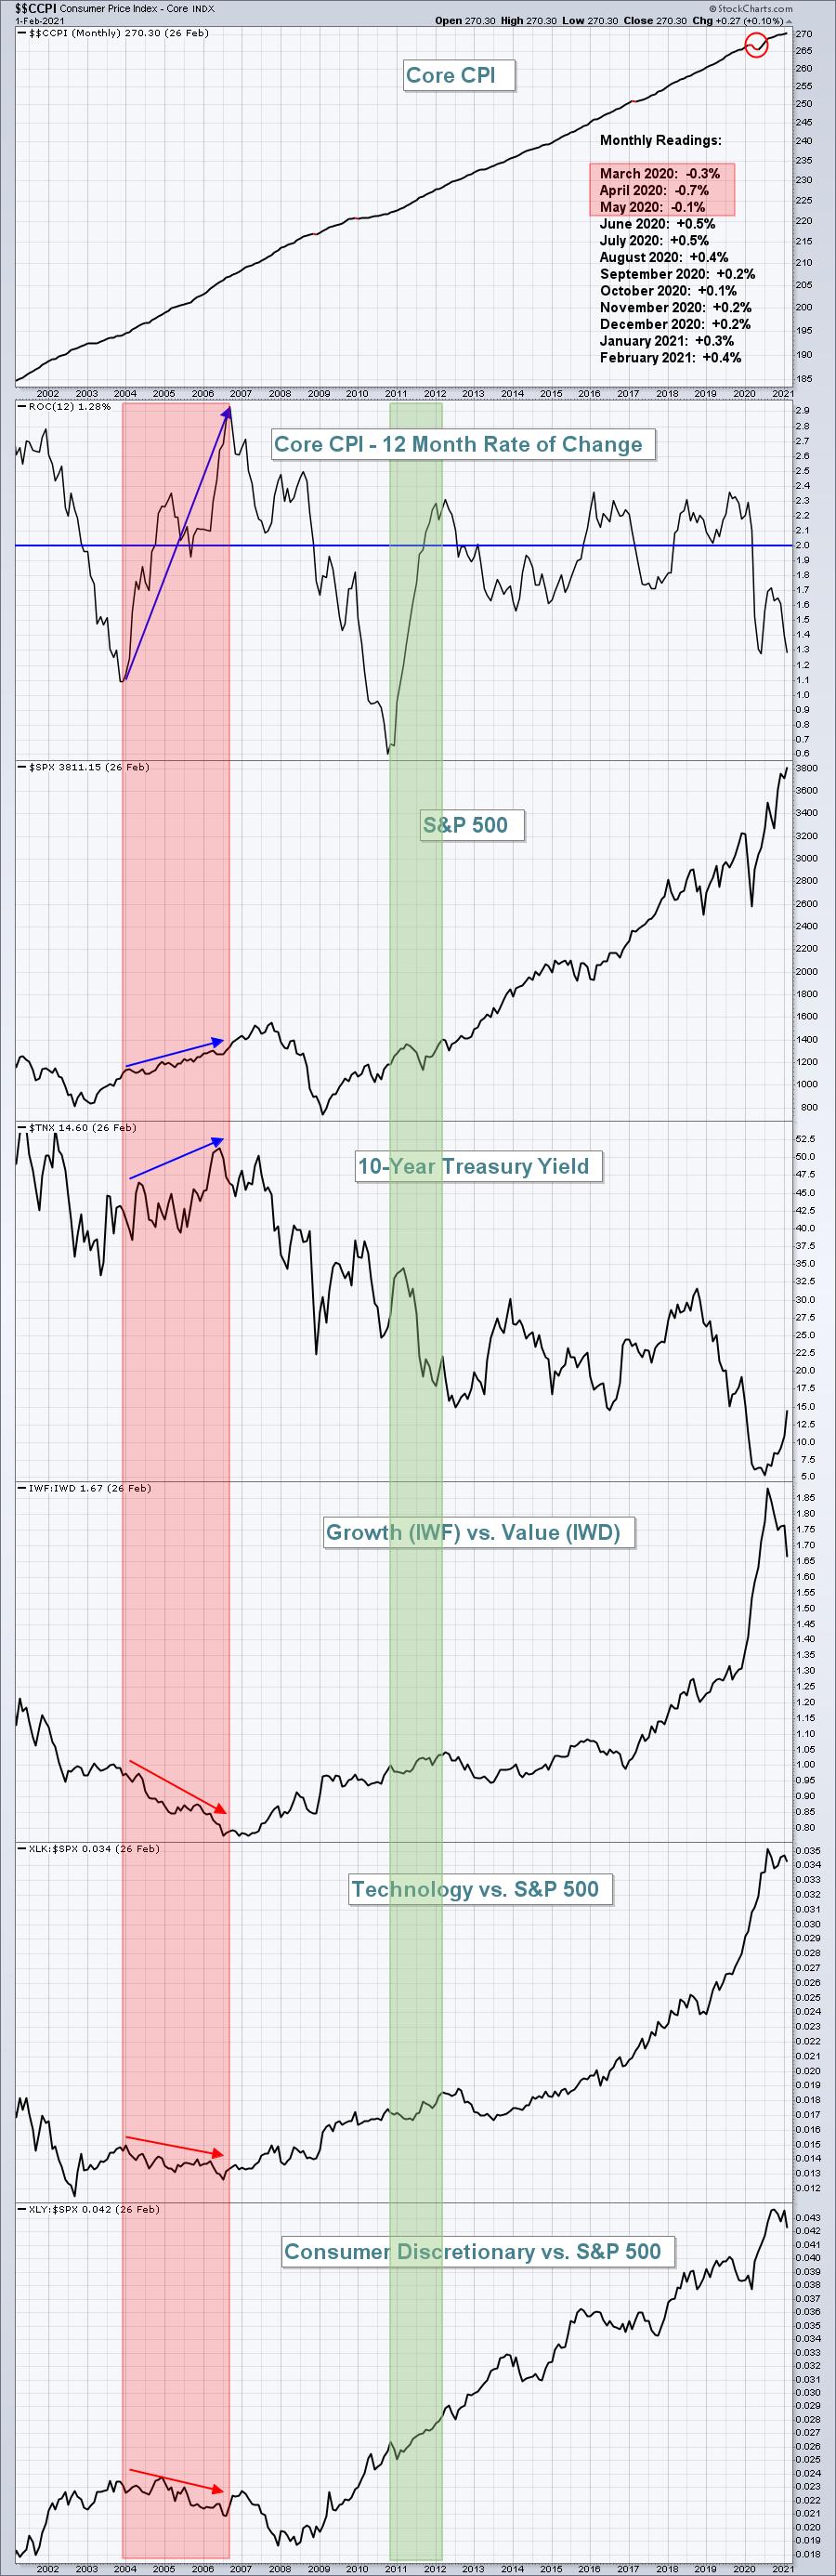
ChartWatchers March 05, 2021 at 05:39 PM
Two items are dominating the news narrative right now: the rise in interest rates and the decline in tech stocks. Are rising rates really an issue for tech stocks? The charts suggest that the evidence is mixed, at best... Read More