ChartWatchers April 30, 2021 at 07:03 PM
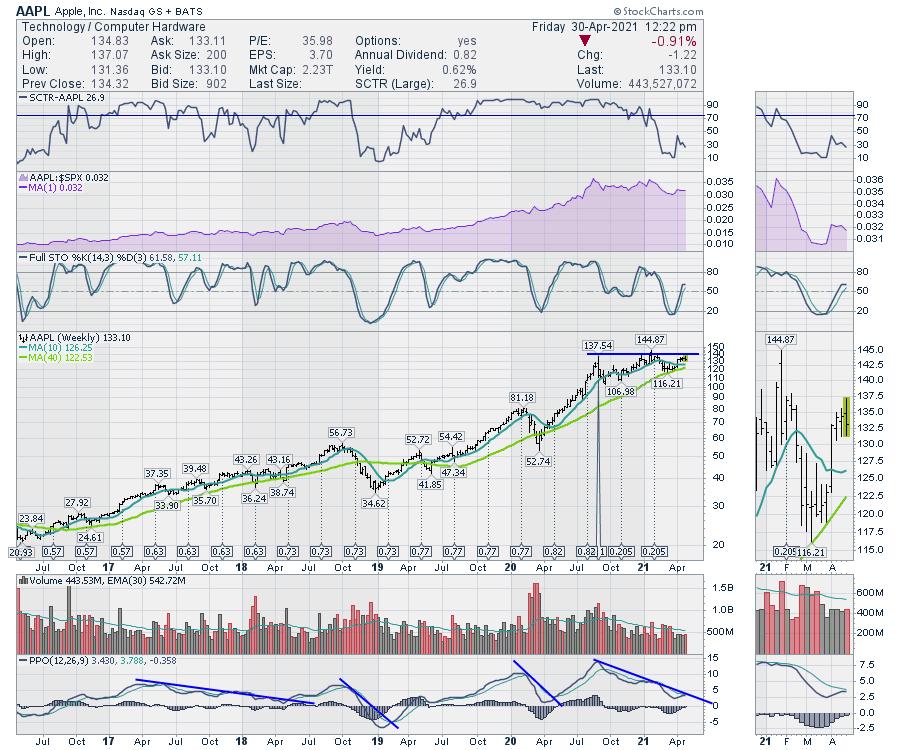
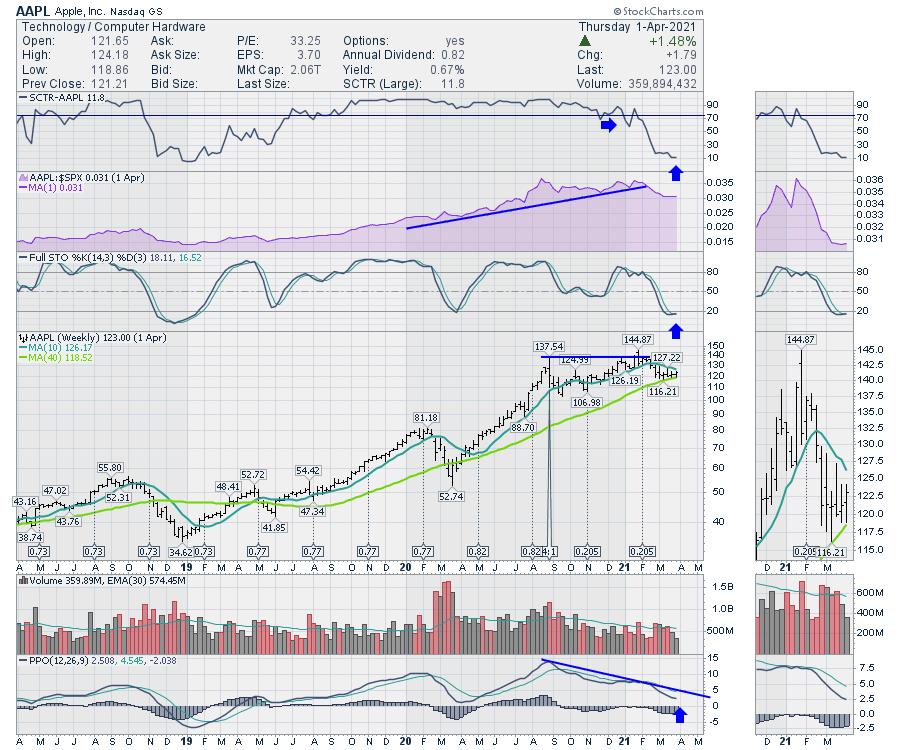
The market heavyweights announced earnings this week. Quite frankly, the numbers were stunning. Apple (AAPL)'s beat of $12 billion in revenue was larger than the annual revenue for 2/3 of the S&P 500 companies. The buyback was a remarkable $90 billion... Read More
ChartWatchers April 30, 2021 at 06:47 PM
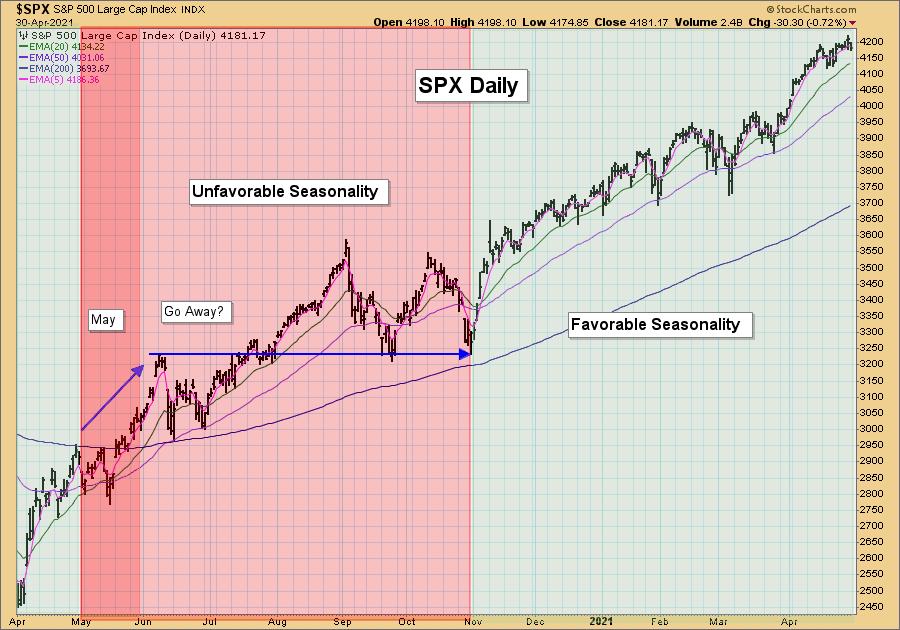
We've all heard the saying, "Sell in May and Go Away." This describes a phenomena that implies that investors, in preparation for summer, will sell in May and then take a break from the market over the summer... Read More
ChartWatchers April 30, 2021 at 06:35 PM
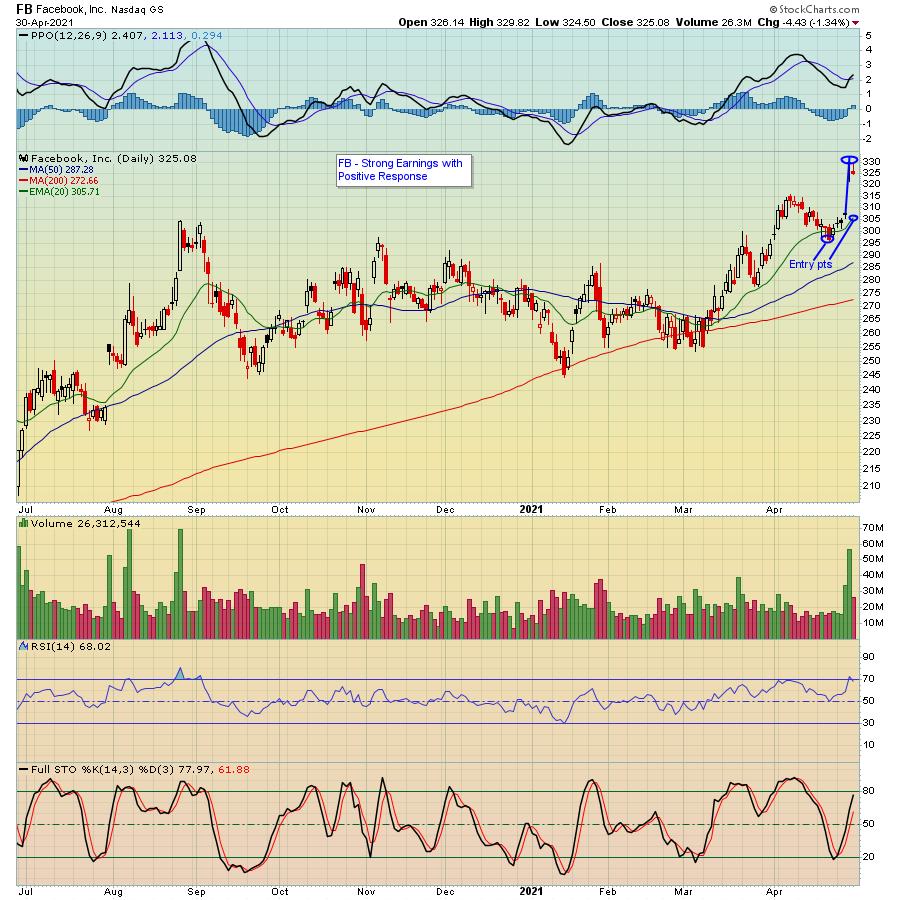
Last week was chock-full of blockbuster earnings reports, including AAPL, AMZN, FB, GOOGL and MSFT. Together, those five companies have a combined market cap of over $8 trillion... Read More
ChartWatchers April 30, 2021 at 05:21 PM
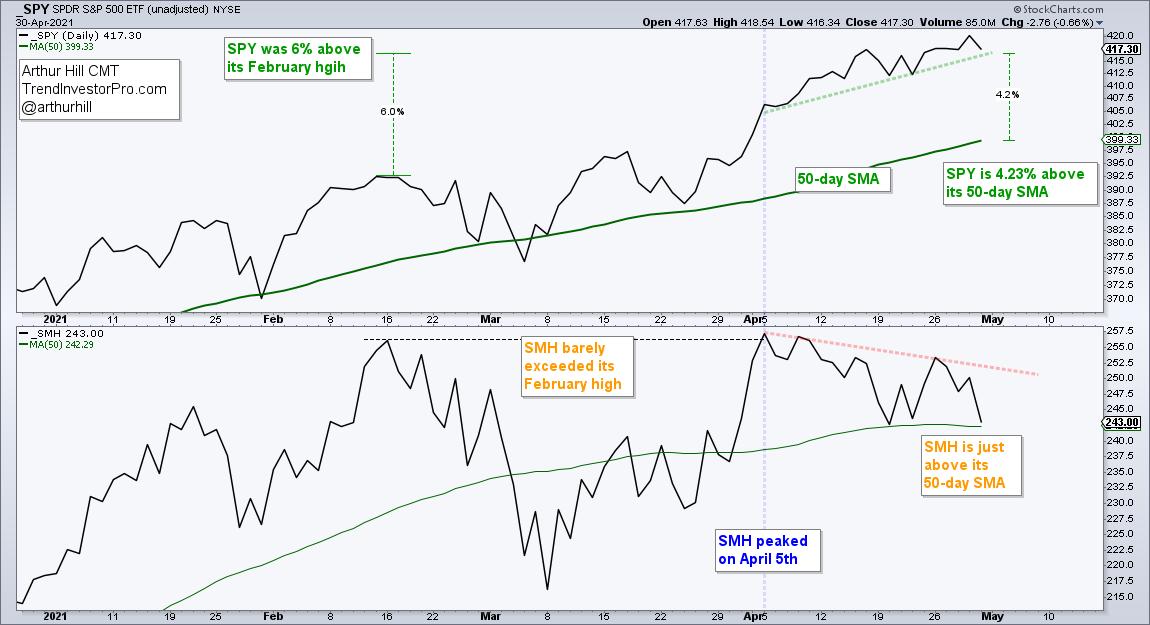
The long-term trend for the Semiconductor ETF (SMH) remains up, but the ETF is coming under some selling pressure and underperforming the broader market. While this is not enough reason to turn long-term bearish, it does increase the odds of corrective period in the coming weeks... Read More
ChartWatchers April 23, 2021 at 10:13 PM
Over the long haul, earnings and Fed policy have more to do with stock market direction than anything. Focus on these two and you'll be just fine. Tune everything else OUT. President Biden's possible tax hike on capital gains was a problem..... for an hour on Thursday... Read More
ChartWatchers April 23, 2021 at 08:28 PM
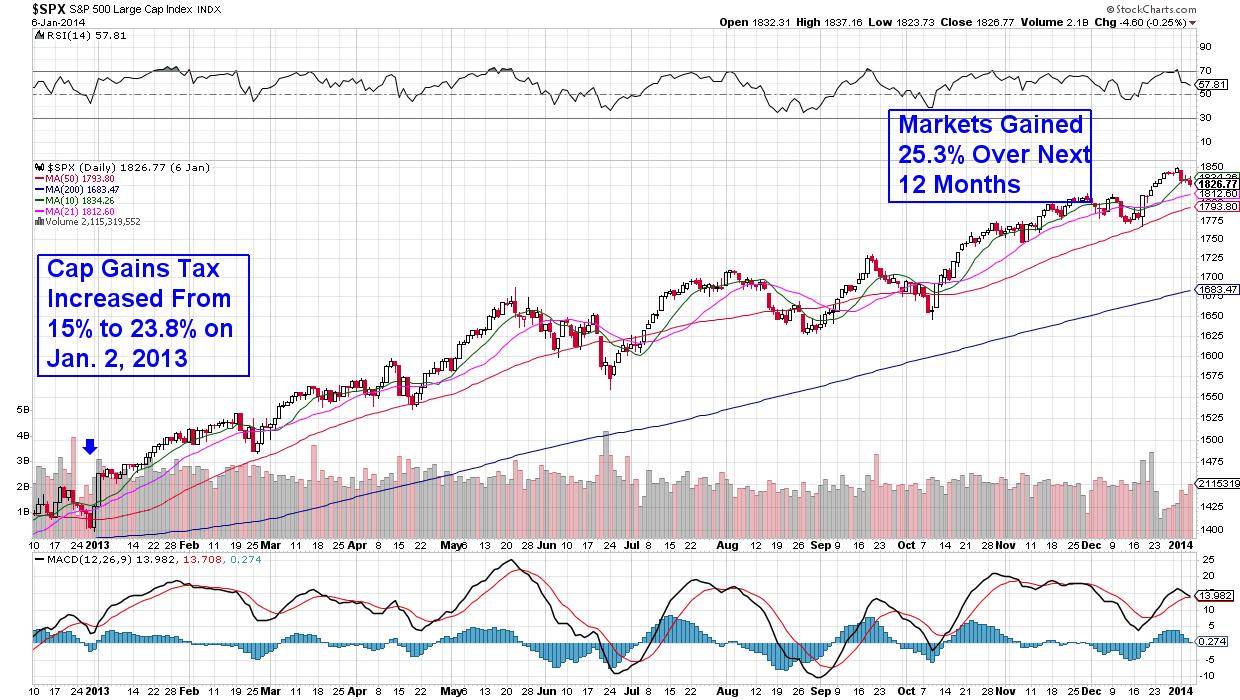
Next week, in a speech to Congress, Biden is likely to detail the tax plan he outlined during his campaign. Reports suggest that the capital-gains tax rate on people earning more than $1 million a year would increase from 20% to 39.6%... Read More
ChartWatchers April 23, 2021 at 07:30 PM
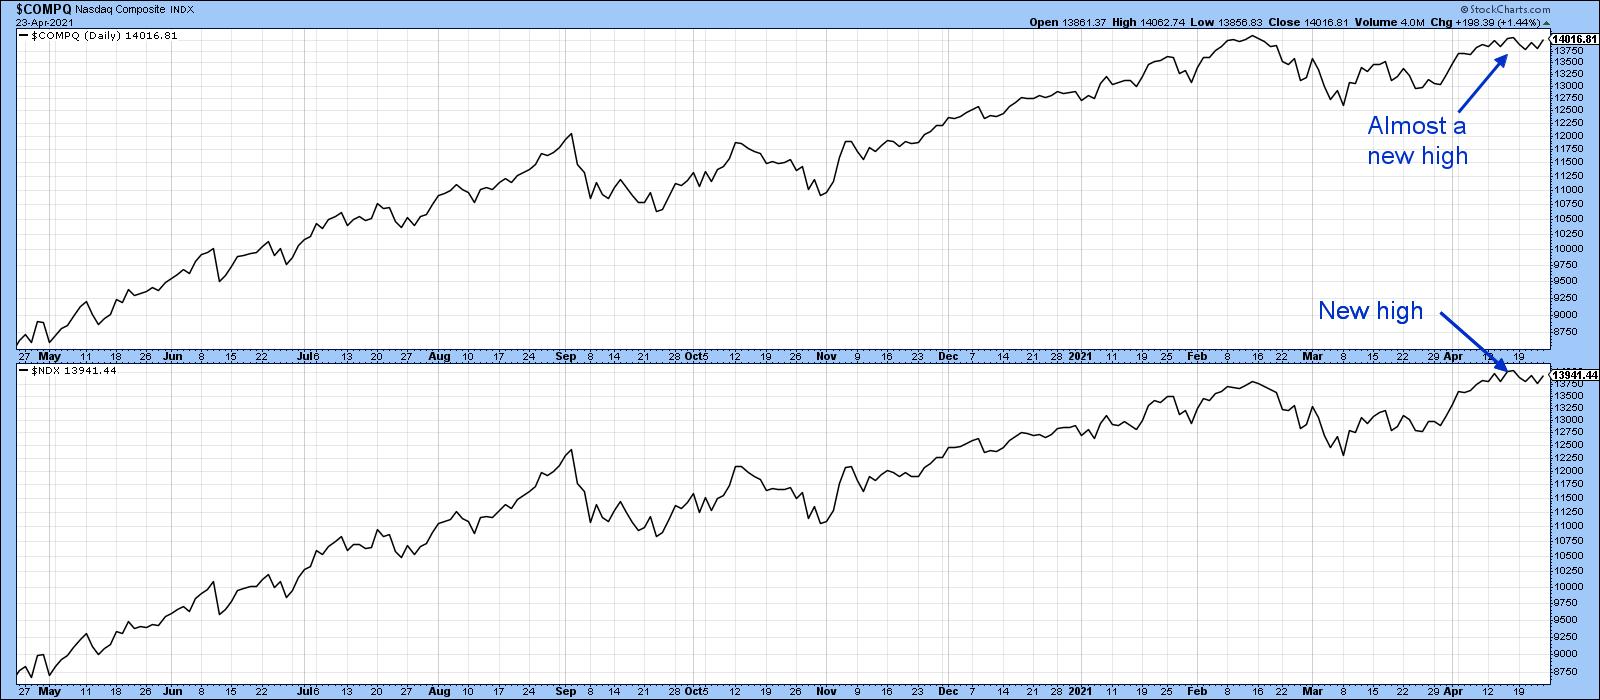
The NASDAQ Composite peaked on February 16, sold off and subsequently rallied back to the February high last week. Chart 1 shows that it just missed the earlier peak by a smidgen, whereas the NASDAQ 100 (in the lower window) did marginally take out its February high... Read More
ChartWatchers April 23, 2021 at 05:18 PM
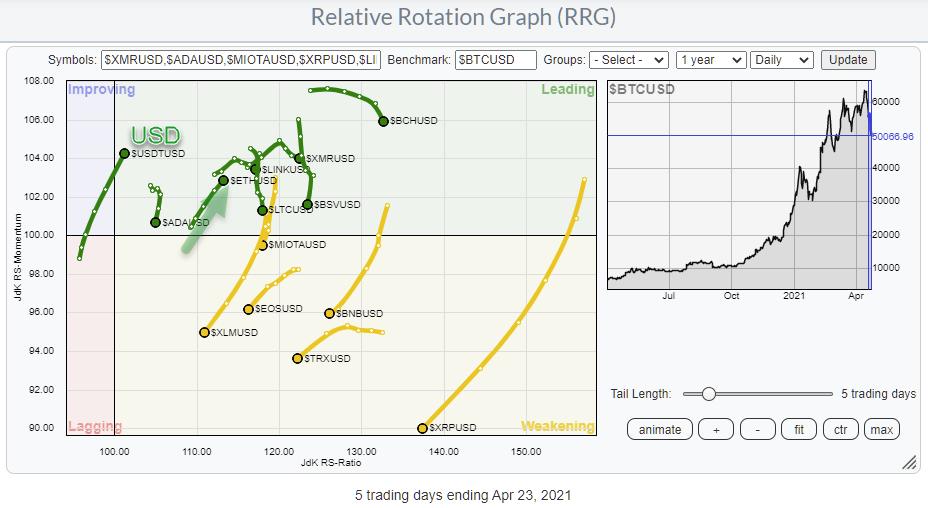
Another wild ride in crypto space this week. Bitcoin dropped almost 10% in value against the US Dollar in the past five days, while market darling DOGE lost a whopping 27%, as did TRON, Bitcoin SV, EOS and a few other major coins... Read More
ChartWatchers April 23, 2021 at 04:32 PM
It's been a heavy earnings week, with many stocks gapping higher or lower based on investors' reactions to their quarterly results... Read More
ChartWatchers April 16, 2021 at 10:12 PM
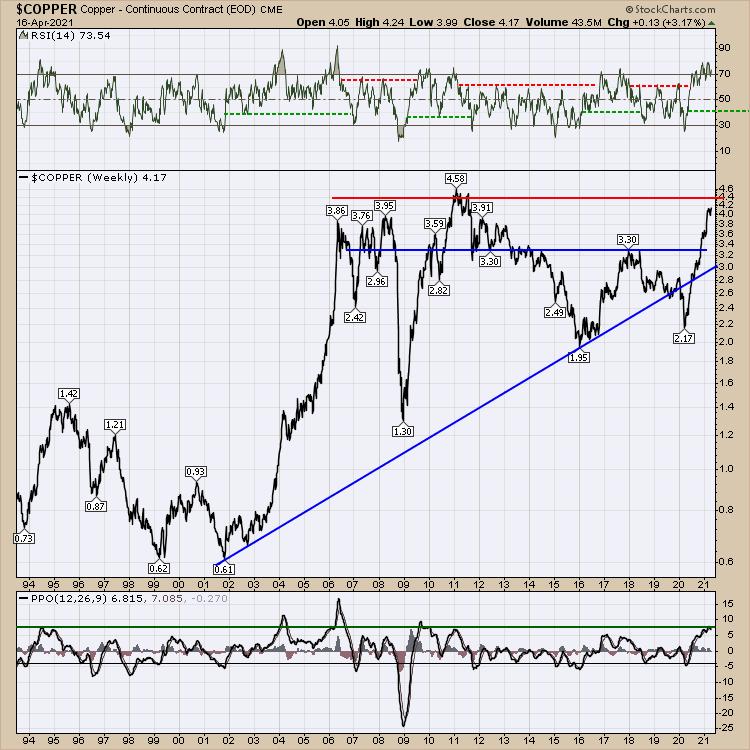
I think we all know Copper is the fundamental metal for all of the green plans globally. Lately, Copper has been wandering sideways close to all-time highs. This chart below shows the last 25 years. The price has consolidated for 8 weeks... Read More
ChartWatchers April 16, 2021 at 06:55 PM
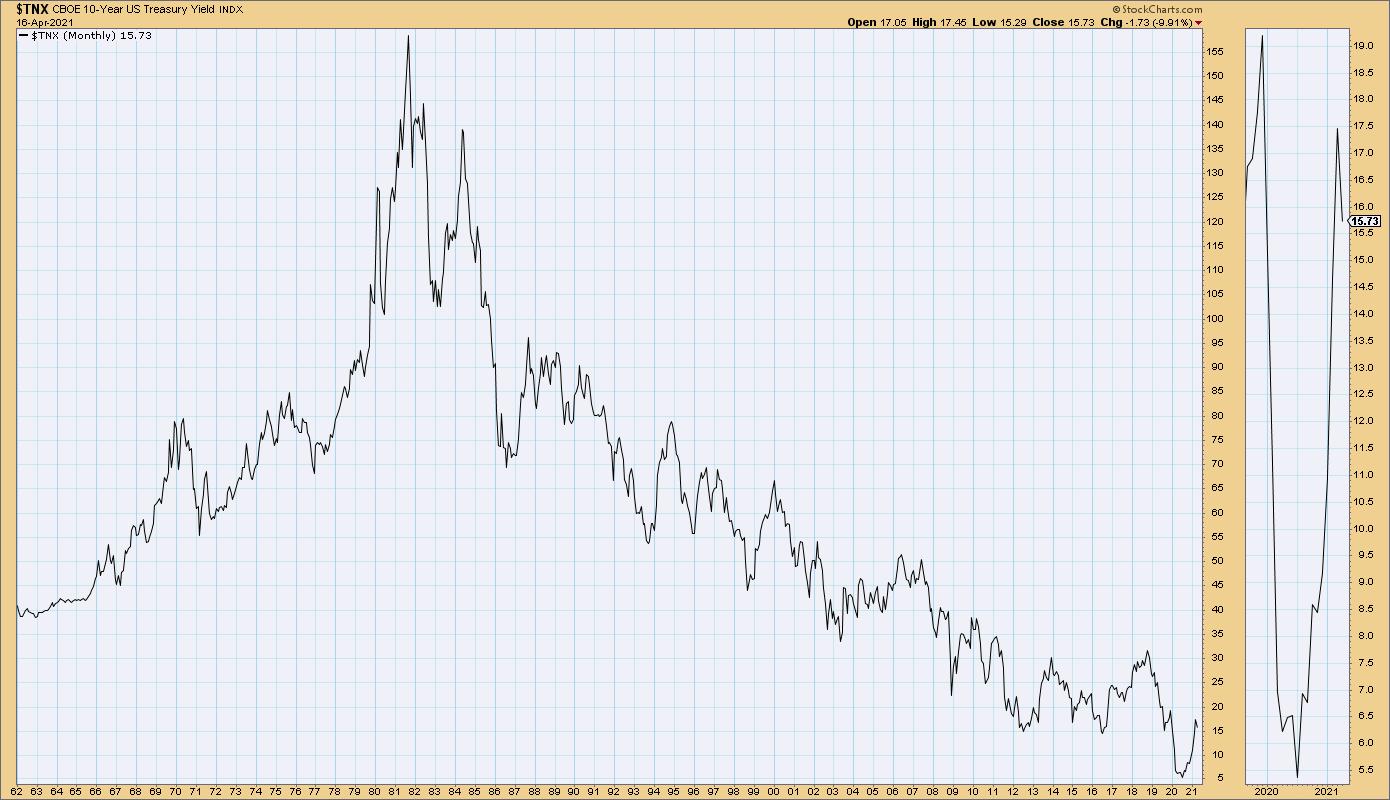
Over the last six weeks, we've seen a dramatic reversal from a rising rate environment to a falling rate environment... Read More
ChartWatchers April 16, 2021 at 06:15 PM

I previously talked about Energy (XLE) being at a possible pivot point on Tuesday. It rallied strongly, leaving us with many potential choices for possible trades. Given the breakout in Crude Oil, one of the charts that I was drawn to on Wednesday was Natural Gas (UNG)... Read More
ChartWatchers April 16, 2021 at 04:49 PM
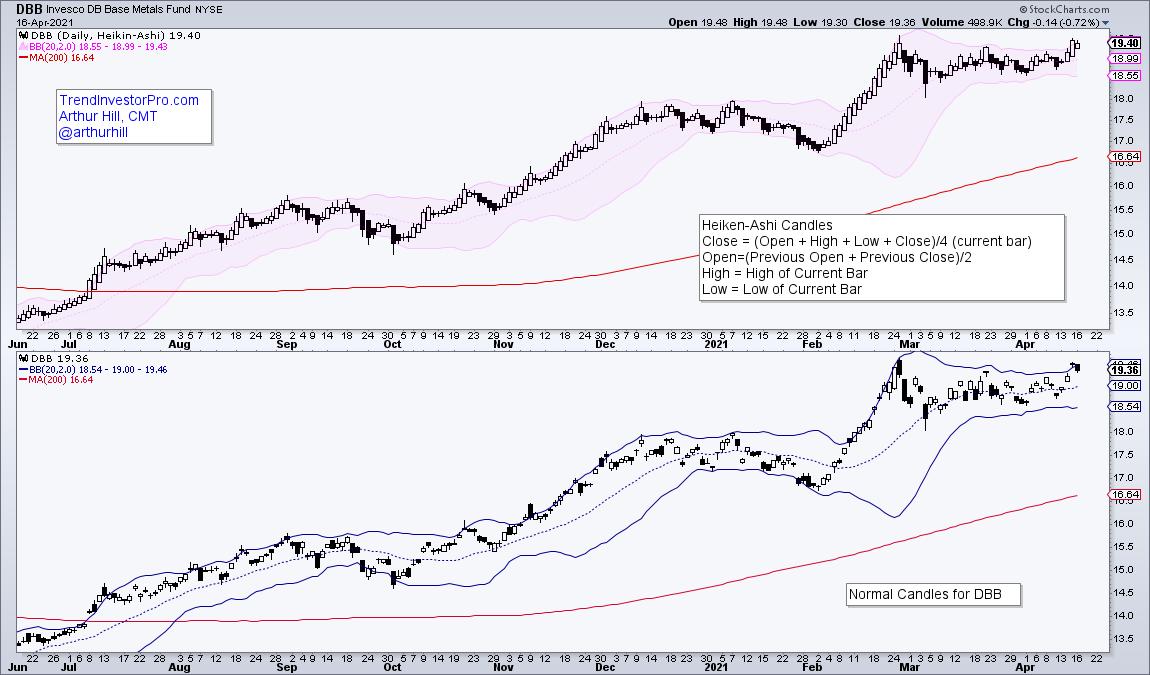
The DB Base Metals ETF (DBB) is breaking out of a bullish continuation pattern after a Bollinger Band squeeze and this signals a continuation of the long-term uptrend... Read More
ChartWatchers April 16, 2021 at 03:35 PM
Some traders focus all of their time, capital and attention on individual stocks. This can be a double-edged sword. On the one hand, focusing on individual stocks can produce outsized gains... Read More
ChartWatchers April 10, 2021 at 12:22 AM
Institutions have increased their cash balances by 9% since the beginning of this year*. This brings their total cash pile to $3 trillion, which represents lots of potential firepower for equity gains as this money gets put to work... Read More
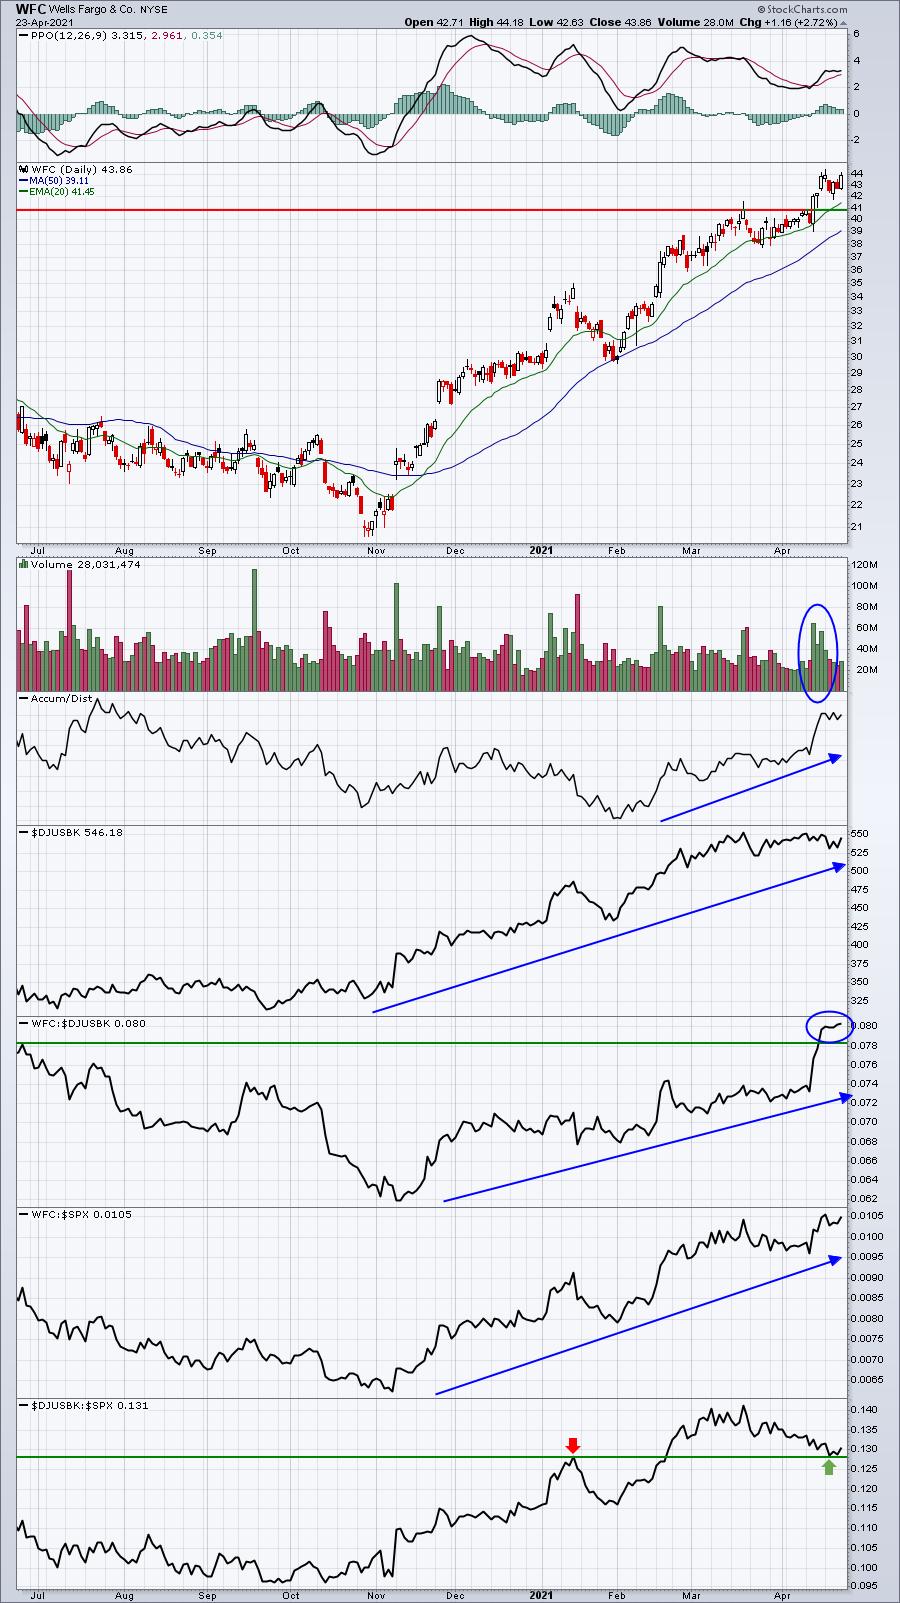
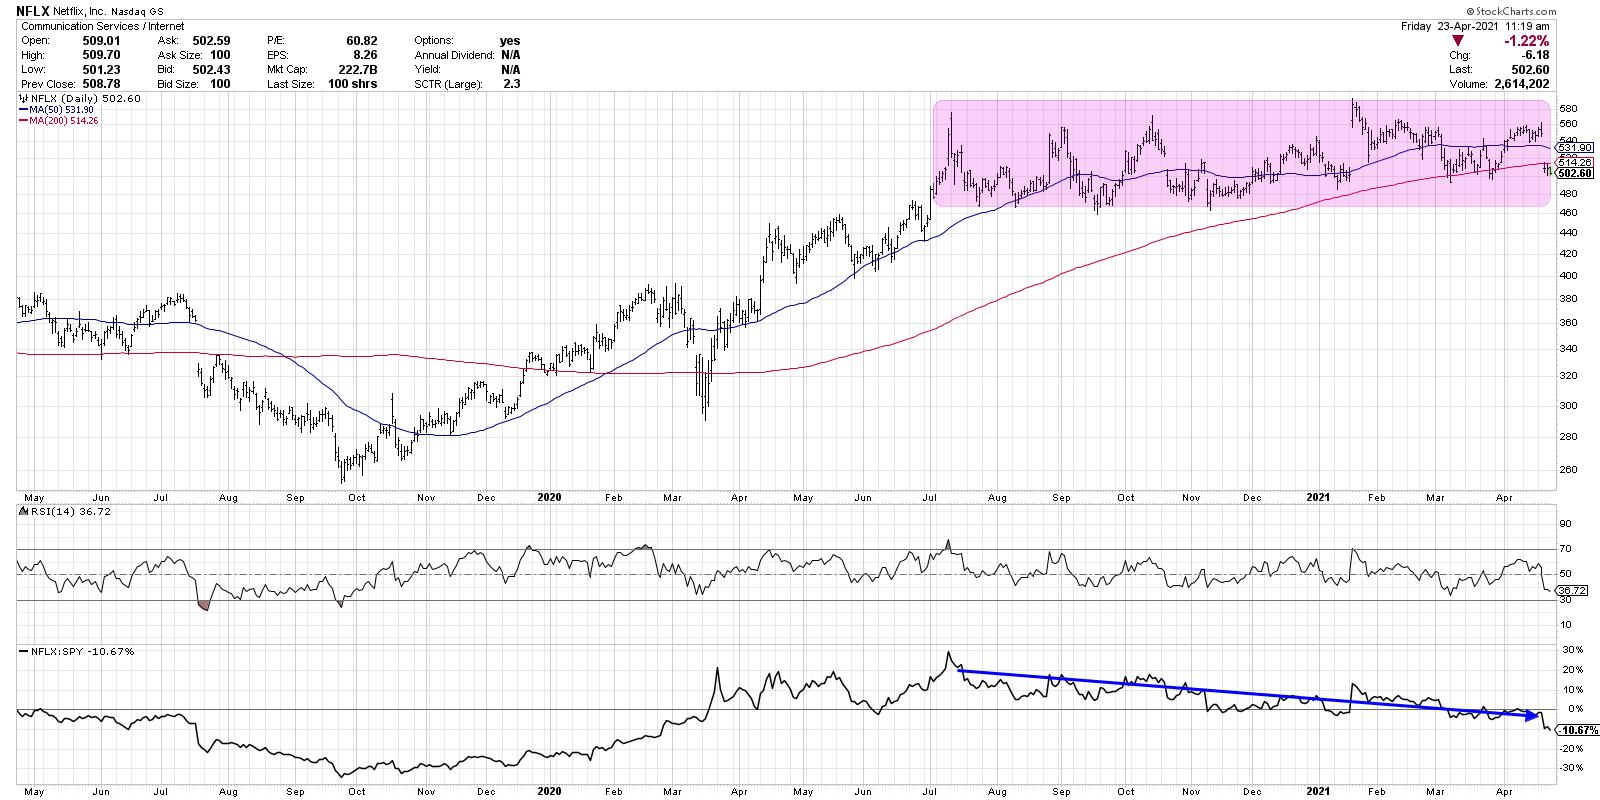
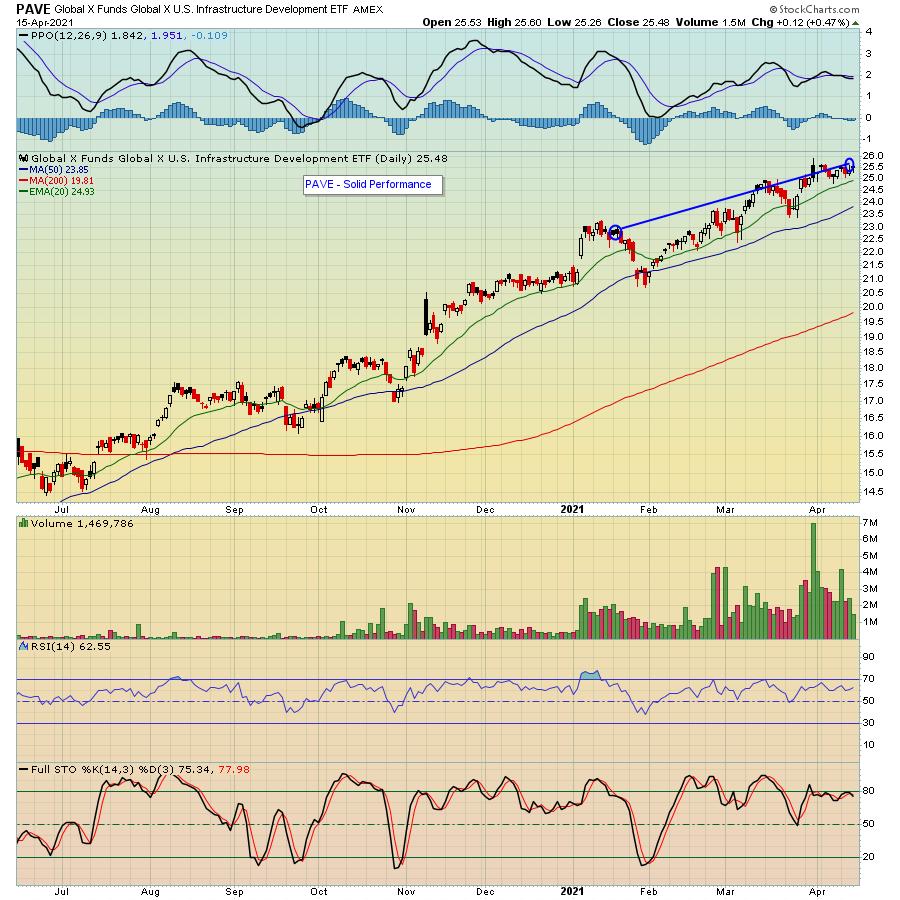
ChartWatchers April 09, 2021 at 09:01 PM
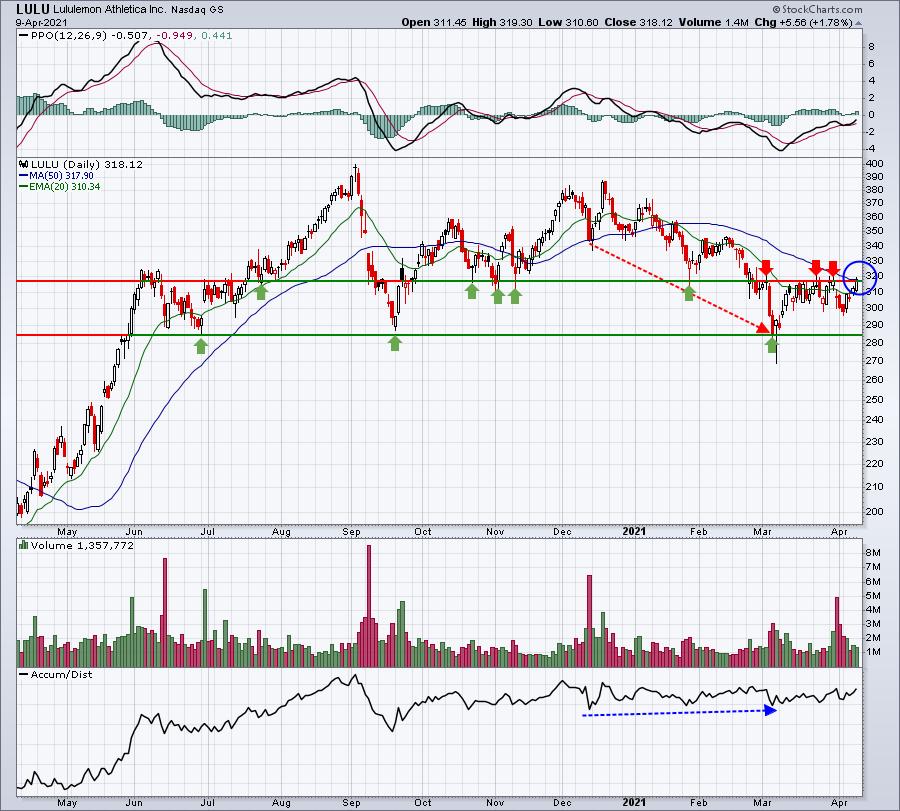
When I see a long-term winning stock sell off for a period of weeks, or even months, I always question the motive. If institutions want to buy a large position in a company, it takes time to do so. They don't simply put a market order in for 1 million shares... Read More
ChartWatchers April 09, 2021 at 06:53 PM
This past Thursday, I was one of the guest hosts to fill in for David Keller on The Final Bar, as Dave was enjoying a week off. Of course I brought RRG to the show, but I also wanted to add a bit of educational content on how to use RRG in a way that was somewhat outside the box... Read More
ChartWatchers April 02, 2021 at 11:08 PM
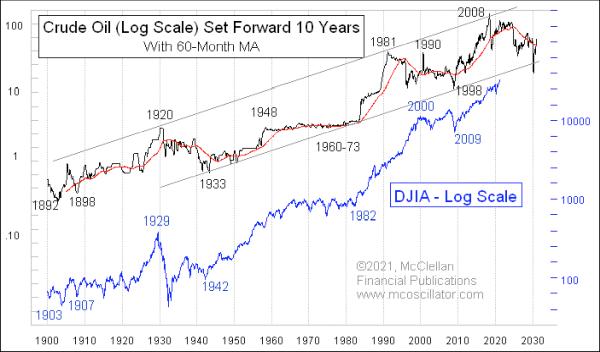
It is now officially April and, in past posts, I have noted that the leading indication message from crude has called for a stock market top due in April 2021. This should be the 10-year echo of the monthly closing price top in oil prices in April 2011... Read More
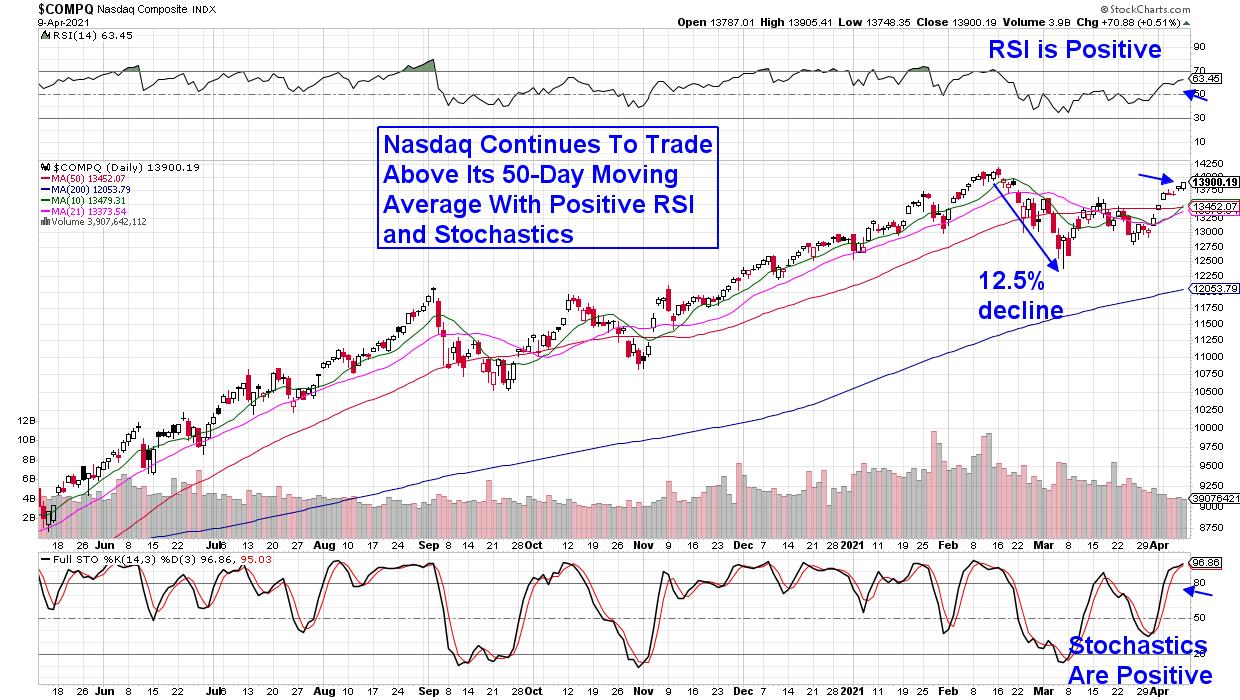
ChartWatchers April 02, 2021 at 06:38 PM
It has been 6 weeks since the February 12th market top on the $COMPQ. The $SPX and the $INDU have gone on to new highs, and some of the large caps are setting up in the sweet spot for me. That would add a lot of thrust to a second quarter rally... Read More
ChartWatchers April 02, 2021 at 06:27 PM
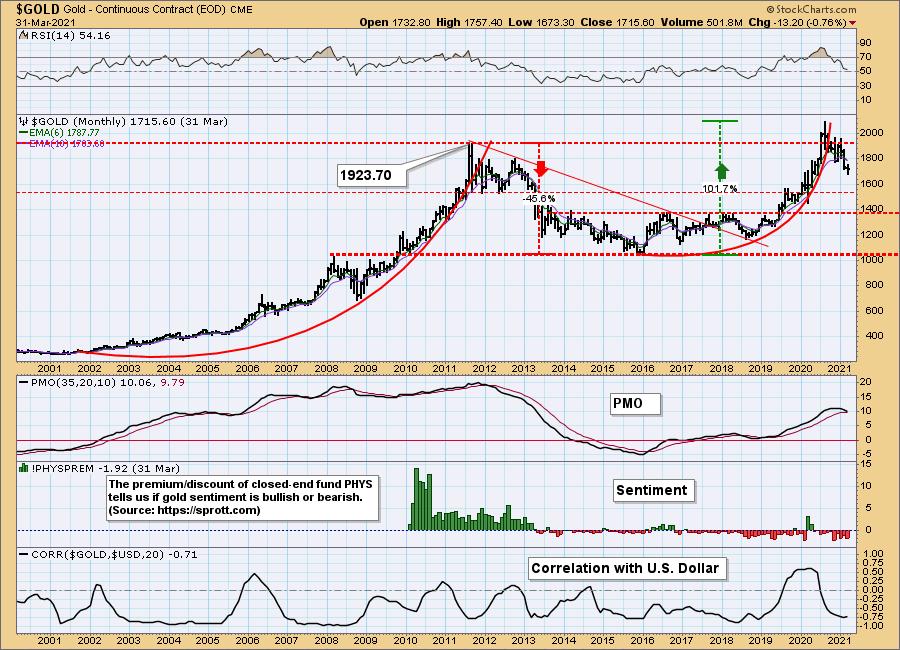
In today's "Diamond Mine" Trading Room (DP Diamonds subscribers only), I was asked if it was time to go long on Gold given its rally this week. Well, if we are talking about "longs," we should start at the monthly chart and work down to the daily chart... Read More
ChartWatchers April 02, 2021 at 03:55 PM
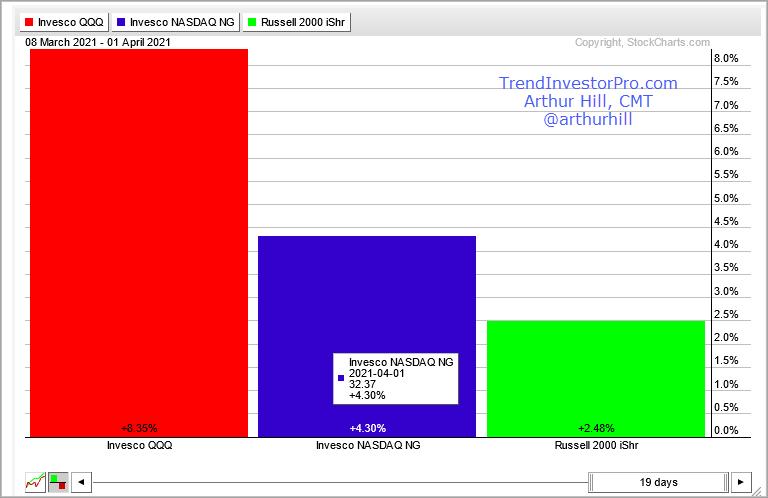
The Nasdaq 100 ETF (QQQ) represents the largest stocks in the Nasdaq and the Nasdaq 100 Next Gen ETF (QQQJ) covers the next 100 (101 to 200). Stocks at the top of the latter group are knocking on the door and trying to fatten up for inclusion into the legendary QQQ... Read More
ChartWatchers April 02, 2021 at 10:14 AM
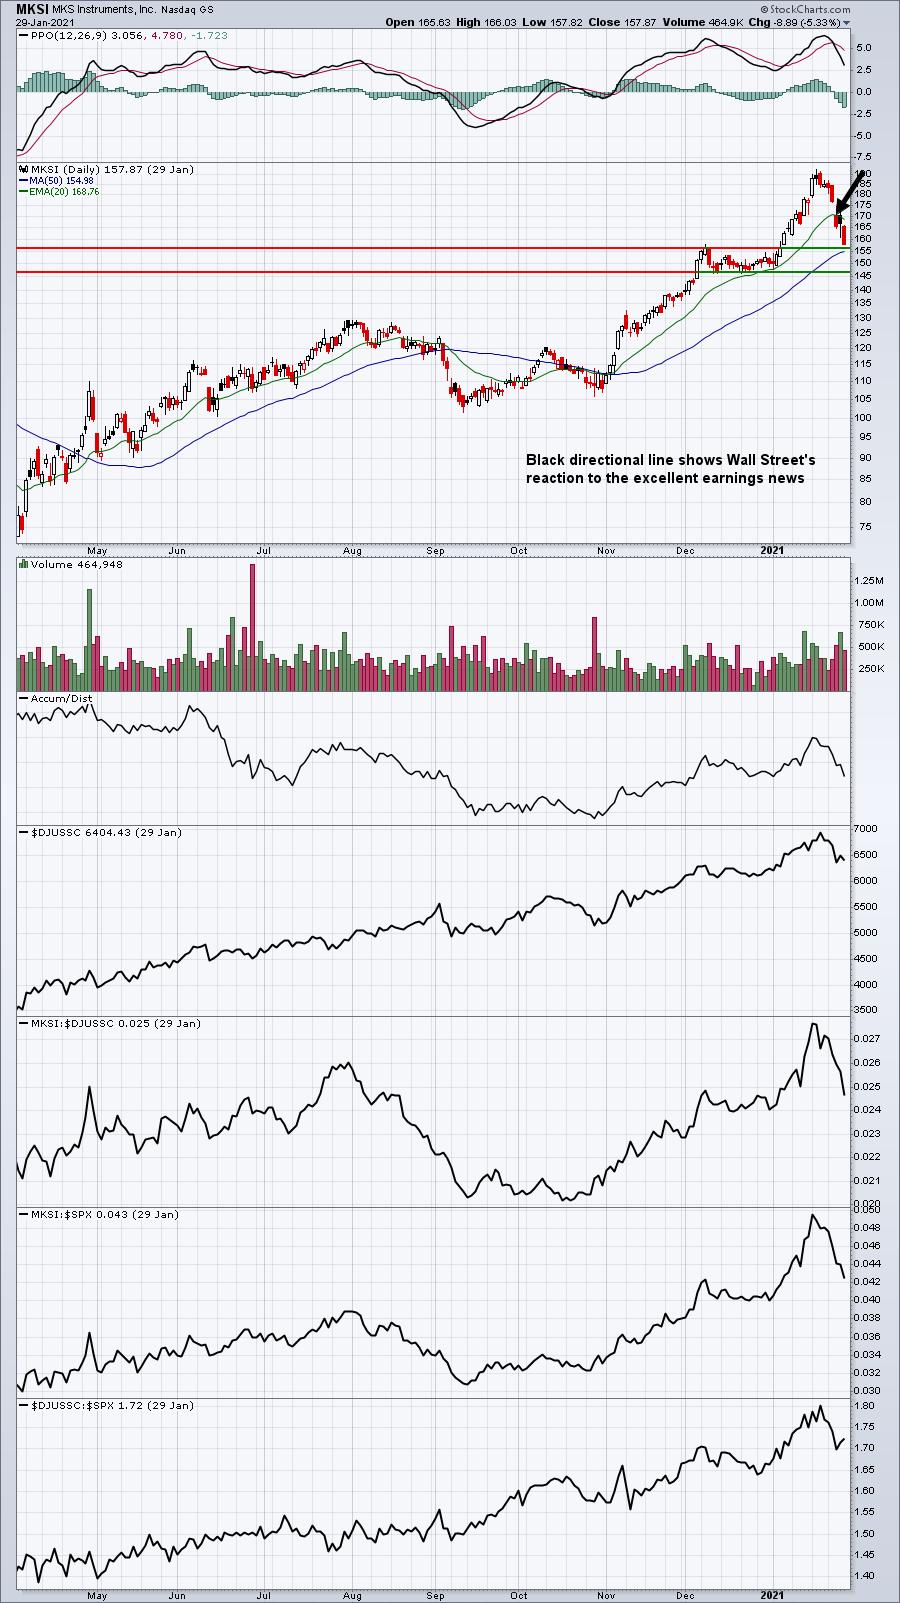
I love earnings season. Perhaps it's the CPA inside of me, having practiced in public accounting for a couple decades. Maybe it's the excitement of new fundamental information being released that alters the valuation of companies... Read More