ChartWatchers August 28, 2021 at 12:07 AM
Last week was an eventful period for the markets, as two highly impactful news items converged in a perfect storm that could push the markets higher over the near-term and beyond. At the beginning of the week, Pfizer's COVID-19 vaccine was fully approved by the FDA... Read More
ChartWatchers August 27, 2021 at 08:35 PM
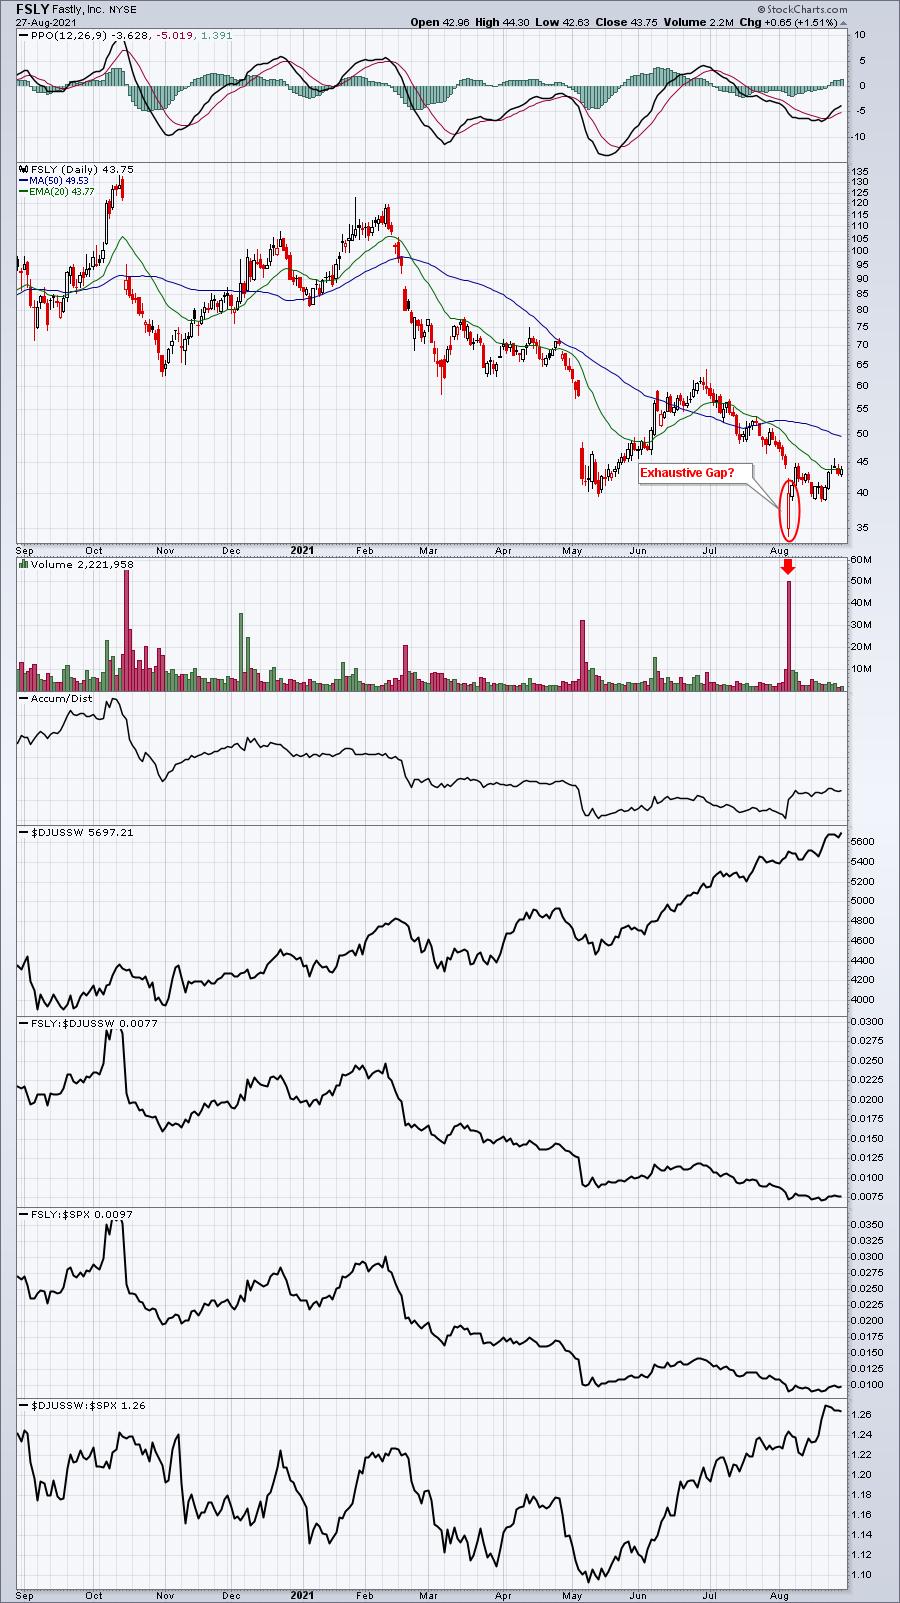
It wasn't too long ago that a $5 billion market cap company was considered a "mid-cap". But in today's mega-cap world of Apple (AAPL) and Microsoft (MSFT) sporting $2.46 trillion and $2.25 trillion market caps, respectively, $5 billion to them is spare change... Read More
ChartWatchers August 27, 2021 at 07:23 PM
This month marks exactly seven years ago that I started contributing to the StockCharts website, after Relative Rotation Graphs were added to the graphical toolbox in July 2014... Read More
ChartWatchers August 20, 2021 at 08:09 PM
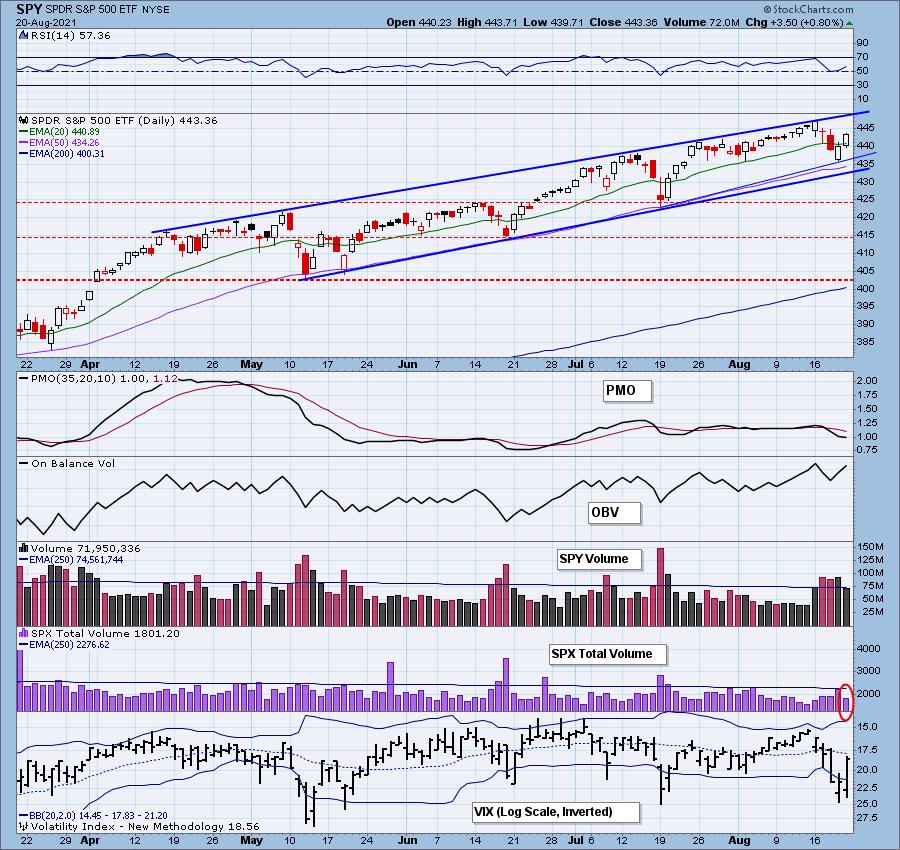
Today, we have a possible "upside exhaustion climax." We didn't get confirmation of the climax because Total Volume was so low today. This is a problem. Today was options expiration -- we should have seen more volume... Read More
ChartWatchers August 20, 2021 at 08:03 PM
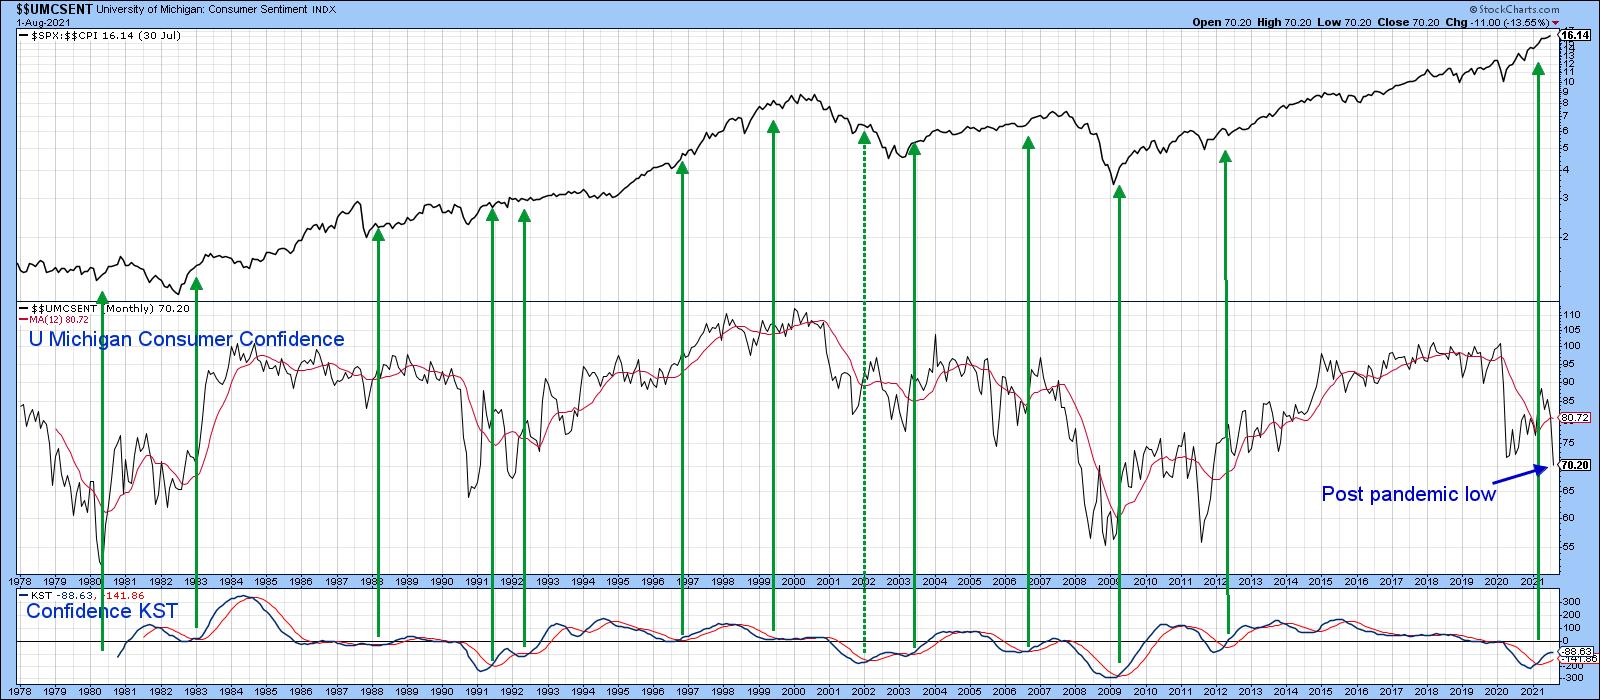
Last Friday (August 13), the University of Michigan released the initial August response to their consumer sentiment survey. A sharp 13.5% retreat was recorded. The Expectations Index fared even worse, with a 17.5% drop... Read More
ChartWatchers August 20, 2021 at 07:53 PM
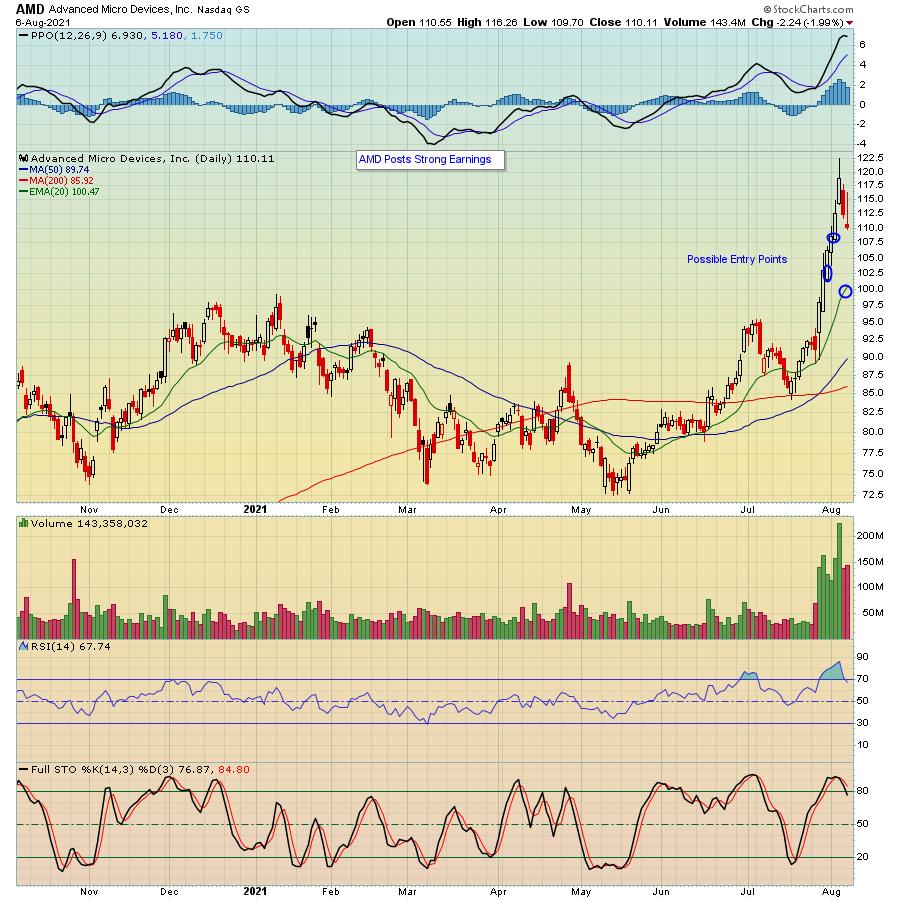
In my last ChartWatchers article, I discussed ways to profit from the terrific earnings season that we just experienced. So many companies put up solid numbers which led to the market reaching an all-time high... Read More
ChartWatchers August 20, 2021 at 05:47 PM
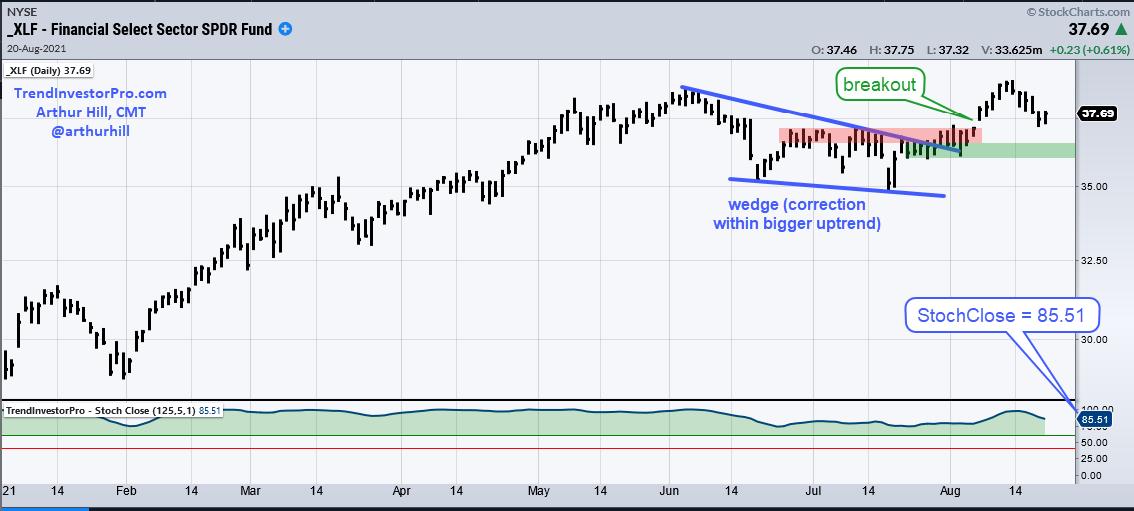
The Finance SPDR (XLF) is one of the leading sectors and recently broke out of a falling wedge correction. There was a little throwback this week, but the breakout is holding and remains bullish until proven otherwise. Let's see what it would take to prove otherwise... Read More
ChartWatchers August 20, 2021 at 12:52 PM

The auto stocks have been in the news for the allure of everyone driving electric vehicles. A year ago, I started writing about the electric car theme and the race to lead... Read More
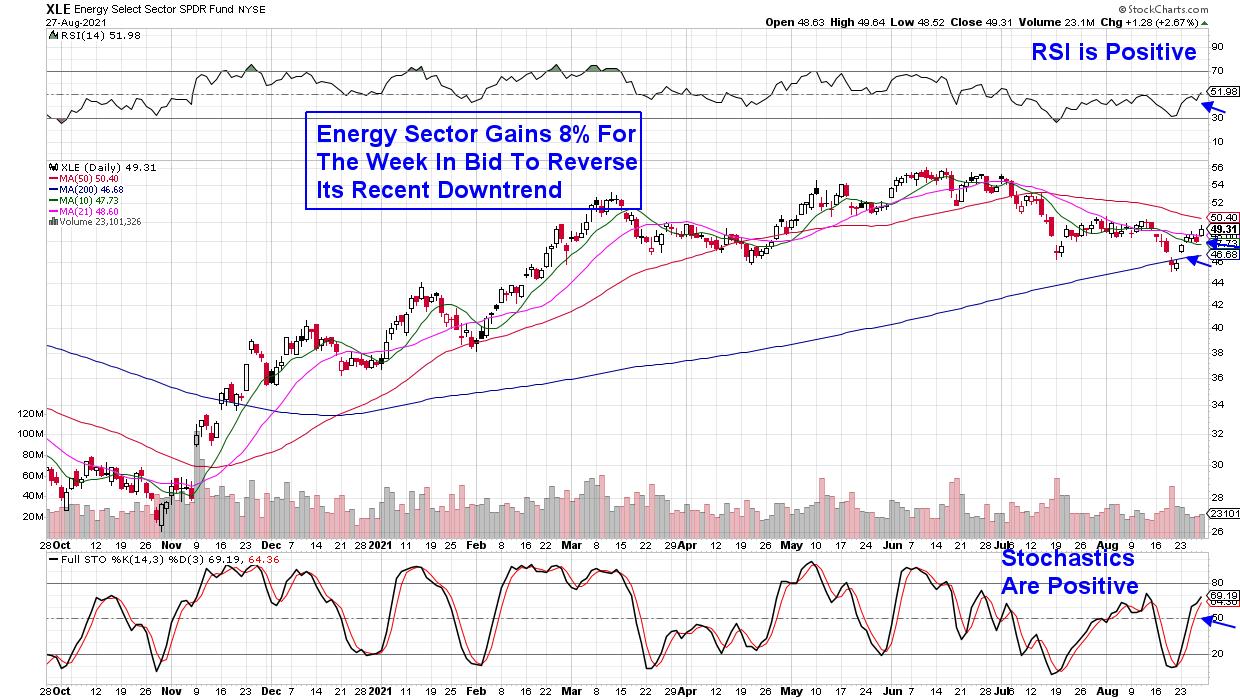
ChartWatchers August 13, 2021 at 10:39 PM
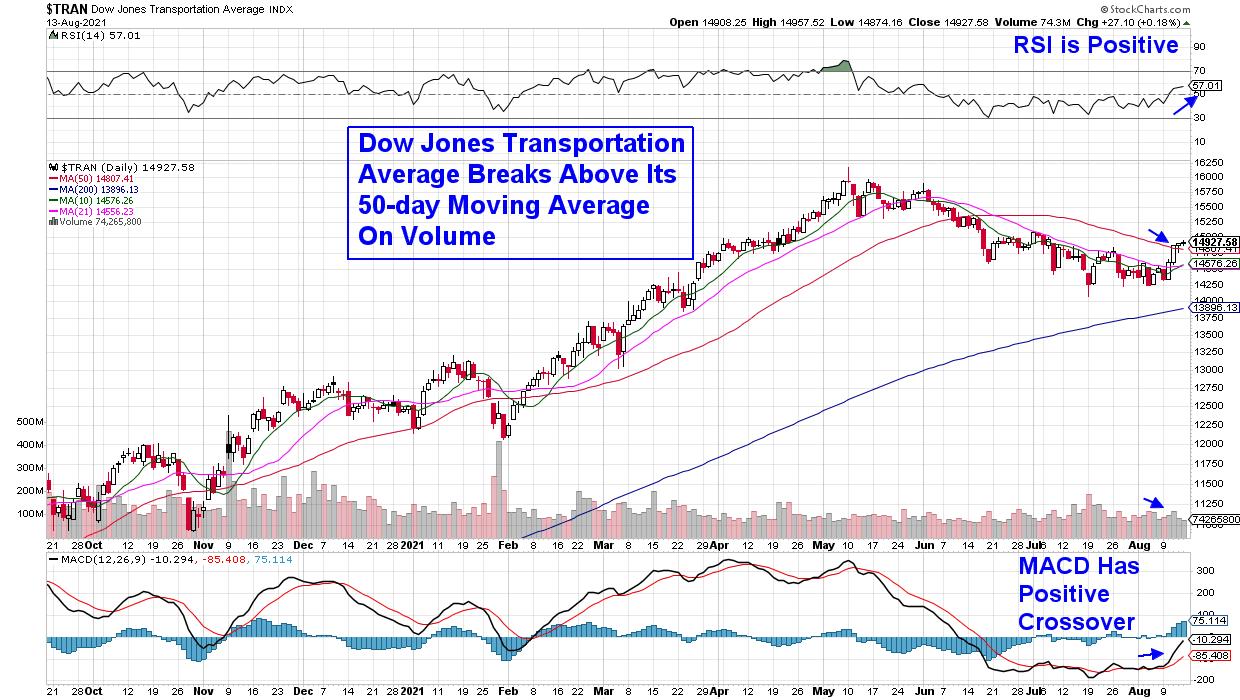
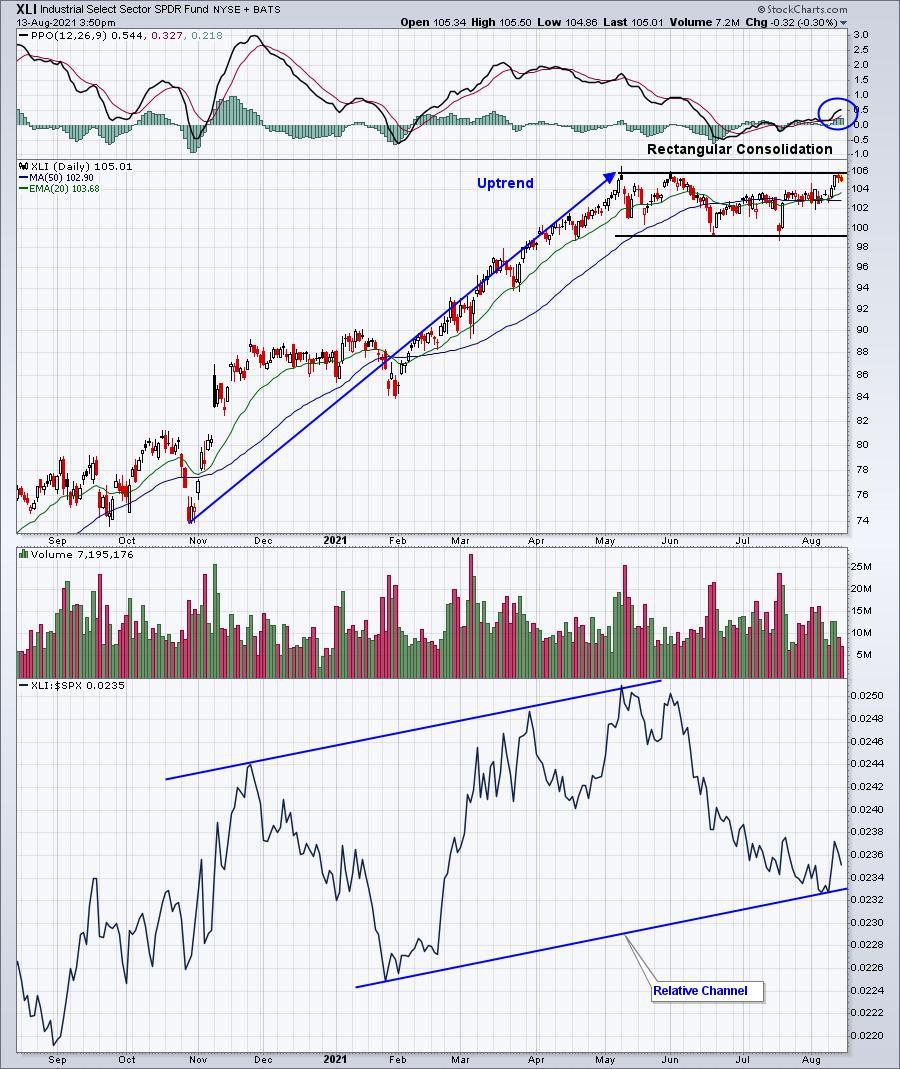
The broader markets are at a very positive juncture as recently leading areas are holding their gains while newer areas are coming into their own after reversing their downtrends... Read More
ChartWatchers August 13, 2021 at 10:06 PM
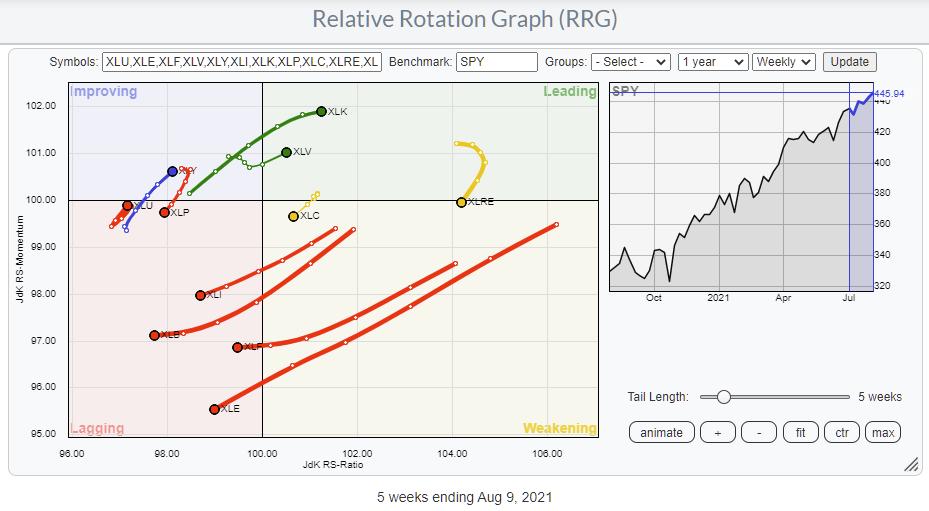
Relative Rotation Graphs are a great tool to use for a top-down approach. Lots of people look at sectors and trade the sector ETFs. The State Street sector SPDRs range (XLK, XLY, XLP, etc.) is probably the most popular family of ETFs for that purpose... Read More
ChartWatchers August 13, 2021 at 04:07 PM
Rotation is nothing new during secular bull markets; it's actually what drives bull markets. Rather than money leaving the stock market for another asset class when leading sectors sell off, it simply moves from one sector to another sector... Read More
ChartWatchers August 06, 2021 at 07:06 PM
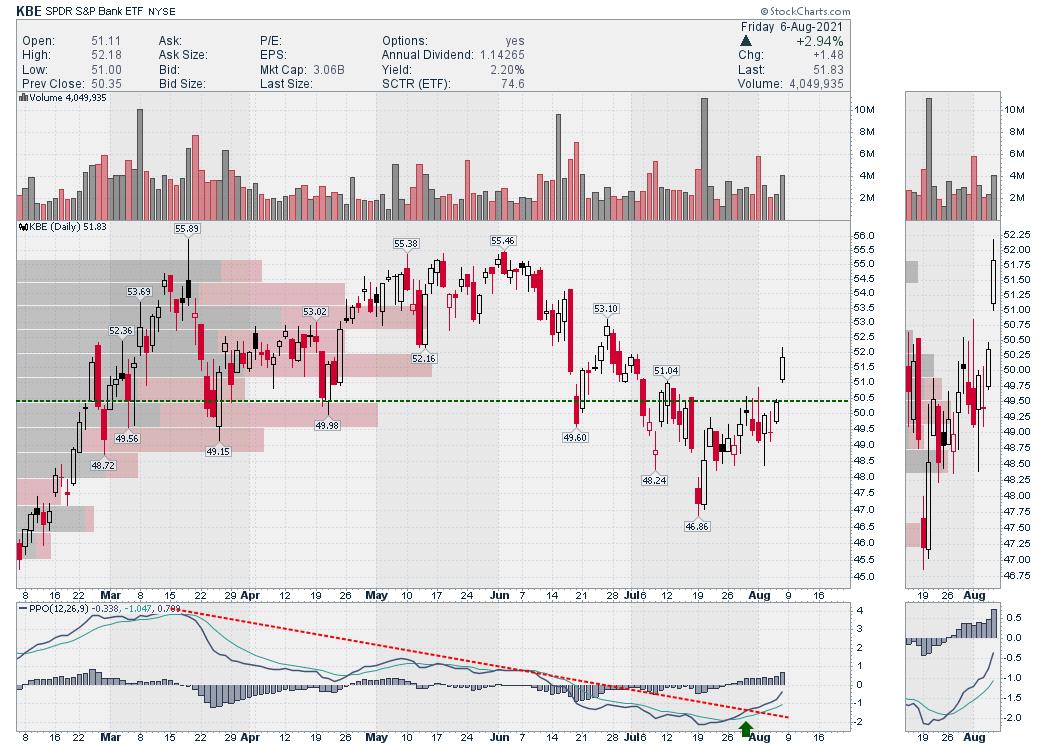
With the US jobs report coming in this morning, bond yields rallied while banks and insurance companies popped out of the funk they have been in. The bank ETF is a good example... Read More
ChartWatchers August 06, 2021 at 06:55 PM

Q2 Earnings season is winding down and, based on the record highs on all of the major indexes this past week, traders liked what they heard and saw... Read More
ChartWatchers August 06, 2021 at 02:58 PM
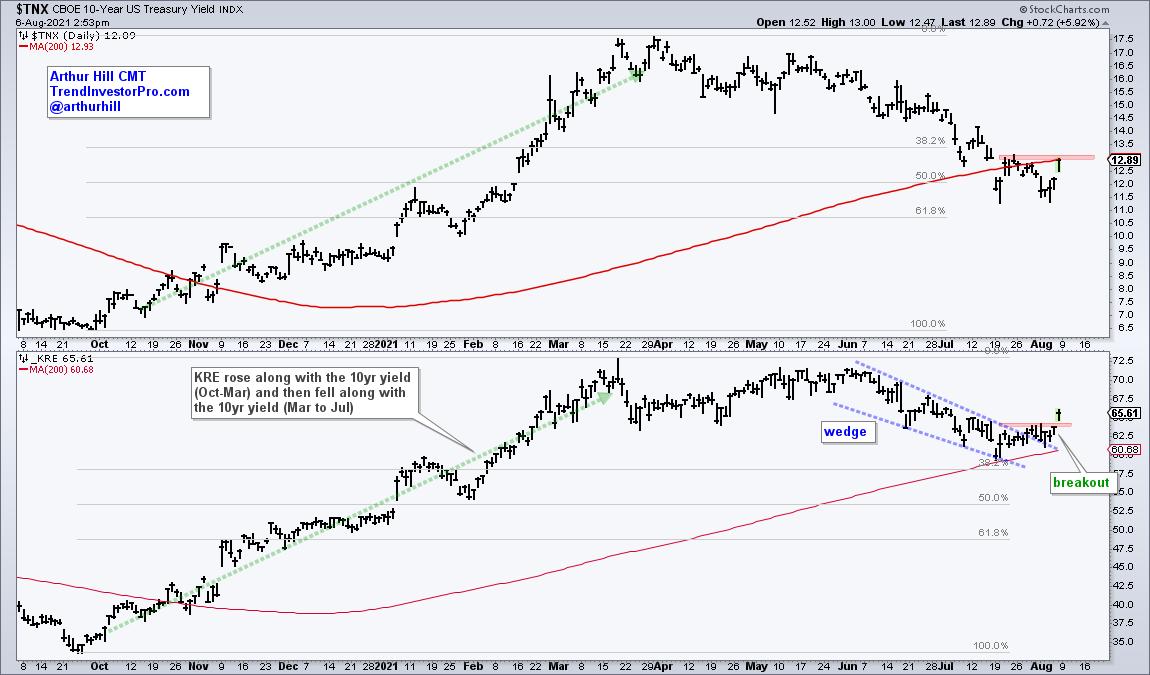
The Regional Bank ETF (KRE) and the 10-yr Treasury Yield are positively correlated and the recent surge in the 10-yr yield led to a breakout in the Regional Bank ETF. More importantly, this breakout signals an end to a corrective period and a resumption of the bigger uptrend... Read More
ChartWatchers August 06, 2021 at 12:11 PM
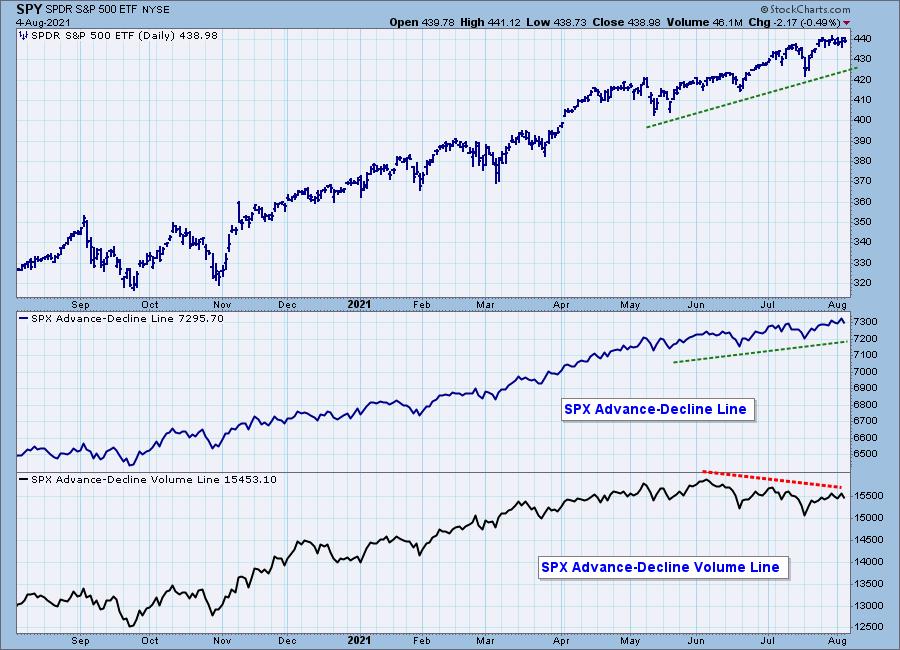
The other day, I was looking at the S&P 500 version of the Advance-Decline (A-D) Line, which tracks the cumulative daily advances minus declines for the SPX components... Read More