Commodities Countdown December 30, 2015 at 10:24 AM
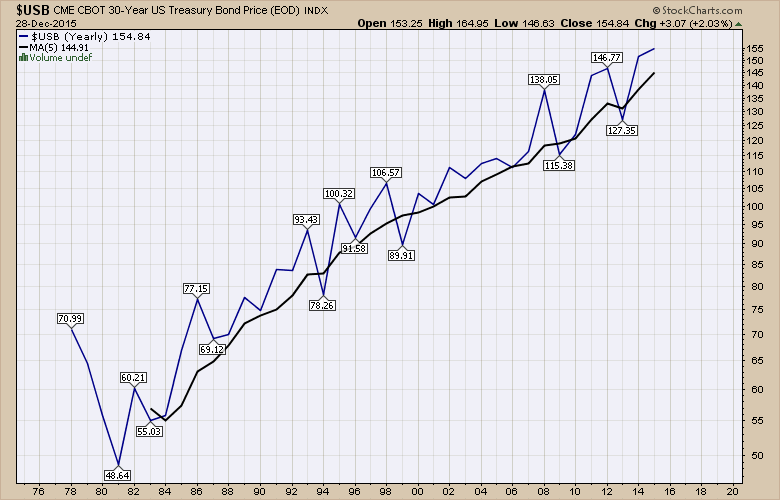
Here are some long-term charts from the webinar on Christmas Eve. First of all the Thirty Year Bond Price ($USB). It appears to be closing out the year at higher highs. 2014 closed out and all the analysts were convinced that was the final high and you should move out of bonds... Read More
Commodities Countdown December 20, 2015 at 03:46 PM
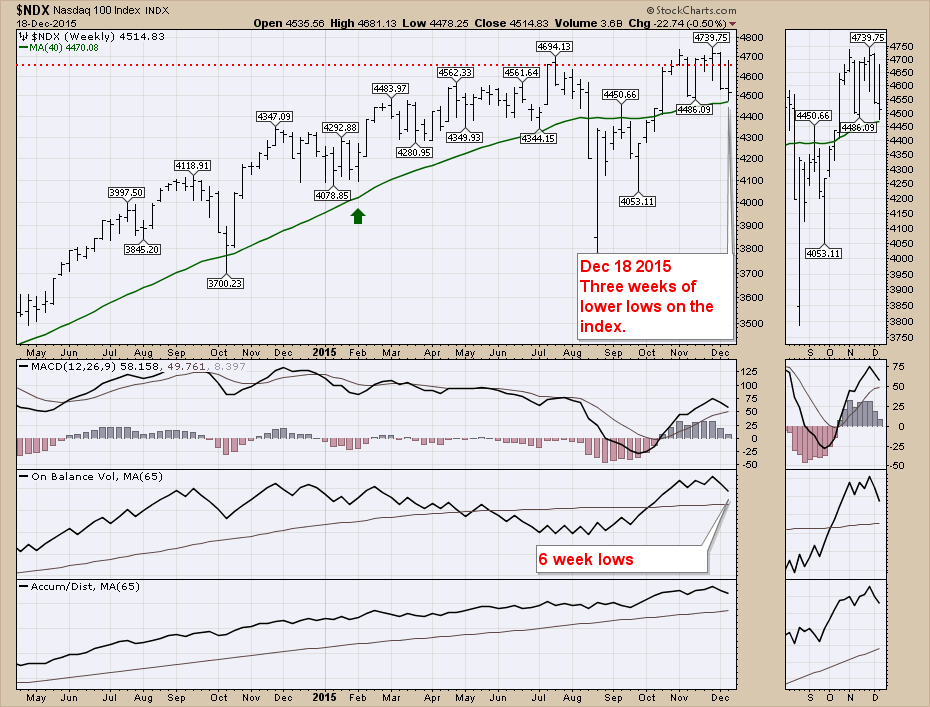
Investors had a tough week making money on the long side this week. Most of these charts are from the Commodities Countdown Webinar of 20151217. We closed just under last weeks' lows, but we went a long way up and gave it all back. This is the Nasdaq 100 ($NDX)... Read More
Commodities Countdown December 16, 2015 at 06:45 PM
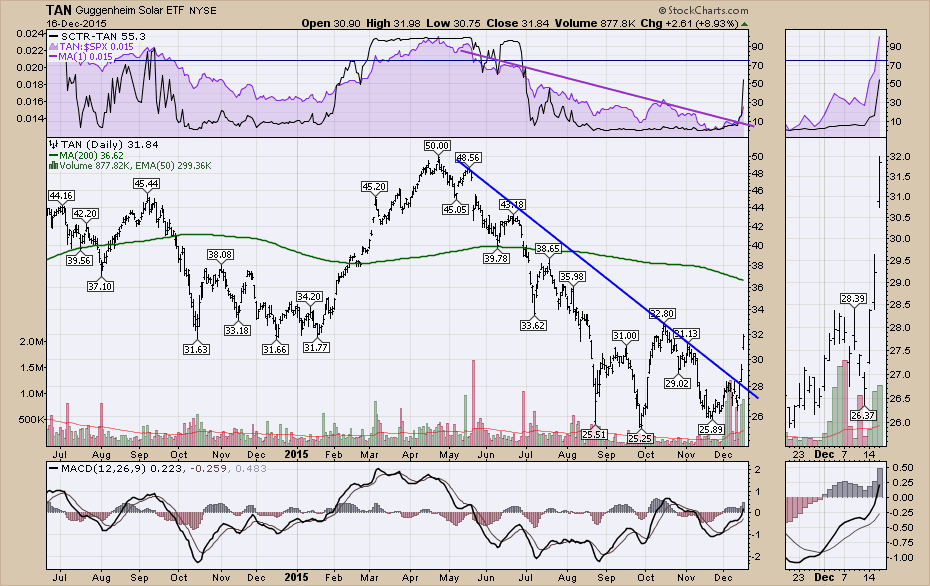
Solar stocks had an emotional outbreak across the industry group today. While the big move occurred on Fed Day, it was not because of Janet Yellen's presser. The TAN ETF represents a basket of solar-related stocks... Read More
Commodities Countdown December 14, 2015 at 12:21 PM
Thursday's webinar was bearish and Friday continued the theme. Here are some of the charts from that webinar series. $NATGAS made fresh 13 year lows this morning. Price shot below previous lows, taking out stops down there. Bottom pickers may be interested in shopping there... Read More
Commodities Countdown December 07, 2015 at 09:30 PM
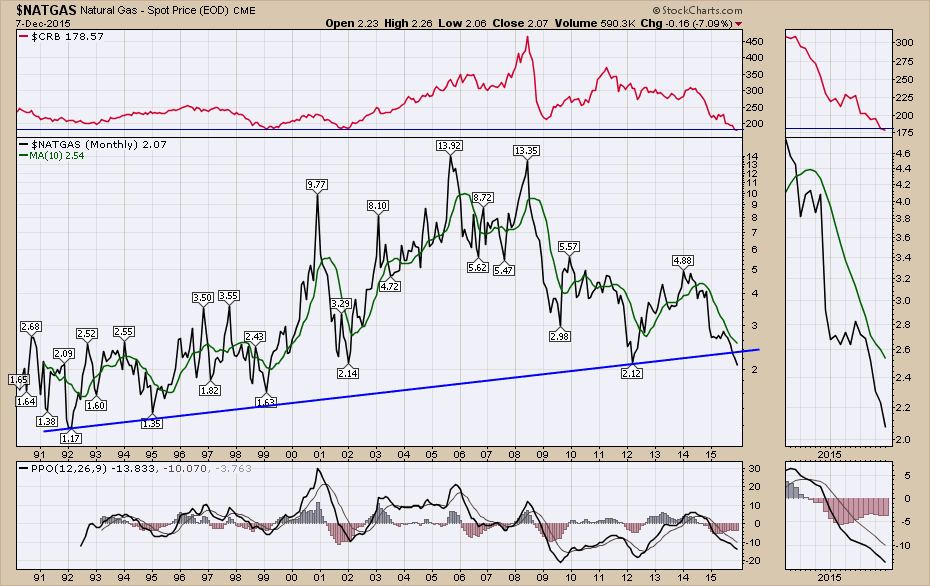
Investors in energy continue to find more downside pressure. The monthly chart for Natural Gas has been broken. Currently, the chart continues to press the bottom right-hand corner. The 10-month moving average is at $2.54, which is a dramatic change from the ~$4.00 level of 2014... Read More
Commodities Countdown December 03, 2015 at 09:03 AM
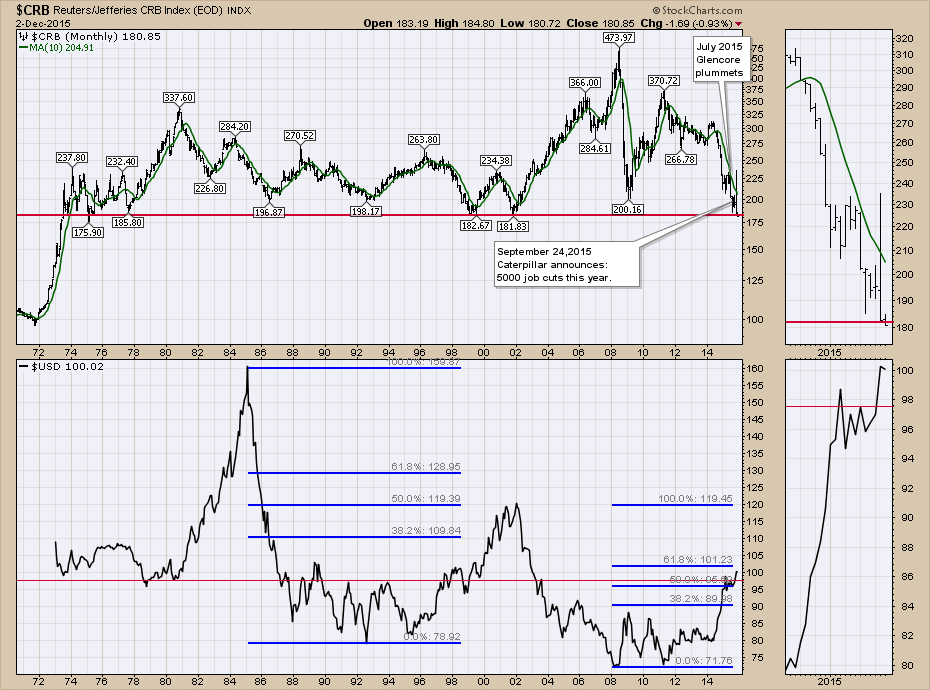
As I am living in Commodityville, Calgary, Canada, watching a 40-year trend line break on the $CRB could not be more disturbing. The previous intraday low was 181.83. Today we 'closed' at 180.85 and the intraday low was 180.72... Read More
Commodities Countdown December 02, 2015 at 01:55 PM
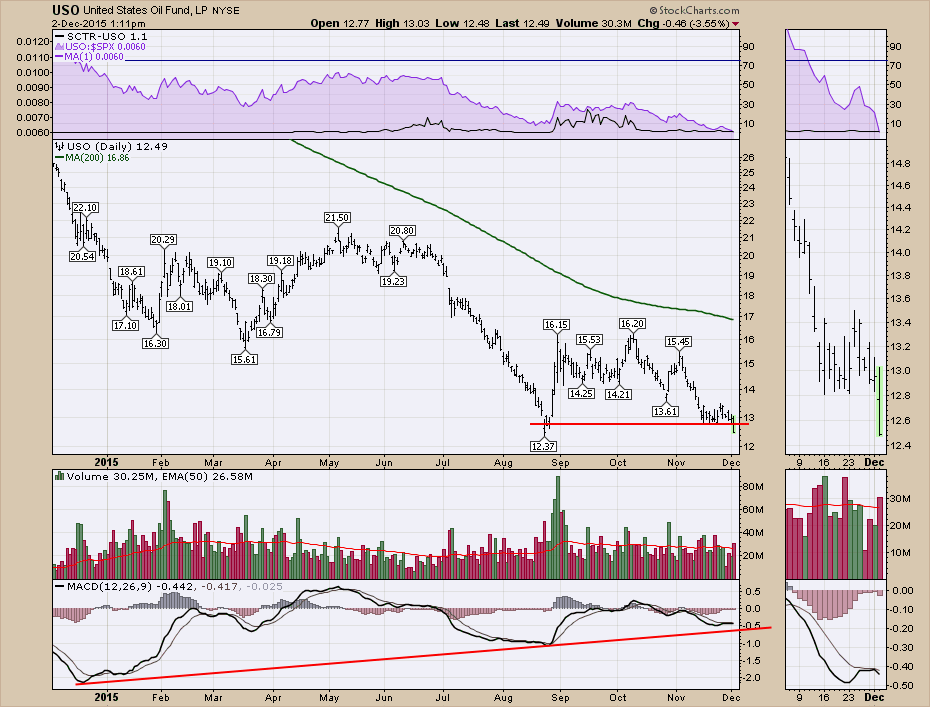
Today the oil ETF (USO) broke down through the November floor. Now the November low did not hold so Crude oil continues to threaten support. The MACD has been rising on a daily chart. Everyone expects this to be a final test of the August low... Read More