- The $USD continues to struggle
- If the USD rolls over here - then what
- Oil - trade around it, not a long-term thesis yet.
- Gold and Silver - very interesting here
- Other raw materials start to show some signs of life
Global Market Review - It's a global bear market
Thursday, I used the charts to define how a global bear market sets up on the monthly charts. I focused on this for the first 1/2 of the webinar to help define a global bear market using price action. Of the 19 Indexes shown, all were in a bear market posture at the same time. If you have any doubt about how a bear market looks when it starts, this might provide some direction.
//Global Bear Market// The currencies and the effect on raw materials// a potential chance for emerging markets to rally for a few months // strange volume behaviour in materials stocks // Gold and Silver // Oil.
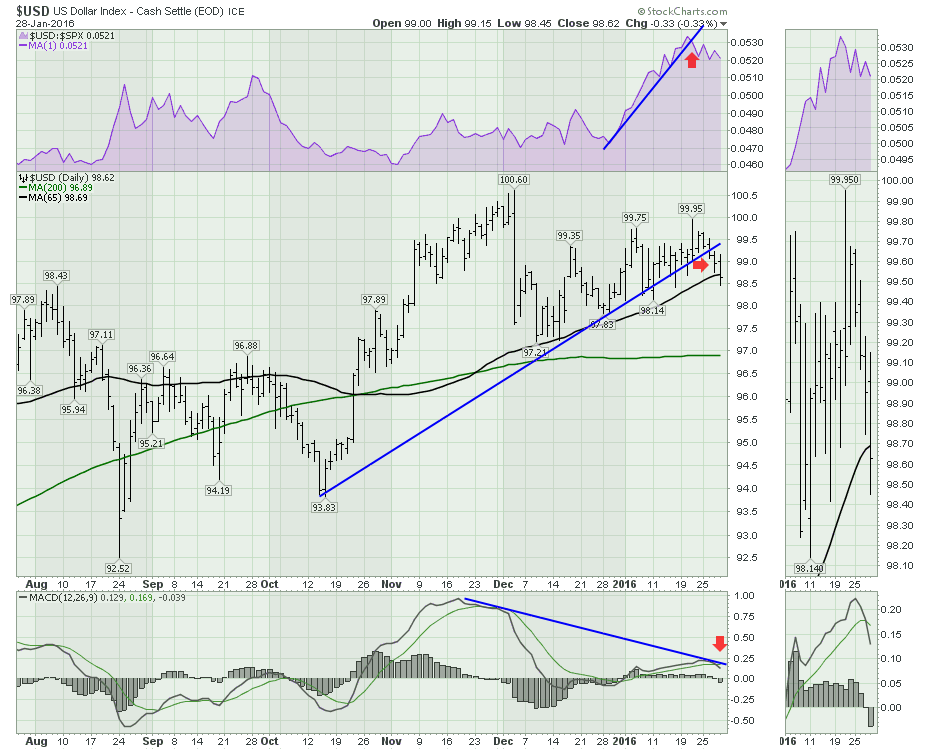
The $USD broke an important trend line this week. This is a closeup view.
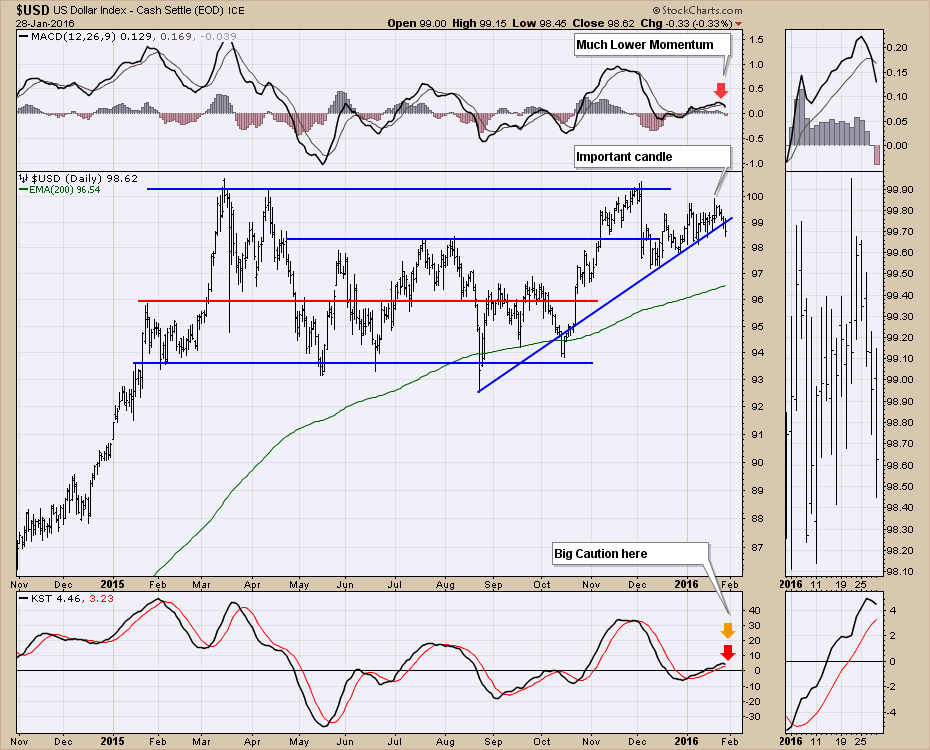
 Here is the $USD chart with a longer time frame. Notice the double top in place. This is a critical data point in the big picture. Last Thursday the $USD chart stroked a big candle that shot up towards the 100 level only to be rejected and closed near the lows. The bar can be seen inside the zoom box. The next two days printed inside bars where the candle was smaller than the day before inside Thursday's big bar. Then, the dollar drifted lower. Yesterday, the dollar spent the day below the trend line. This morning's news about the negative interest rates and Yen devaluation by the Japanese government may test this bar, but a weekly close below the trend line would be very important technically. Watch the webinar for more details about the Japanese currency. Conversely, if the $USD soars through the 100 level, this would reverse the associated trades listed below.
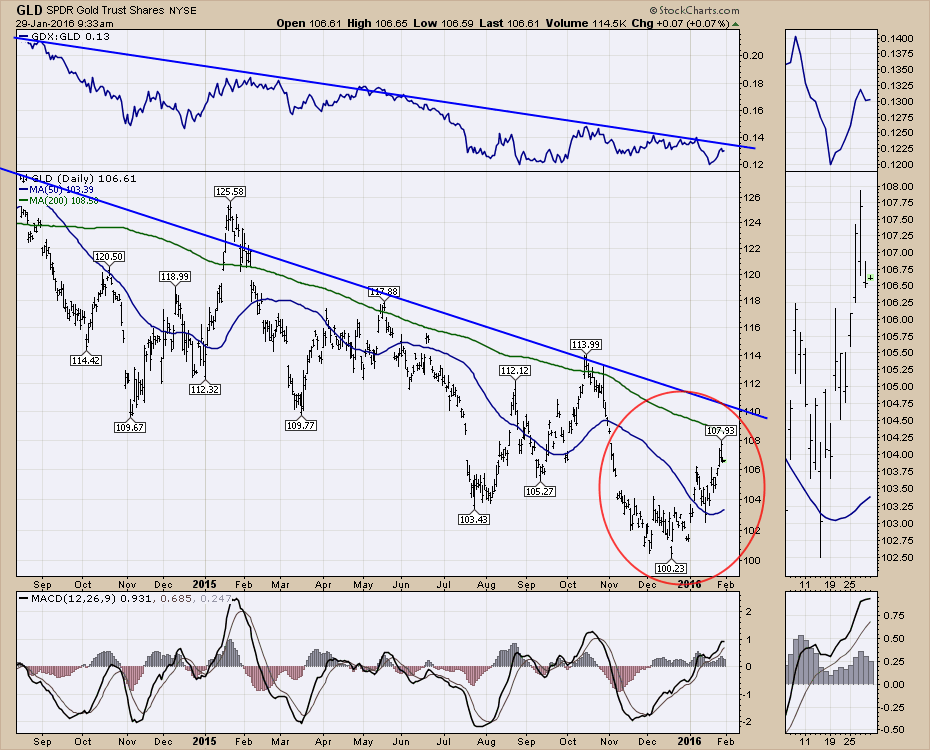
 With a lower $USD, this could lead to a bigger rally in the base metals and precious metals. Gold, shown using the GLD, had a good month in January but almost all of that gain came in the final week as the dollar stalled at the 100 level.
 There were some very interesting base metals charts this week. Below are two examples. In 2014, this stock had an average of 2 million shares. Look at the volume this week without any big moves on the price chart. The last 2 days show 19 Million and 23 Million shares traded. Somebody is putting some money into here. While the volume has been rising in a beaten down stock for a while, 5 of the highest volume candles on the chart have been recorded in the last 10 days.
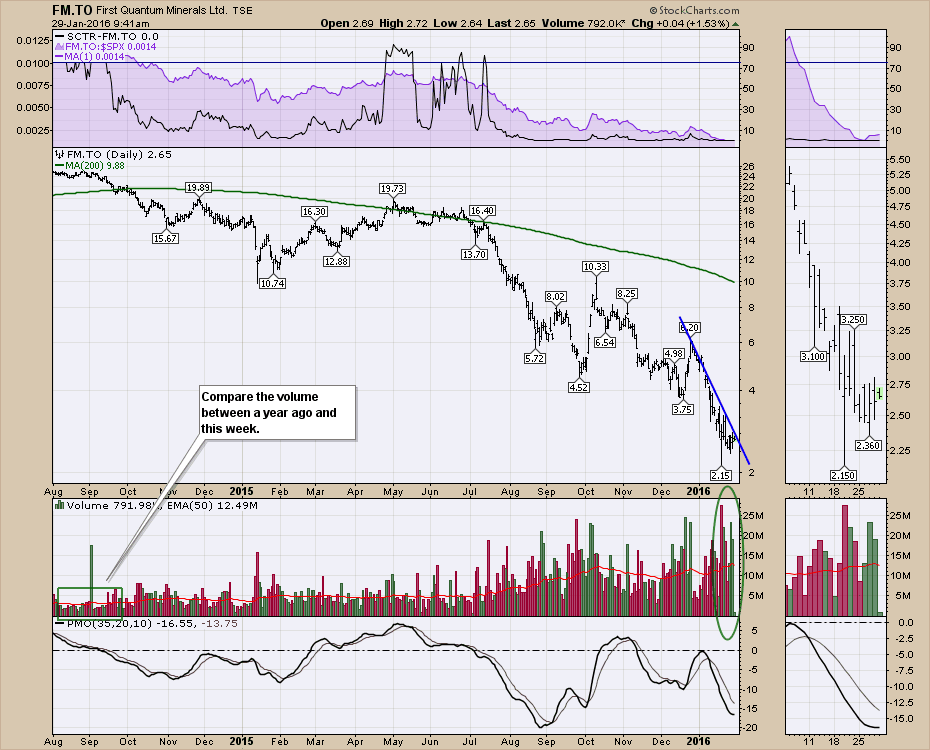 Here is another chart from Canada, where base metals are an important part of the economy. Look at the size of the volume bars with no price change. The late September to Mid October move was almost 60 %.
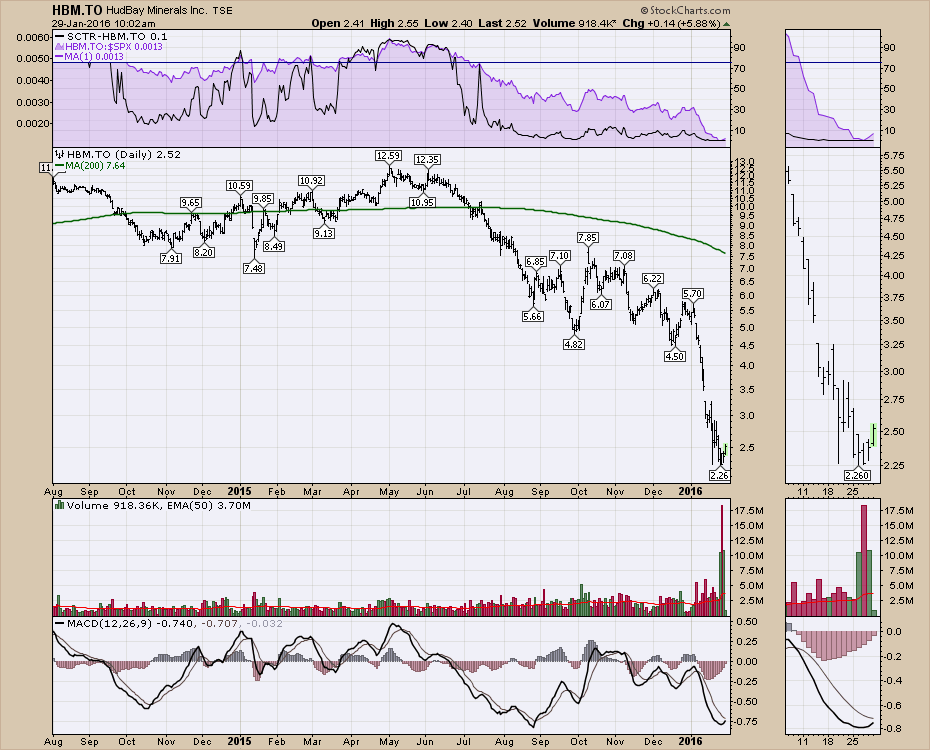 There seems to be some volume moving into base metals. I'll be working through this on the weekend for more coverage next week.
Click the Yes button on the bottom of the blog articles if you would like to get them in your email. You can also follow me on Twitter @schnellinvestor, you can subscribe to the StockCharts Vimeo channel, you can subscribe to the ChartWatchers newsletter that comes out this weekend by scrolling to the bottom of the homepage. There are lots of ways to connect, in what appears to be an increasingly volatile market environment. The monthly surges will be higher and lower, so trading will be preferred over buy and hold.
Good trading,
Greg Schnell, CMT
