With the bearish tone of the market showing its true colors, the webinar was focused on looking for bottoms in the current decline. We will be watching closely over the next week to see if the market can gain enough strength to take out the late highs of December. In the meantime, rallies are to be traded, not held. The link to the webinar with these charts is The Commodities Countdown Webinar 20160121.
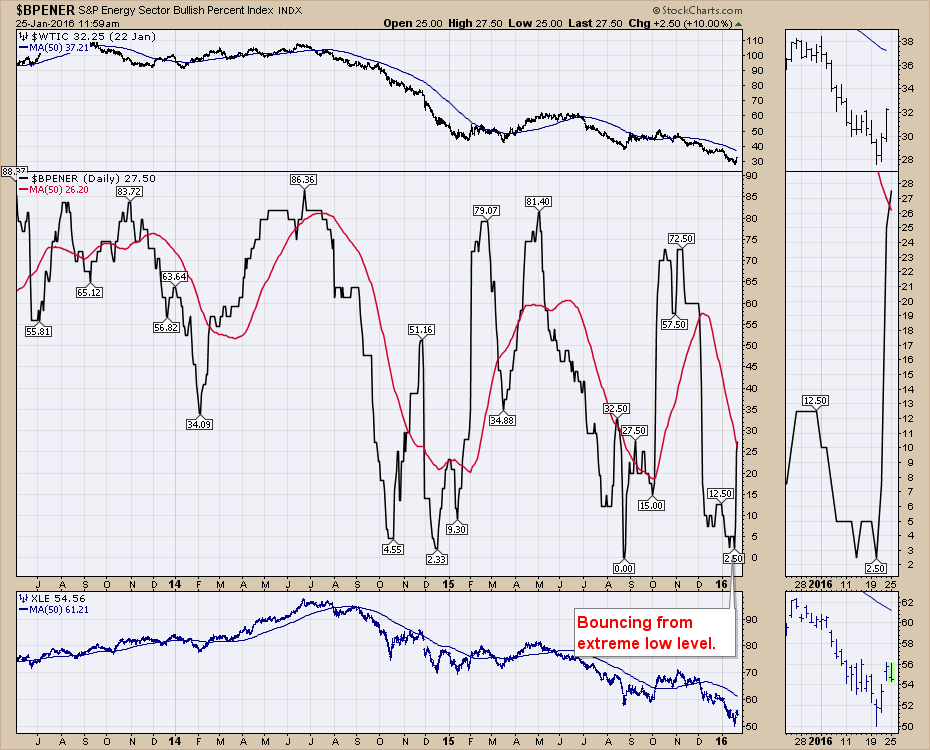
The first chart is the Bullish Percent Index from Energy. A reading of 2.5% has coincided with significant lows. While this just means a tradeable low, it marks the potential to be one of the final reference lows in the decline of oil company stocks. I don't see this low as the final low for oil, but the potential for some Oil and Gas production stocks to start outperforming the price of oil is probably arriving.
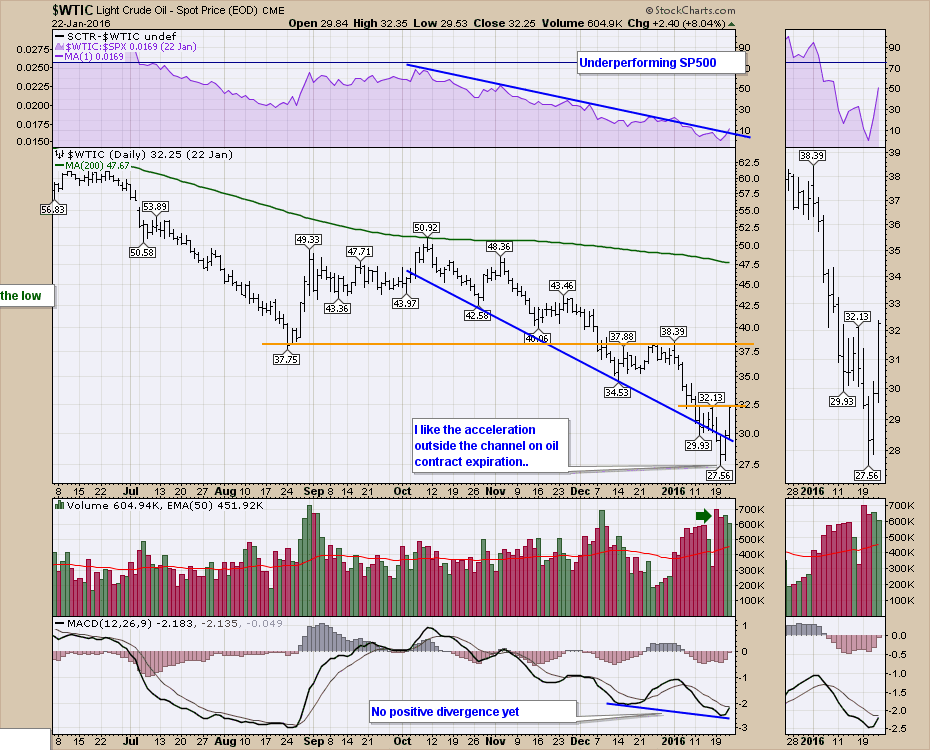
Looking specifically at crude oil, the chart of $WTIC crude made some positive signals technically while wiping out the previous lows. First of all, the acceleration of the decline into the final low is a good signal for a meaningful low to be established. This plunge below the trend line suggests a change in trend where the sellers are being exhausted. While this does not write the low as the final low, it goes a long way towards setting up a level where crude could retest and have trouble going below. On the MACD, which we use as an indicator of momentum, the indicator usually shows a positive divergence on a final low. This is something that usually happens, it does not have to be there. It is not in place on this low on the daily or the weekly as shown in the second chart below.
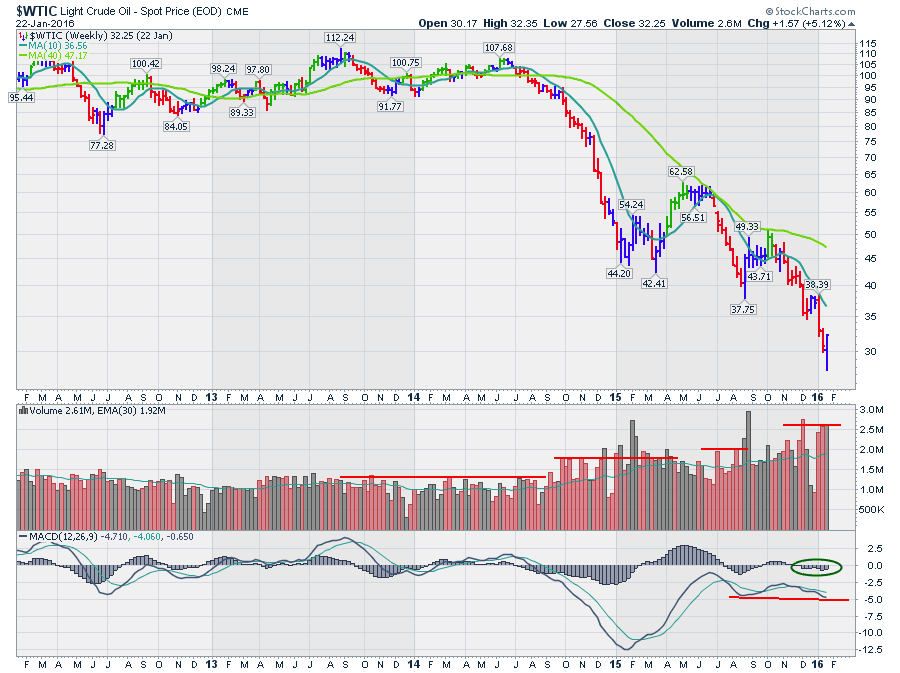
Looking on a weekly chart, positive divergence is not in place compared to the most recent low. If a retest occurred with a much higher momentum low, that would be a significant change in momentum that is more likely to be indicative of the final low. As this momentum gets less negative, we can watch for stocks starting to go up even while crude oil stays at depressed levels. The integrated oil companies (they also have refining margins which improve during low prices - so they have 'integrated operations' rather than just exploration) have held up better. We want to see pure oil and gas exploration companies emerge that might show who the leaders will be coming out of the final lows. There is a lot more about this on the webinar. Commodity Countdown 20160121 I will also be discussing this specifically for both Canadian and US Exploration and production stocks in the webinars this week.
The overall markets continue to trade in sympathy with the price of oil. The actual Wednesday low in oil coincided with the final contract for February delivery. Upon the expiration of the February contract and the roll to the March contract, we saw a rally in oil start. Now comes the monitoring of the situation to see if crude can continue to stay well above the $27.50 level. The trading is always very volatile near the extreme lows on a chart. Based on the weekly volume bars on the chart above, we have had three weeks of extreme volume. While last week's price candle closed higher than the previous week, it also contained the price of $27.56. So a lower low but a higher close. The extreme volumes show serious downside stress and perhaps the final flush of trading.
Arthur Hill did a great job on his webinar last Tuesday if you had a chance to see it. Arts Charts Webinar (20160119). One of Arthurs themes was setting resistance levels rather than support levels as the overall direction of the market is down. I had not viewed the market from that perspective, so I found it very interesting. If you get the chance, invest an hour there.
I will be hosting 2 webinars this week. The Canadian Technician Webinar on Tuesday 20160126 and the Commodities Countdown Webinar 20160128. Follow the links to register. Both webinars will include a lot of information about oil and gold right now. There are reasons to pay attention to both in the current market environment. We also have the Fed meeting this week which should send Wednesday into a wide, swinging affair. With lots of verbal intervention into the current market downtrend from central banks worldwide, the price action will be particularly important heading into the weekend as a large piece of the S&P500 earnings are released this week.
Good trading,
Greg Schnell, CMT
