The breakout above $35 on oil can be considered a breath of air to an industry of CEO's having the weight of their companies crushing their lungs. Exasperated by low oil and low Natural Gas prices, the CEO's have been firing long-time friends and associates, slicing staff hours, pommeling suppliers, beating down bankers, crushing benefits for employees, killing dividends and facing angry shareholders. It has been a menacing downturn.
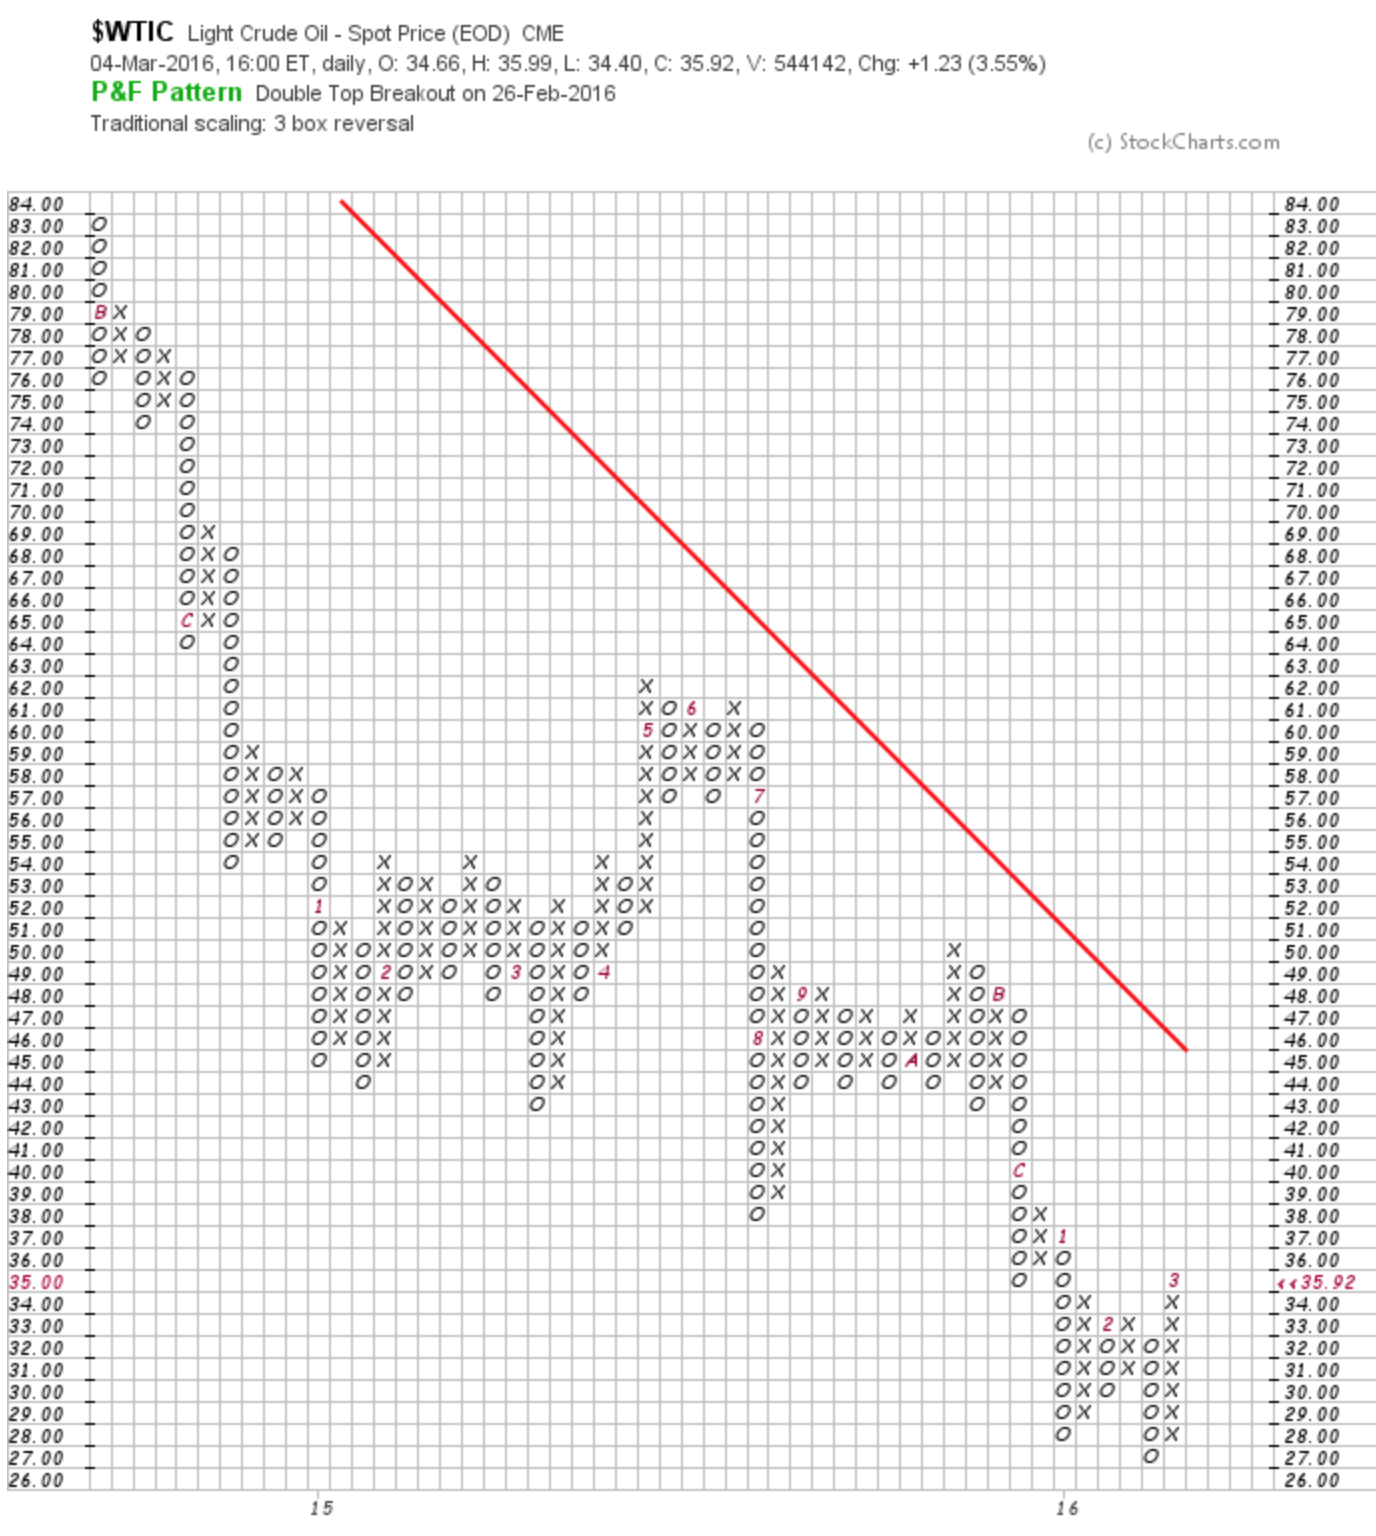
While there is some optimism heading home this weekend, $37 to $38 will provide the next upside hurdle.
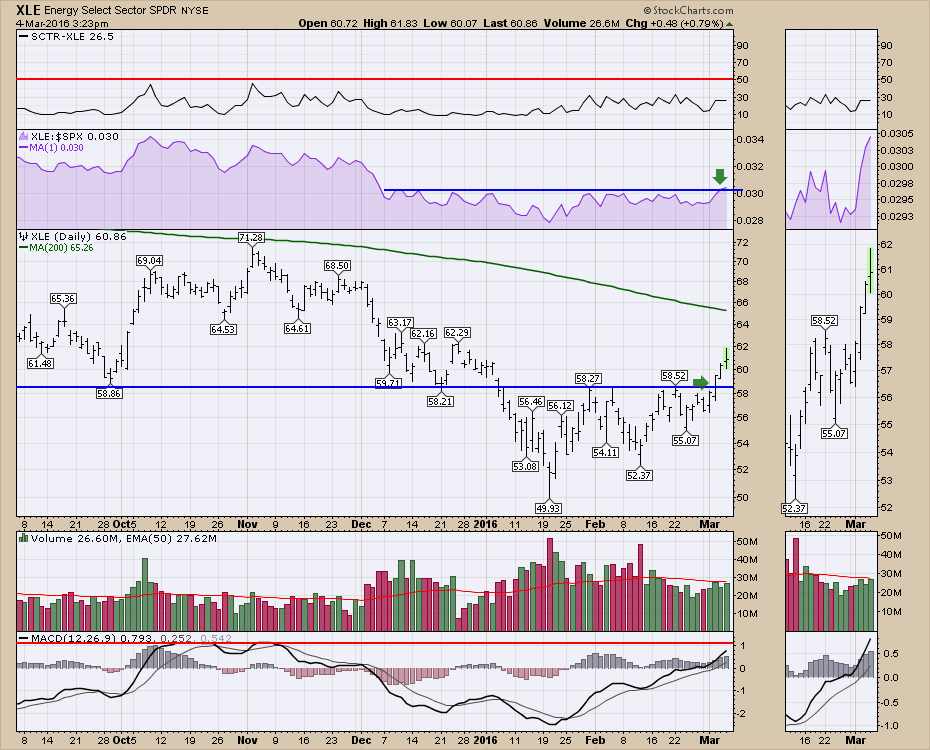
The XLE started to push above the resistance level this week. This is very bullish for oil as the oil price is following the stocks of companies. The SCTR does not show enough life here at this point for me to be convinced the low is behind us. The 200 DMA green line has stalled the breakouts before and that resistance level sits just overhead.
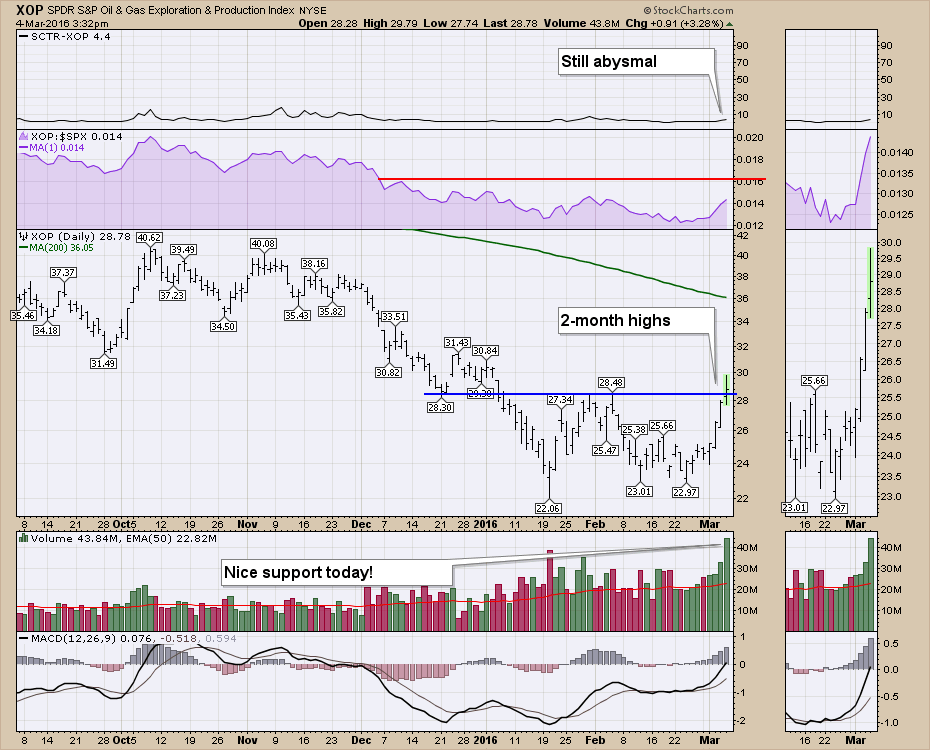
 The energy producer ETF XOP is struggling to move higher. Today marked a two-month breakout which is bullish. We have had a few of those in the downtrend, so this is optimistic to see but a little early to call the end of the bear. The SCTR is still under 5!
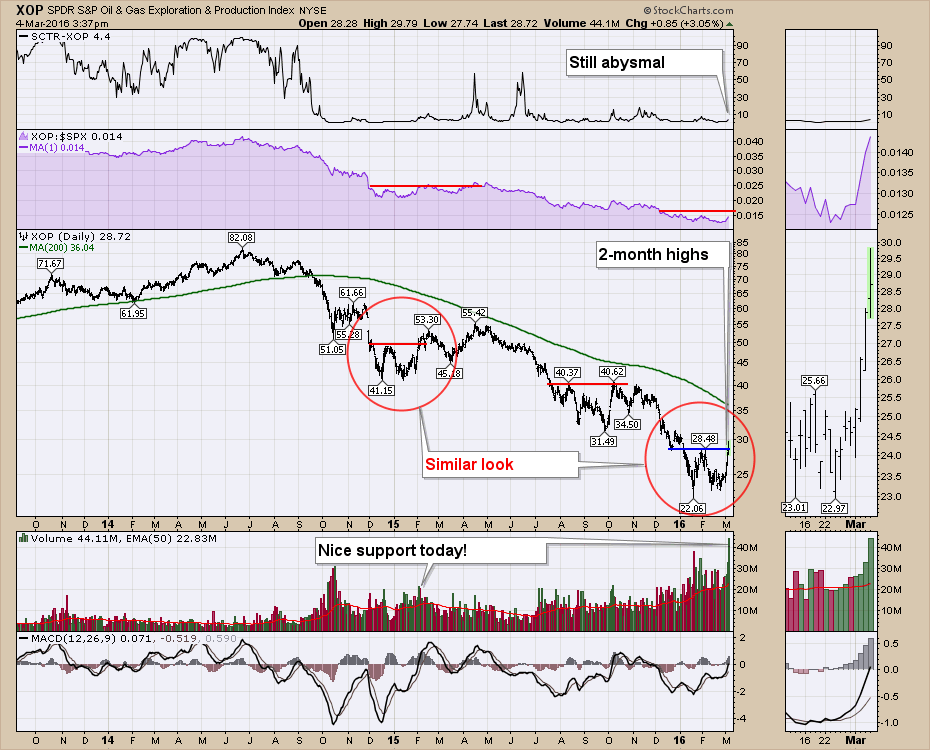
 Here is a longer term view of XOP.
 Looking on the Canadian side of the 49th great wall, here is XEG.TO. The SCTR is trying to jump up to the 70 level. I get more interested above 75. The relative strength is near 3-month highs and the 8-month relative strength line is just above. A 6-month Relative strength breakout is usually a bullish signal. You can click on this chart to see a live update over the next few weeks.
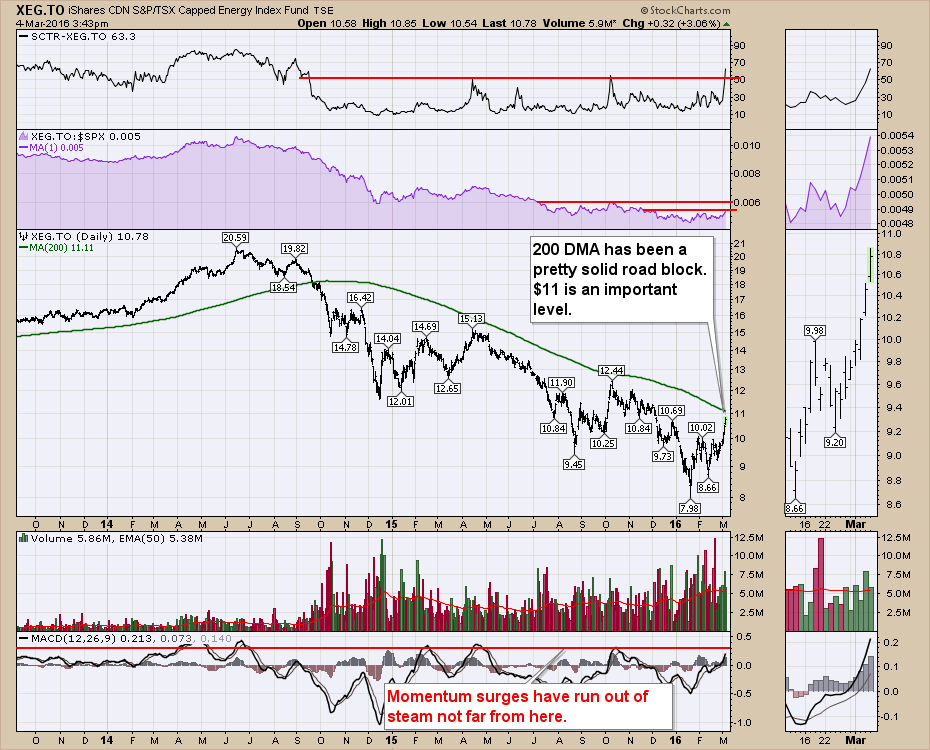 The volume is not as clear in Canada, so I would suggest a little caution. The momentum shown by the MACD has reached higher levels within the bear market, so be careful being too optimistic too soon. I think the debt bubbles and bankruptcies in oil and gas are the next set of problems for these ETF's. Rallies are nice to participate in but maintain an exit strategy.
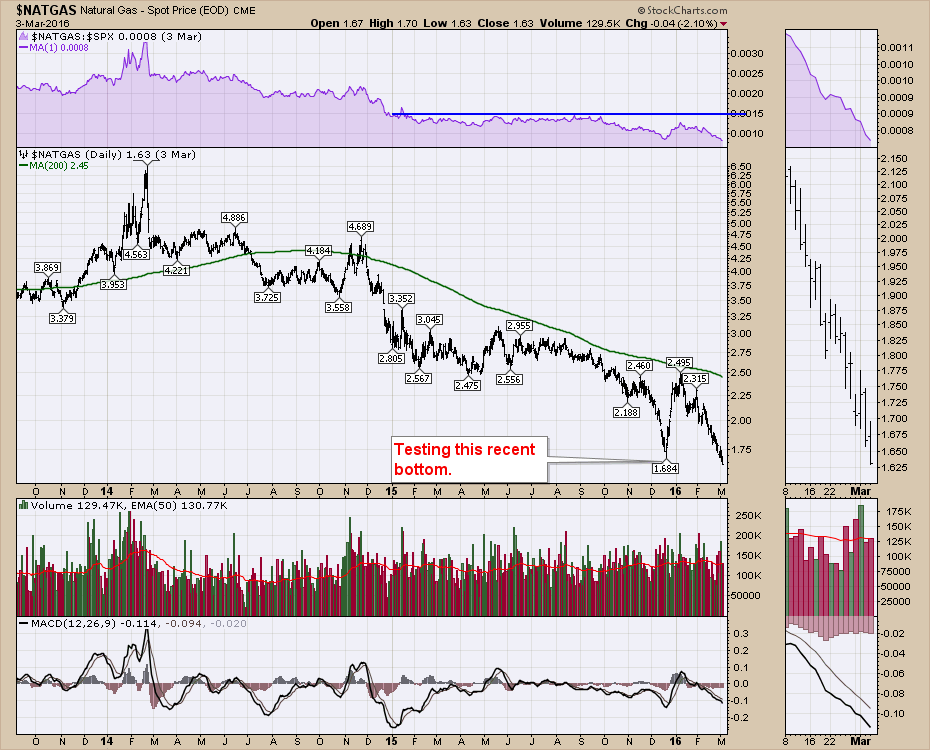
Natural Gas continues to die on the vine. There does not appear to be any low hanging fruit! There is always a bottom somewhere, but this week didn't provide any impetus to go long. Fans of Tom DeMark will recognize this slide as a significant trend that usually ends in an exhaustion of sellers. I would expect a reversal soon, but I have no desire to step in front of this push-down.
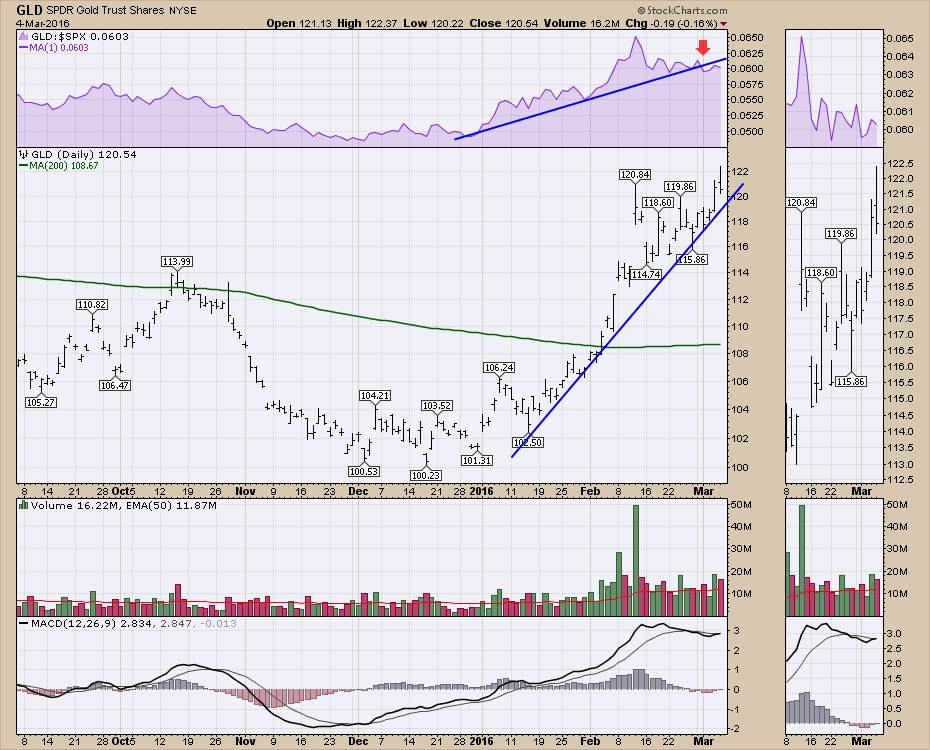
 Gold made significant gains this week. Today appeared to be a reversal day as shown on GLD. Profits might need to be protected for the next few weeks. We can see the uptrend in relative strength has been broken and GLD SPURS (SP500 Relative Strength) in purple is close to one-month lows. Caution is warranted for short term traders. Longer term, $GOLD has now broken to a primary trend bull market.
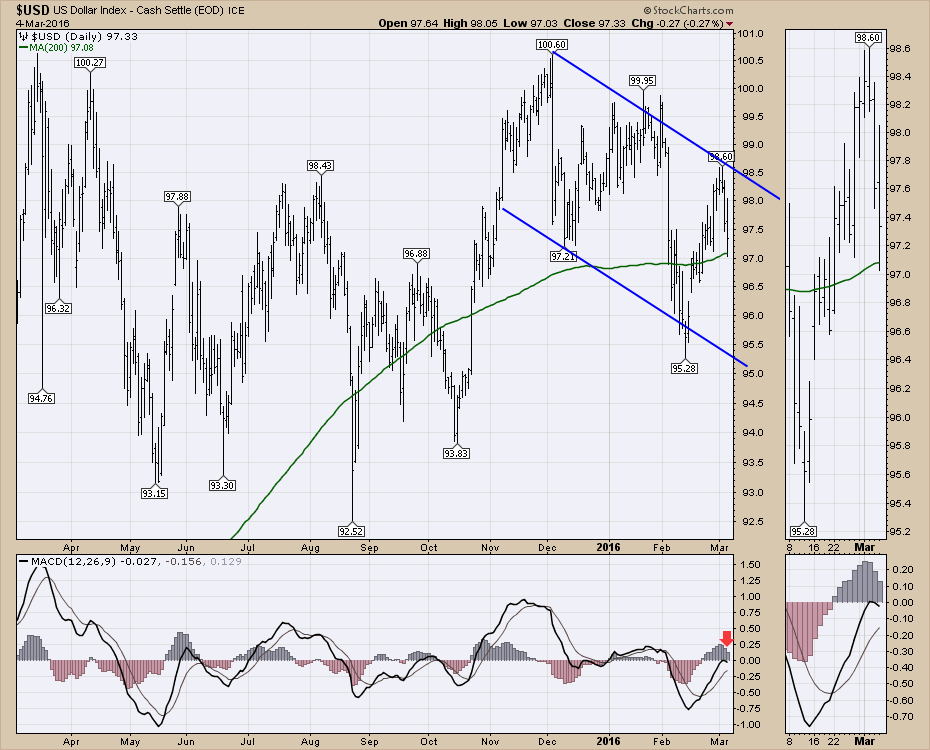
 The $USD continues to be a source of commodity volatility. Currently, we have a downtrend confirmed with lower highs and lower lows. In a longer term view, we have been in a sideways trading range for at least a year.
I think it is time to be extremely cautious on the energy sector. If you have a stock you like breaking out, take the trade. But if it loses its breakout, let it go. This spurious run in the stock market and the oil stocks has been shockingly good. Don't let the bear market wash those gains away.
I posted a chart about the SP500 ($SPX) on another blog today. I think it adds context to the big picture. Is Market Sizzle About To Fizzle? I would encourage you to read through it to understand why the 2000-2030 level is so important.
As well, the Commodities Countdown webinar 20160303 covered a lot of information on how to get involved in oil stocks when they finally start a big bull market. If you already have a plan, great. If you don't have a plan, I would encourage you to watch the webinar for ideas on how to get setup for the big breakout when it happens. It may be next week, next month or later in the fall, but being ready is very important. Click on this link at any time for setting up industry specific chartlists. Commodities Countdown 20160303. Hopefully, you will find it to be a valuable hour. For those that wanted more market commentary from the webinar, that will return next week.
Good trading,
Greg Schnell, CMT, MFTA
