With the Federal Reserve minutes being released Wednesday, lots of subtle changes are taking place in the commodities. On Thursday's Commodity Countdown Webinar 2016-05-19, I reviewed some new signals starting to show up for Canadians and Australians that US investors can participate in as well.
"Commodities Countdown LIVE!" with Greg Schnell - 2016-05-19 17:00 from StockCharts.com on Vimeo.
Webinar // Vertical Chart 0:00 // Currencies 5:00 //CRB Components 12:00 // Goldman Sachs Commodity Indexes 19:00 // $TSX, $AORD Relative Strength - Important 25:00, see also Closing Remarks // Ag Commodities 28:00 // Industrial Metals 34:00 // Auto Manufacturers 36:00 // Wind and Solar 39:00 // Gold, Gold miners 43:00 // Q&A -Closing Remarks 49:00 //
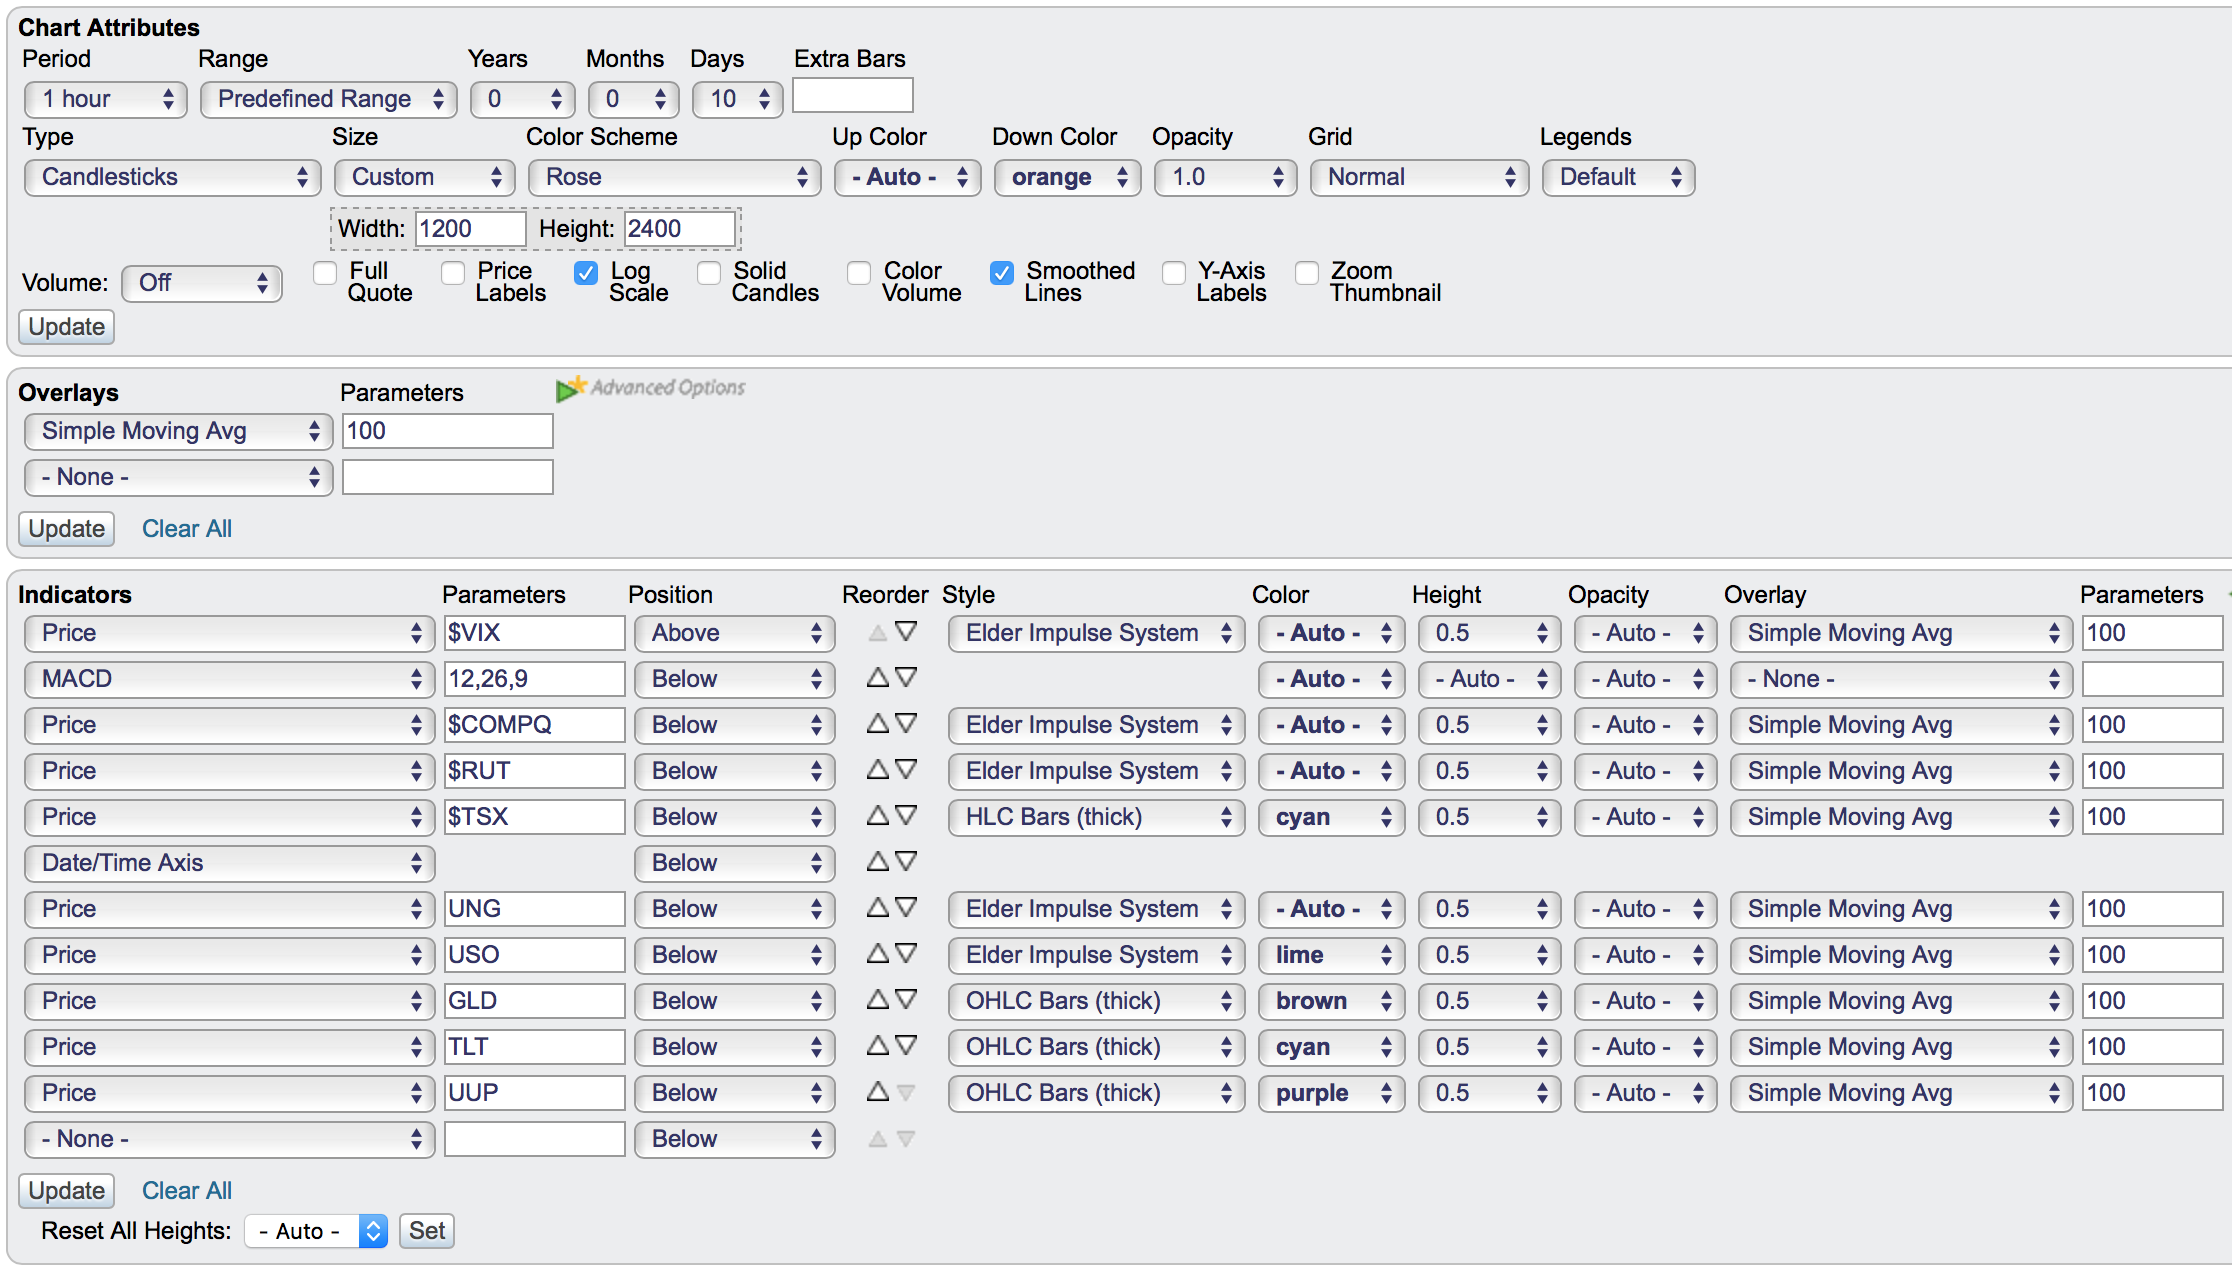
There were some requests for a link to my vertical chart that we worked through to start the webinar. For the first few minutes of the webinar, I discussed how I use the information on the chart. As I have the chart set up tall and narrow, when I resize it to include it on this blog, a lot of the annotations are misplaced. For all of you with PRO accounts, you can click on this link to see the chart. Greg's Vertical Chart Setup. Before you try to save it, click on annotate, add an arrow or small line and upload the chart. This will allow my labelling annotations to stay on the chart when you save it to your chartlist.
Below is the chart setup. It is a chart of $SPX with a 1-hour period setting. Because I have used 10 price plots ($SPX + 9 others), you will need to have a PRO account at StockCharts.com to set this up exactly the same. If you have any questions, join me on next week's Commodities Countdown Webinar and let me know if everything worked out.
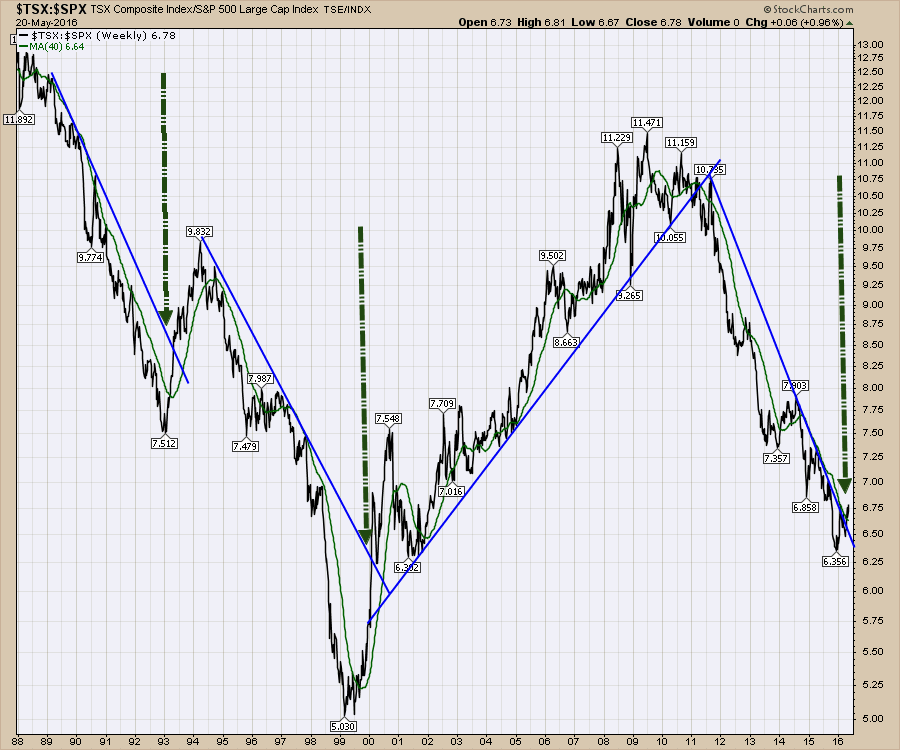
 I think two of the most important charts I have shown this week are the $TSX and $AORD charts relative to the $SPX. Below we can see the Toronto Stock Exchange Index ($TSX) breaking out of the downtrend compared to the $SPX. On the webinar, I spend a considerable amount of time why this signal is so important.
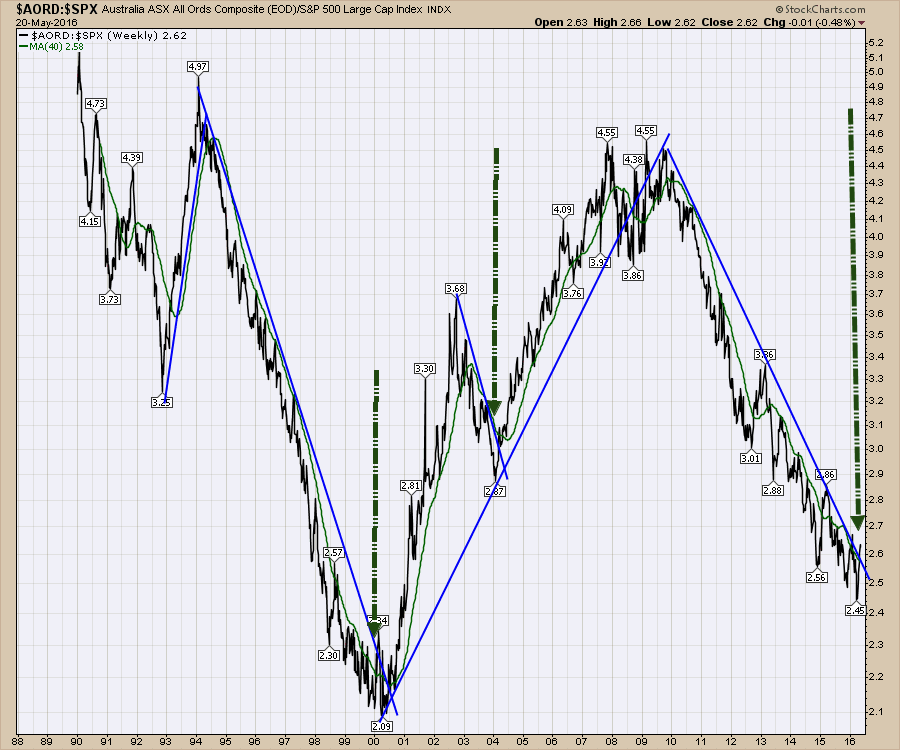
 What makes the signal more valuable is the corresponding signal from the ratio using the Australian Index ($AORD) shown below.
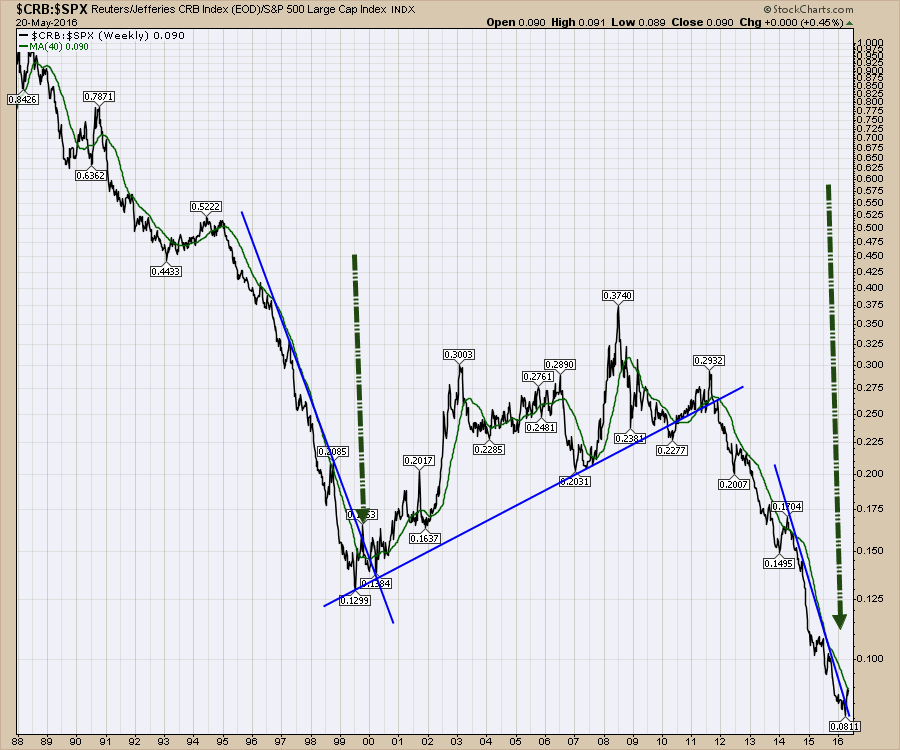
 Below is the chart of the $CRB ratio with the $SPX. This is also breaking out. Nothing is ever certain, but after a 5-year bear market in commodities, it looks like the commodity-related countries and the $CRB are all starting to outperform the $SPX. As we can see on the three charts, these significant turning points can be very helpful if you can get into the trend early. It suggests that commodity-related plays might outperform the $SPX. At this point, this is bullish for commodity related investing until proven otherwise.
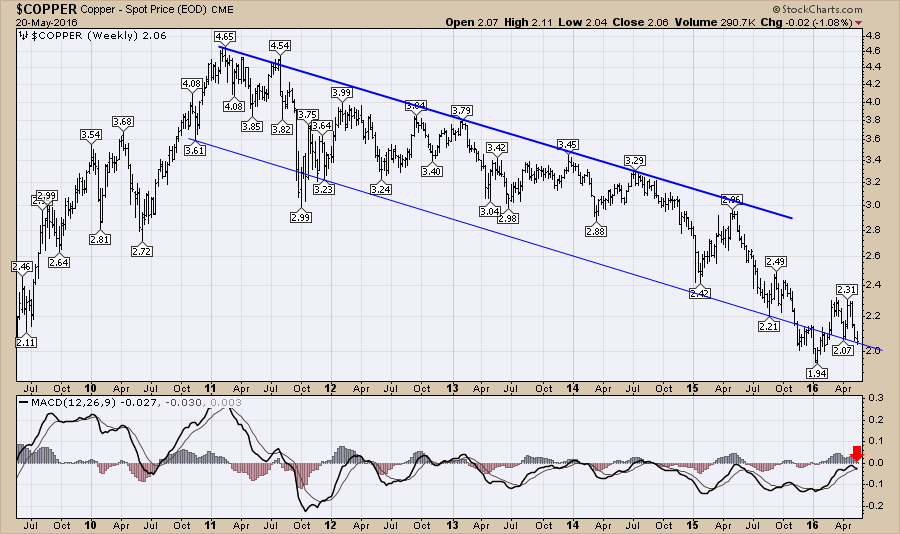
 One of the distinctions I made in the webinar is that the industrial metals are currently pulling back. This might be a commodity space to avoid if the $USD continues to push higher. As an example, the $COPPER chart is suggesting lower prices not higher.
 I went through the car manufacturers starting around the 36:00-minute mark of the webinar. Commodities Countdown Webinar 2016-05-19. It's always fun to do, but in this case, my optimism was very muted towards the industry group. This includes Tesla, the stock with a spark, but no flame. More on the webinar.
While oil and gold are always in the news, one of the more interesting commodity areas are the agricultural commodities. For the last two webinars, I have actively discussed the agricultural commodities.
Commodities Countdown 2016-05-12
Commodities Countdown 2016-05-19
There is a substantial reason for these commodities to behave differently. The agricultural commodities are food related. Longer life spans, as well as an increasing global population, continue to apply pressure to the world food supply. So while prices ebb and flow, longer life cycles and an increasing population are fuel to the fire of agricultural prices in the long term. After a five-year bear market, can we expect this bear to continue forever?
Here is DBA which is an ETF from multiple agriculture-related futures contracts. While it broke out earlier this week, it pulled back below the breakout level again. If this starts to rock, we want to be a part of this trade.
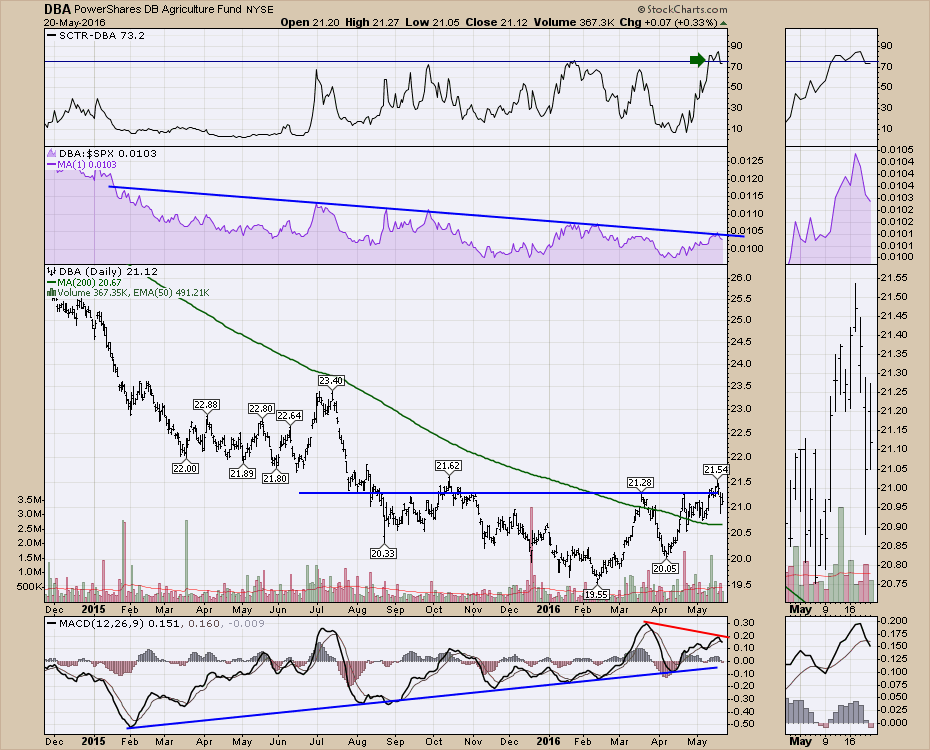 The negative divergence on the MACD is not a bullish signal. The fact that the Relative Strength shown in purple above the price plot has not been able to break the down trend is also a problem. If the Relative Strength could start to push higher, I would be a big fan of investing in more agricultural-related themes. Food related themes are usually found in the Consumer Staples sector. This can be very helpful if the overall market is struggling for direction as Consumer Staples are usually more stable.
Continue to stay tuned in on the Commodities Countdown blog for more commodity-related themes. Click Yes on the button below to get these blogs delivered to your inbox. You can also follow The Canadian Technician blog which also has some commodity related ideas. Click Yes at the bottom of each blog (not each article!) to subscribe for email updates with a couple of articles a week. PS. Don't forget to watch this week's webinar if you missed it!
Lastly, if you are a Twitterian, you can follow me 140 characters at a time @Schnellinvestor. For the Canadians, have a great long weekend. For everyone else, have a great weekend!
Good trading,
Greg Schnell, CMT, MFTA.
