The commodity pops and drops this week have been very sudden both ways.
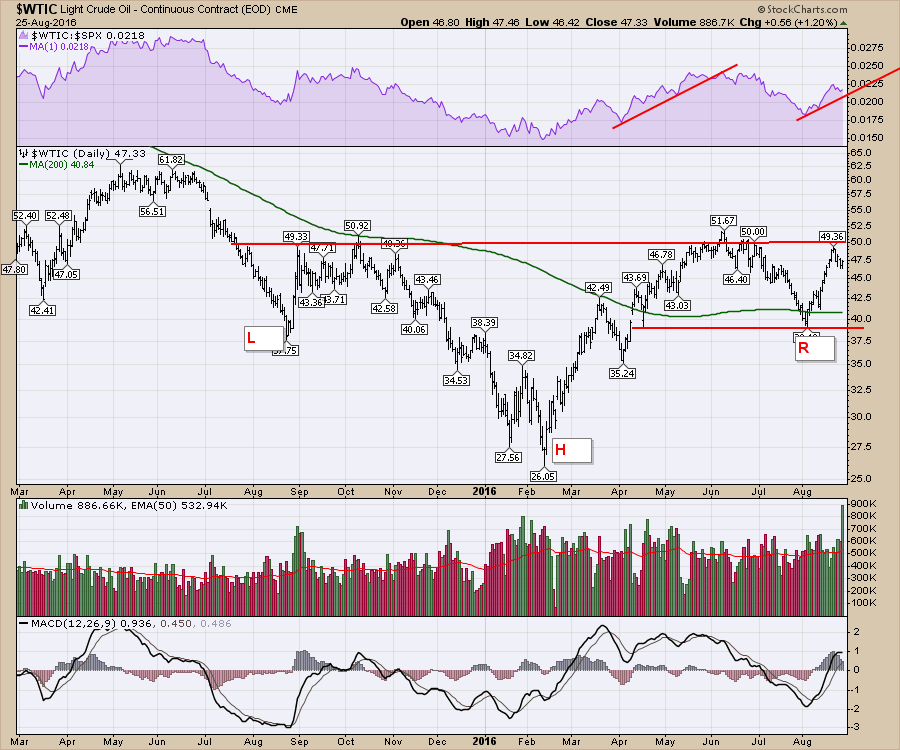
Oil struggled as it approached $50 and has drifted back this week. This is not really a surprise, as probably every floor trader was selling at resistance. It has now built a nice channel between $39 and $50. If crude breaks through over the next few weeks, expect it to accelerate quickly.
 I started off with a review of the webinar I shared with Martin Pring on Tuesday, August 23rd. Members can find that previous webinar at the StockCharts webinar archives. There were a few questions from the survey results that I tried to answer in the review portion of my Commodities Countdown webinar.
Commodities Countdown LIVE! with Greg Schnell - 2016-08-25 17:00 from StockCharts.com on Vimeo.
Webinar // Pring 6 stage review 0:00 // $CRB Components 22:00 // GCSI Indexes 28:00 // XLE, XOP, FRAK, CRAK // Copper, Steel, GLD, GDX, Silver 35:00 // Coffee 39:00 // Natural Gas 41:00 // Q & A 50:00 //
GDX suffered a breakdown from a precarious position. Previous webinars discussed the potential for this to happen. There was also an article titled Ever Been Hit By A Gold Brick? that suggested the potential for a pullback. The GDX is off the highs by about 15%. We'll be watching to see if gold and the gold miners settle lower.
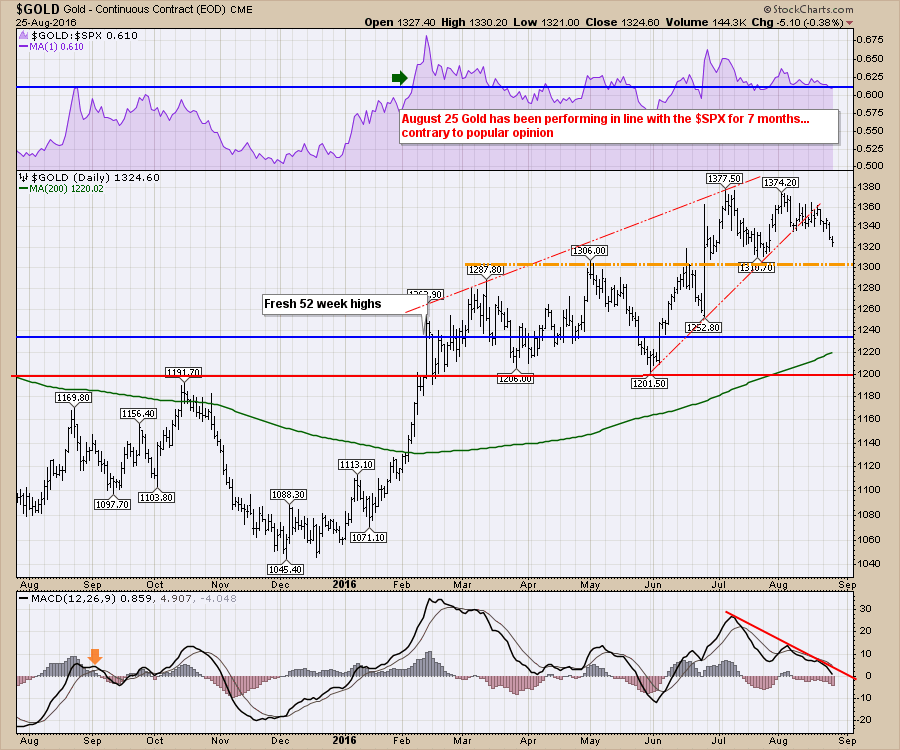
On the $GOLD chart below, gold has been performing in line with the $SPX for about 7 months as shown by the purple relative strength chart.
 Here is the chart for the GDX which tracks the gold mining stocks. Below I have put a couple of indicators. The Percentage Price Oscillator (PPO) is at an unbelievable level! We'll watch Friday's close as this is a weekly chart, but this looks to deliver a sell signal by crossing the signal line. On the Standard Deviation plot, this is the highest deviation on an up move in the 11-year history of the ETF. The other extreme peaks were on selling climaxes rather than bull moves higher. The Rate Of Change indicator (ROC) reached its highest level ever.
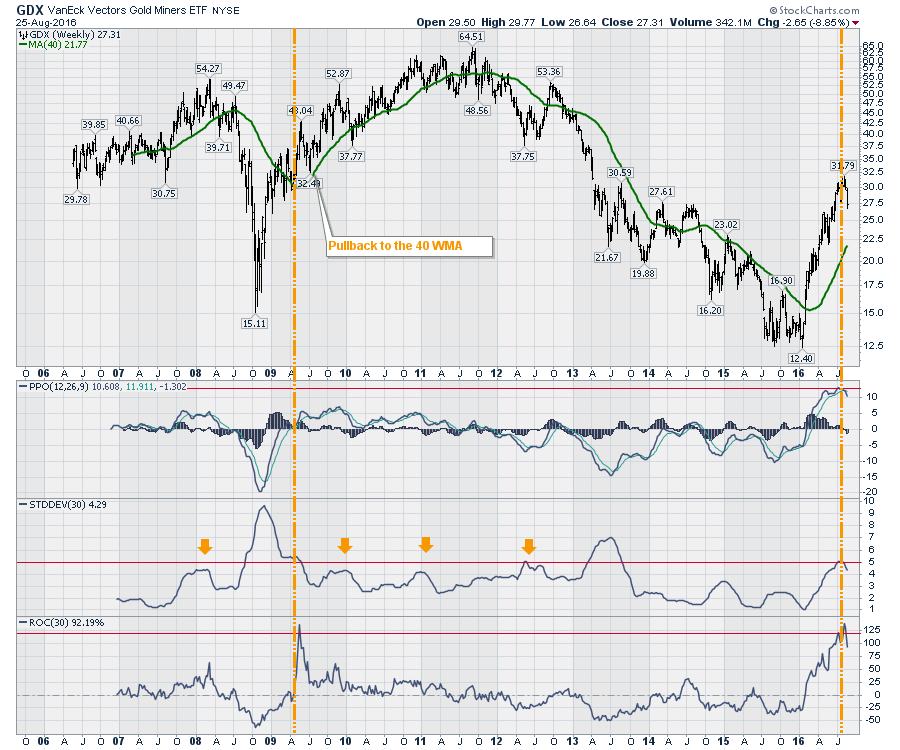 I did make one note on the chart above. The previous ROC spike occurred when the price was well above the 40 WMA. It pulled all the way back to the 40 WMA before resuming the climb. If that occurred again that would be about another 15-20% from here.
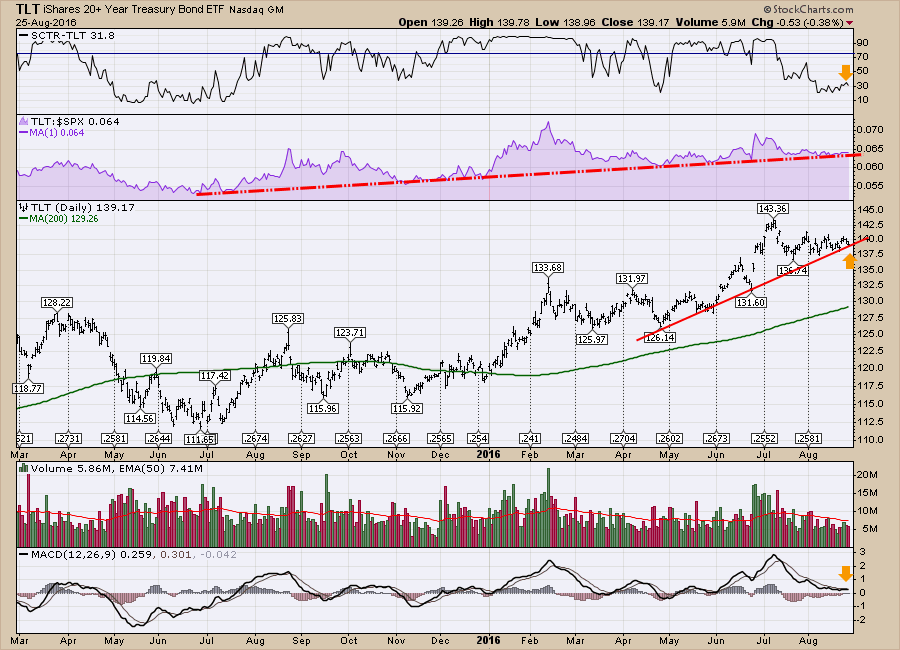
As part of the discussion with Martin, we looked to the credit markets for information about transitions. The TLT is at a very important inflection point on the charts. The ETF has an SCTR of 31. It has been tracking under 30 for most of the month. That is weak. Moving to the purple relative strength, there is a year long trendline being tested. Should this breakdown, this would fit in with Martin's 6 stage model. Price is resting on a trendline currently and the MACD has flattened out around zero. It all lines up to be the calm before the storm. We'll see which way this breaks!
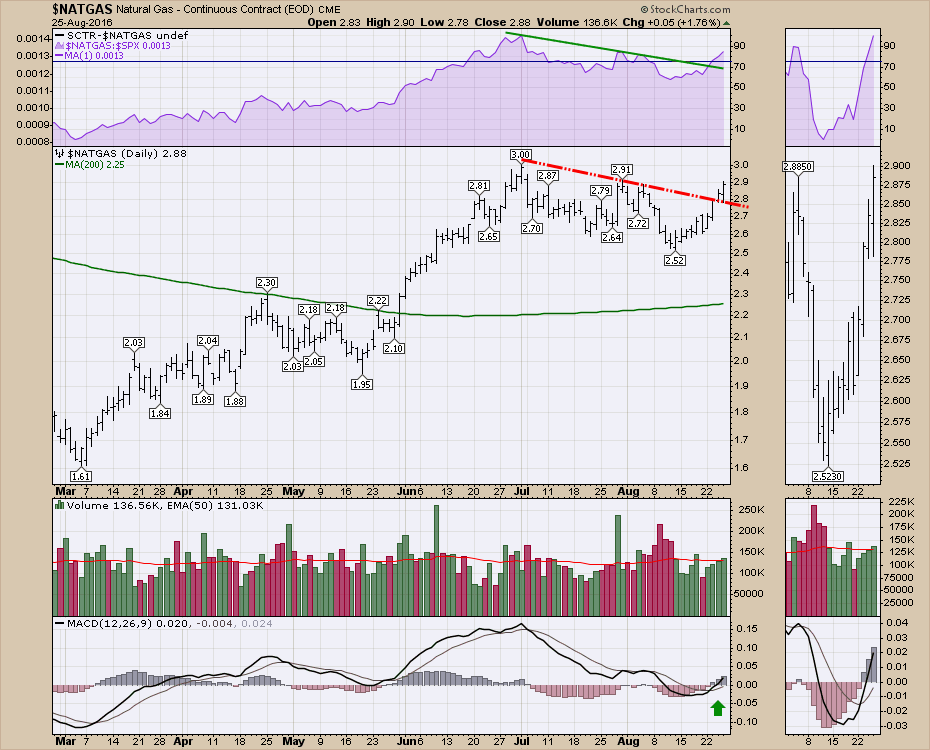
 Lastly, my favorite trade going into the fourth quarter is Natural Gas. This chart is setting up nicely for another run.
 The webinar on Tuesday had the highest registration ever for a live StockCharts event. Next month, Chartcon 2016 is coming to you via live stream broadcast. Rather than have customers spend all the money to travel to the event, we have arranged for all the technicians to gather in one location and broadcast from there, saving you thousands of dollars. It should be a crazy couple of days with a tight synopsis of the markets from an award winning Technical Analyst crew. You can register for this event for under $200 and have access to the recordings. Chartcon 2016.
Lastly, I will be presenting in person at Golden Gate University in September if you are in the area.
September 20th, 2016 @ 4 PM
Golden Gate University. Rm 3214
536 Mission Street
San Francisco, 94104
Cost: Registration is $10 for MTA members and $20 for non-members
You can register through the TSAA-SF website. Click here.
Good trading,
Greg Schnell, CMT, MFTA
