The charts have been bullishly aligning for the majority of the commodities since the January/February lows. With the US Dollar trading between 93 and 100 for 19 months, the stability of the dollar has been helping some of the commodities regain some chart strength. With the $USD in the middle of the range, 8 commodities either lost the support of the 40 WMA or broke a support trendline in the last 2 weeks. That is not the action we would expect to see.
Gasoline ($GASO) lost 40 WMA support in the energy sector. Crude Oil ($WTIC and $HOIL) are still holding up above the 40 WMA...barely. Heating Oil ($HOIL) gave us a trend line backtest that looked successful but now looks unable to get back above trend. So these two start the parade.
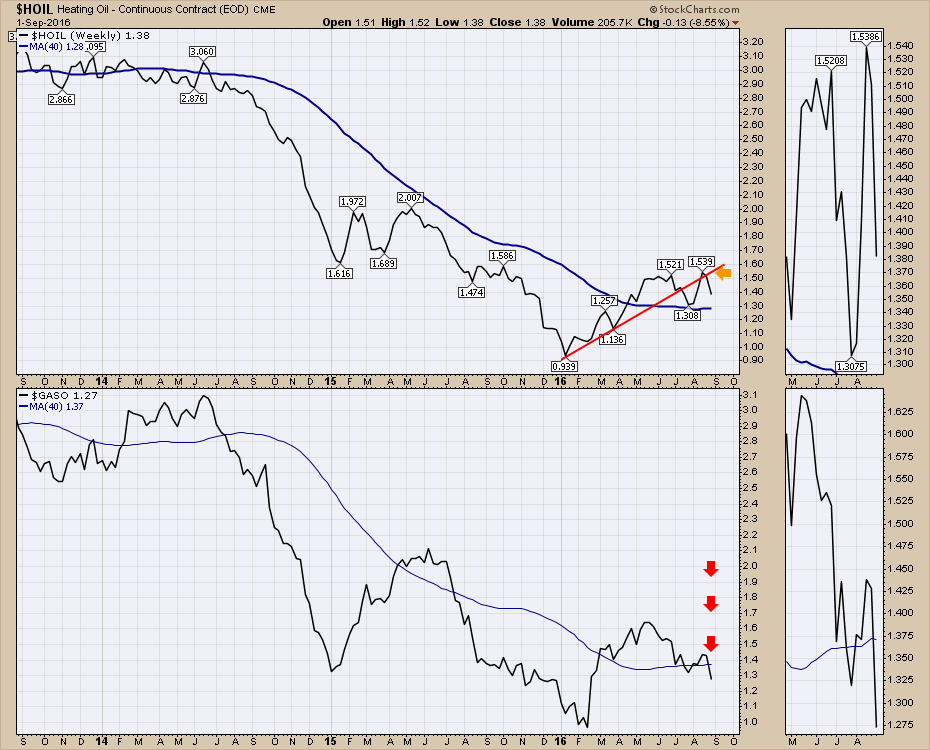
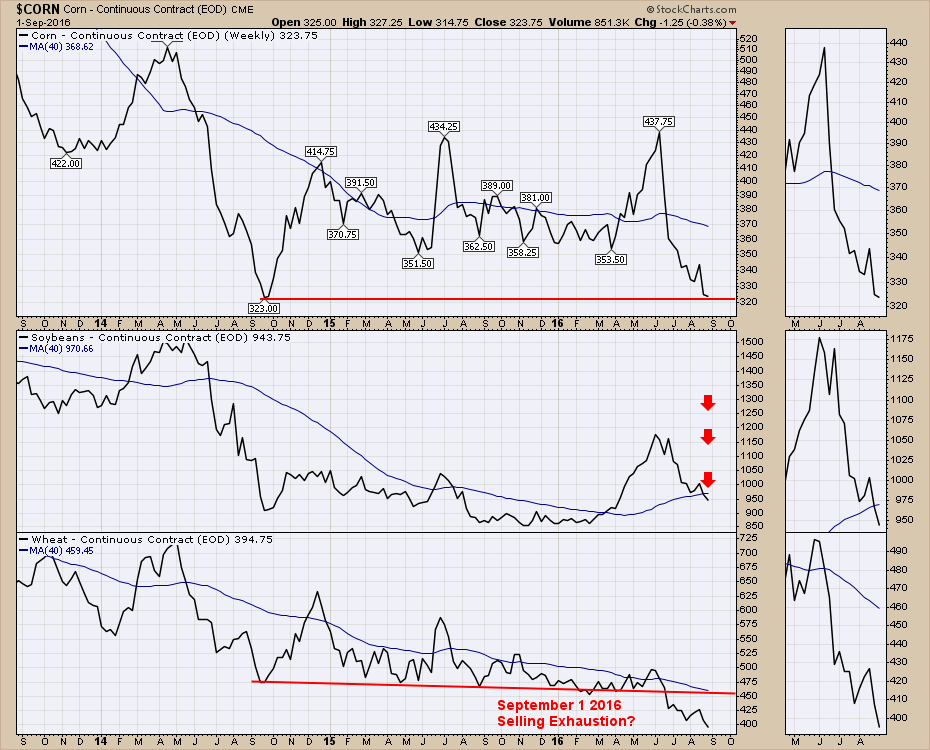
Soybean ($SOYB) in the middle panel didn't have a good week either. It lost the $1050 support level in July, but now it has lost the 40 WMA as well. The good news for $CORN and there isn't much good news, is that it is near previous support and aggressive traders may trade using the $323 level to lean on. $WHEAT continues to sell off. At some point, the sellers should be exhausted, but that is not the case yet.
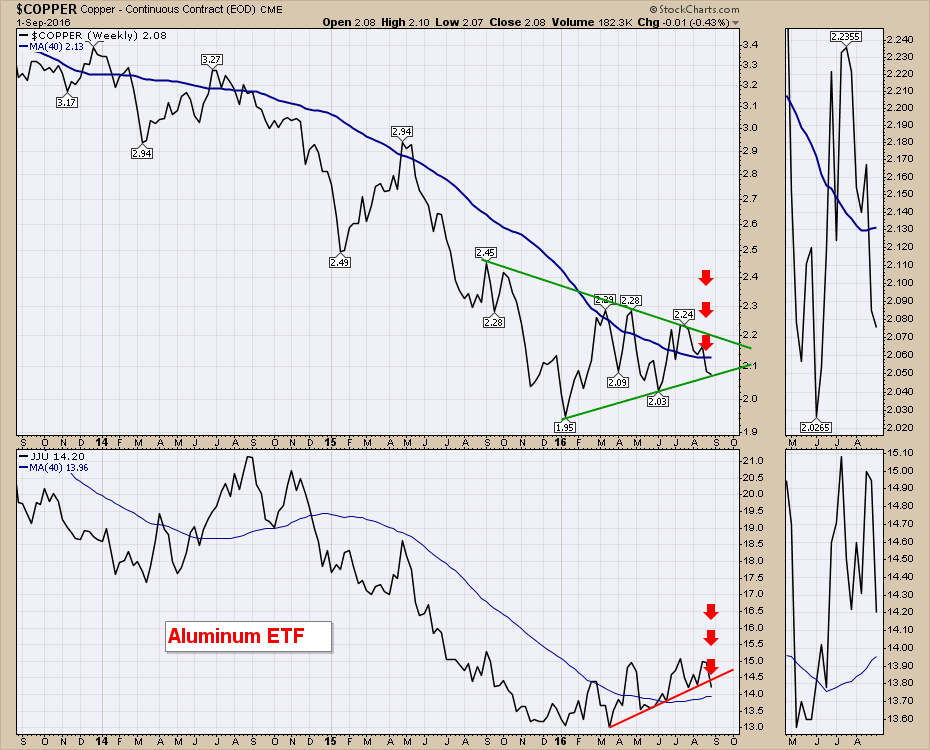
 $COPPER let go of the 40 WMA early last week and is testing the lower trendline of the pennant. Aluminum (JJU ETF) is just the opposite it appears. It broke its trendline first and is now threatening to lose the 40 WMA next. The bottom line is the direction is down for both of these industrial metals.
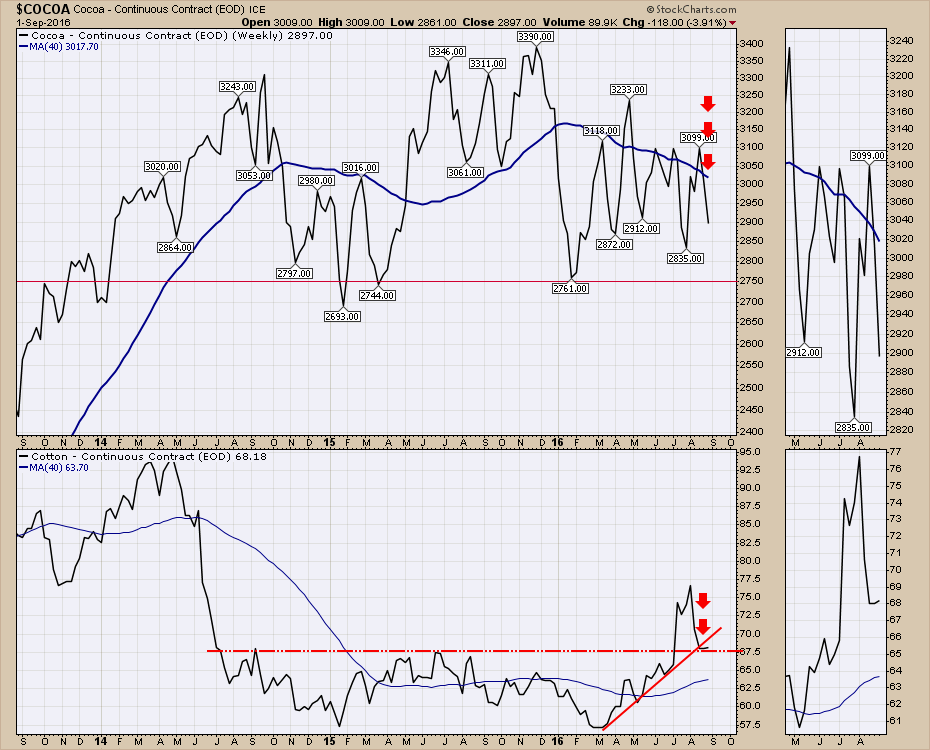
 $COCOA also lost the 40 WMA in the last few weeks. $COTTON lost its' trendline and is trying to stay above horizontal support.
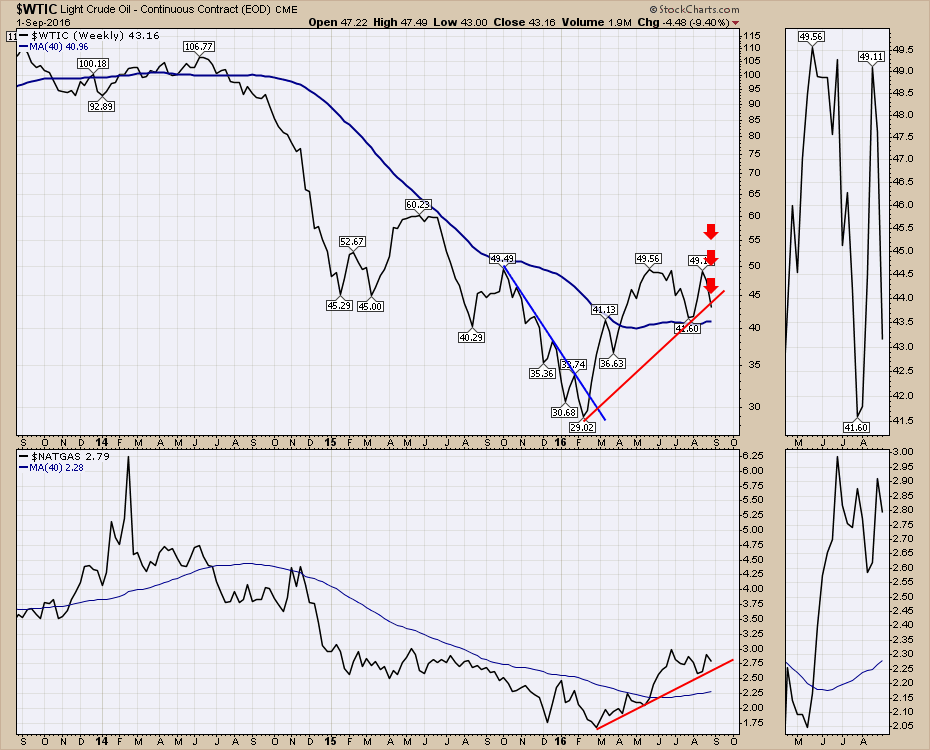
 The final chart is the Crude oil ($WTIC) and Natural Gas ($NATGAS) chart. West Texas ($WTIC) broke the uptrend and needs to close Friday near $45 to ensure the trend line holds. For Fibonacci friends, it is at the 61.8% retracement of the recent move up in August. $NATGAS continues to wobble around the $2.75 level.
 Considering the US Dollar has been range bound for 19 months, having 8 commodities lose trendline or 40 WMA support in 2 weeks seems somewhat alarming for those who indulge in commodity related trades. As the current strength of the commodity relationships to equities and bonds is important as pointed out by Martin Pring and me on our webinar of August 23rd, the focus must remain steadfast for this critical state of affairs.
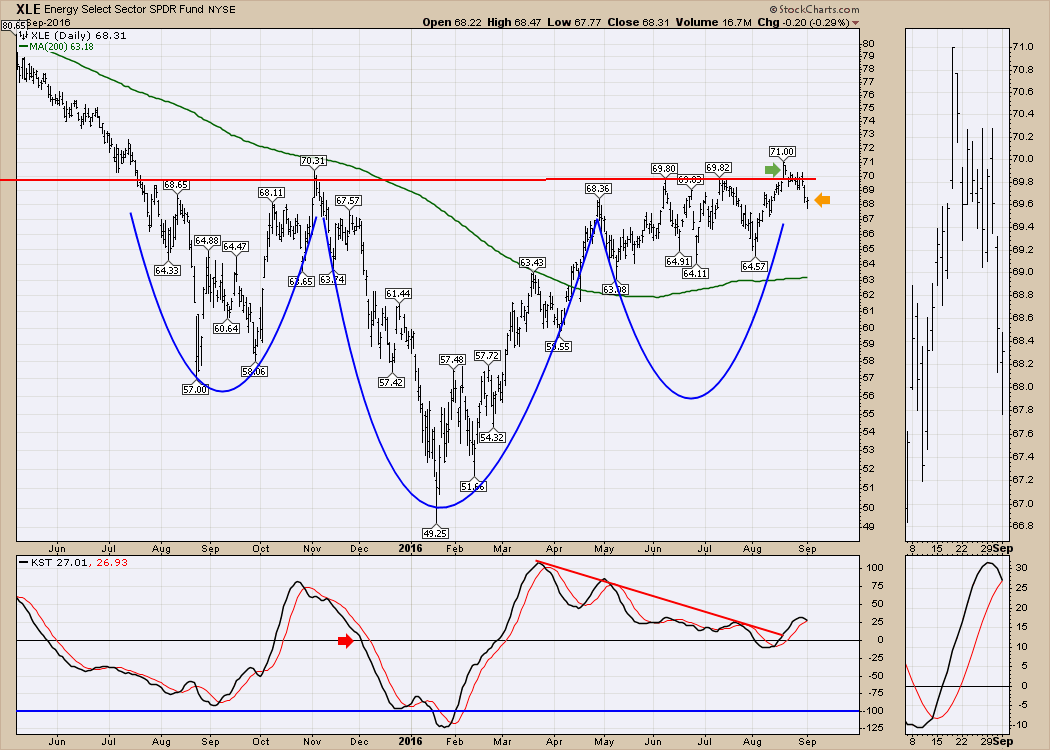
Interestingly, XLE held up rather well in the firestorm of the crude oil decline through the trend line yesterday. As crude oil closed below the trendline, XLE was largely unchanged even though crude oil fell over 3% on the day. Some of the individual oil stocks were up on the day which suggests some stability in the oil stocks. We'll watch to see if it continues.
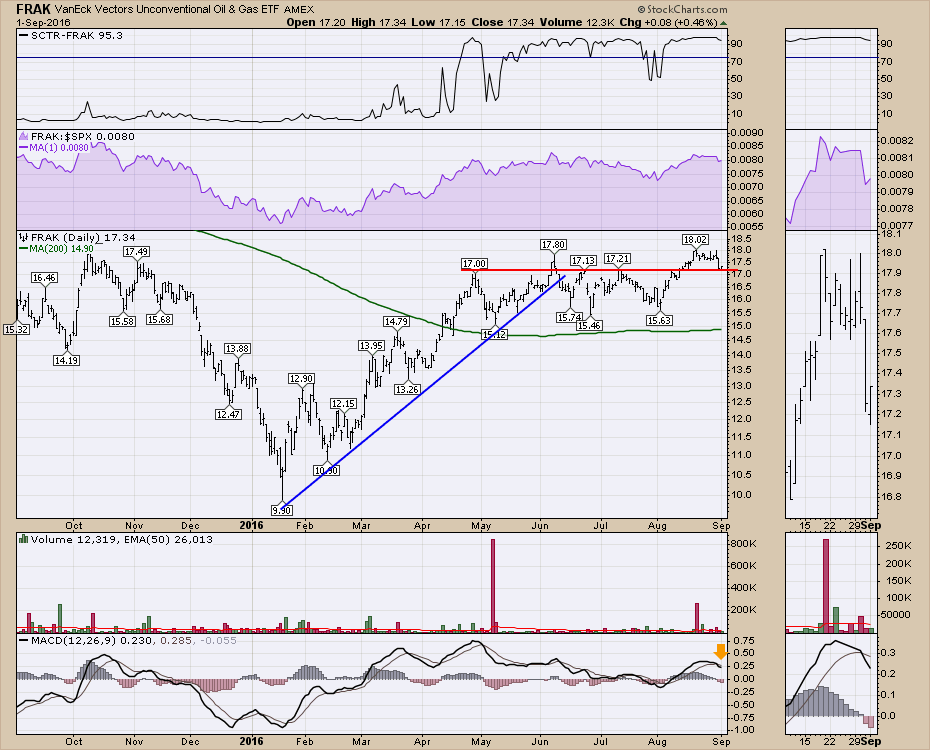
 Here is the chart of FRAK which represents the unconventional Oil and Gas exploration companies. It actually closed up on the day with Crude Oil down over 3%. The zoom box illustrates the price action more clearly, but the support trendline is currently in play in the main panel.
 The webinar is provided below. Instead of reading the entire 60 minutes of commentary, I would encourage you to review the hour-long webinar over this long weekend to see the condition of the big picture.
Commodities Countdown LIVE! with Greg Schnell - 2016-09-01 17:00 from StockCharts.com on Vimeo.
Webinar // $CRB 0:00 // $CRB Components 9:00 // Baltac Dry Index 22:00 // XLE, FRAK, CRAK 22:00 // $WTIC 26:00 // $NATGAS 30:00 // Uranium 37:00 // SLX 38:00 // Gold, Silver 40:00 // BPI's 50:00 // Currencies 53:00 //
This month, Chartcon 2016 is coming to you via live stream broadcast. Rather than have customers spend all the money to travel to the event, we have arranged for all the technicians to gather in one location and broadcast from there, saving you thousands of dollars. It should be a crazy couple of days with a tight synopsis of the markets from an award winning Technical Analyst crew. You can register for this event for under $200 and have access to the recordings. Chartcon 2016.
Next, I will be presenting in person at Golden Gate University in September if you are in the area.
September 20th, 2016 @ 4 PM
Golden Gate University. Rm 3214
536 Mission Street
San Francisco, 94104
Cost: Registration is $10 for MTA members and $20 for non-members
You can register through the TSAA-SF website. Click here.
There will be a Chartwatchers article published this weekend. It goes out twice a month. It is free, it has articles from most of our technicians, and usually gives some important clues to new trends. As each author writes about what they think is important that week, it is interesting to see when the authors align on a sector. The situation is unique as the authors are positioned around the globe. This gives a raw sample that is not coordinated by an editor-in-chief. Chartwatchers sign up.
Feel free to pass this article on to friends and family. If you would like to receive future articles by email, click on the Yes button below. I do roughly one-two articles a week from each blog (Commodities Countdown, The Canadian Technician, Don't Ignore This Chart) so you need to subscribe to each one individually. I also do a couple of webinars each week and you can view those live or in our webinar archives. As a heads up, I'm on twitter @Schnellinvestor.
Thanks for taking the time to join me. If you would like to receive a few of these Commodity emails each week in your inbox, click on the Yes button below.
Good trading,
Greg Schnell, CMT, MFTA
