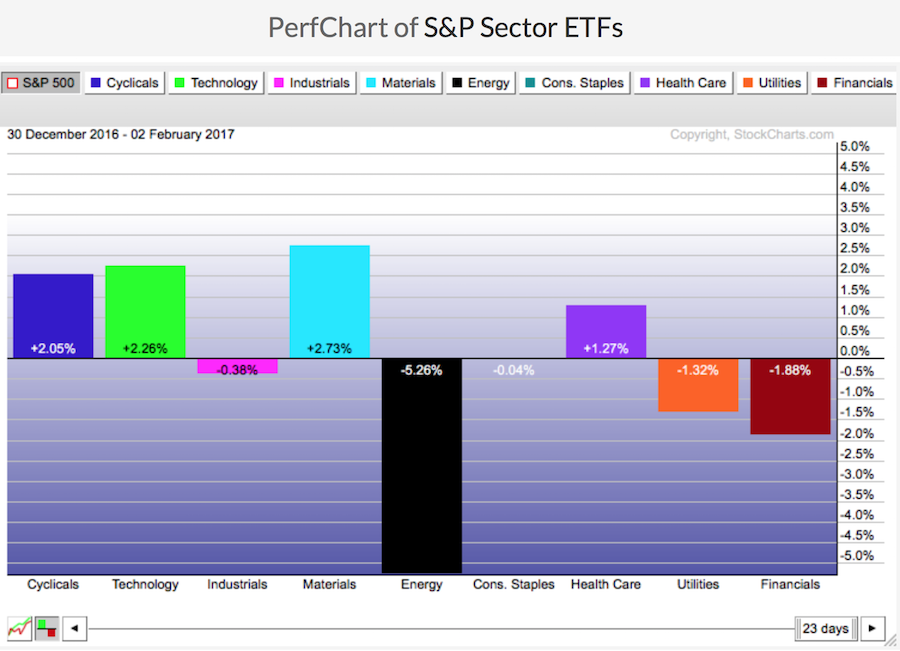
While oil holds around $53, the oil companies have been pulling back. Here is the performance chart over the last month. Lots of the oil stocks are trending down to the 200 DMA currently.
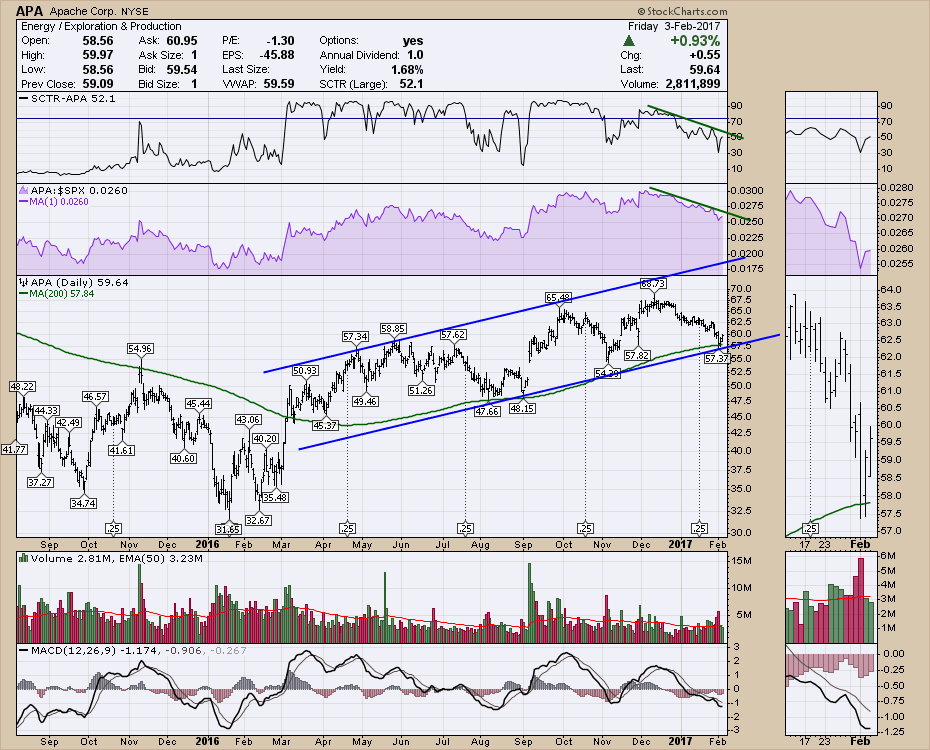
Looking at some of the individual picks, Apache (APA) is near 200 DMA support in a rising uptrend. That is better than most of the peer group.
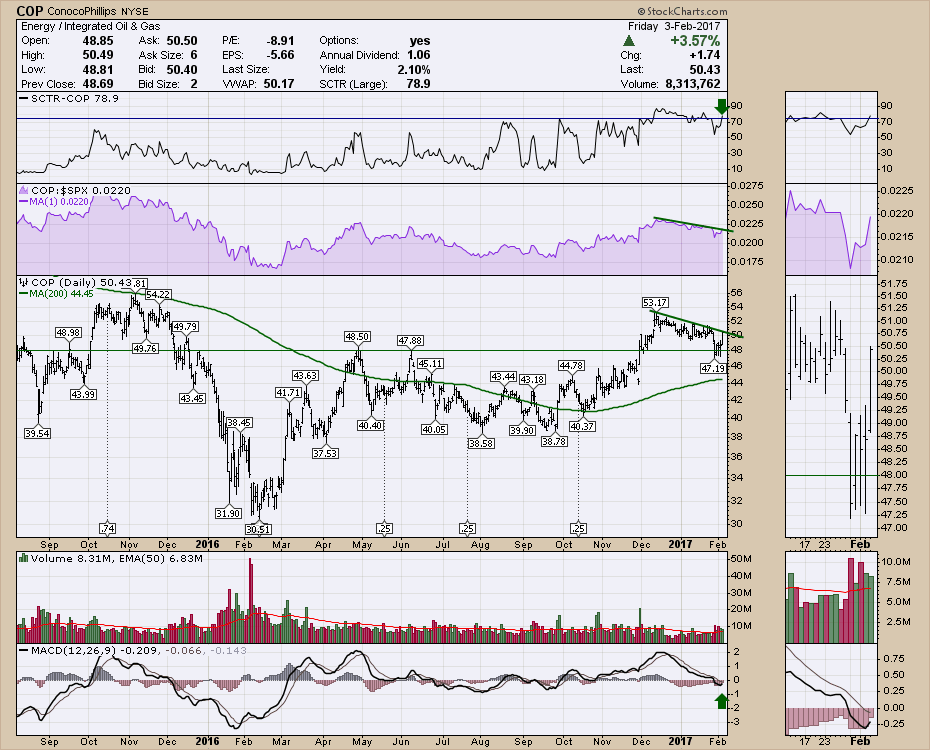
 Conoco Phillips (COP) is bouncing off horizontal support $48.
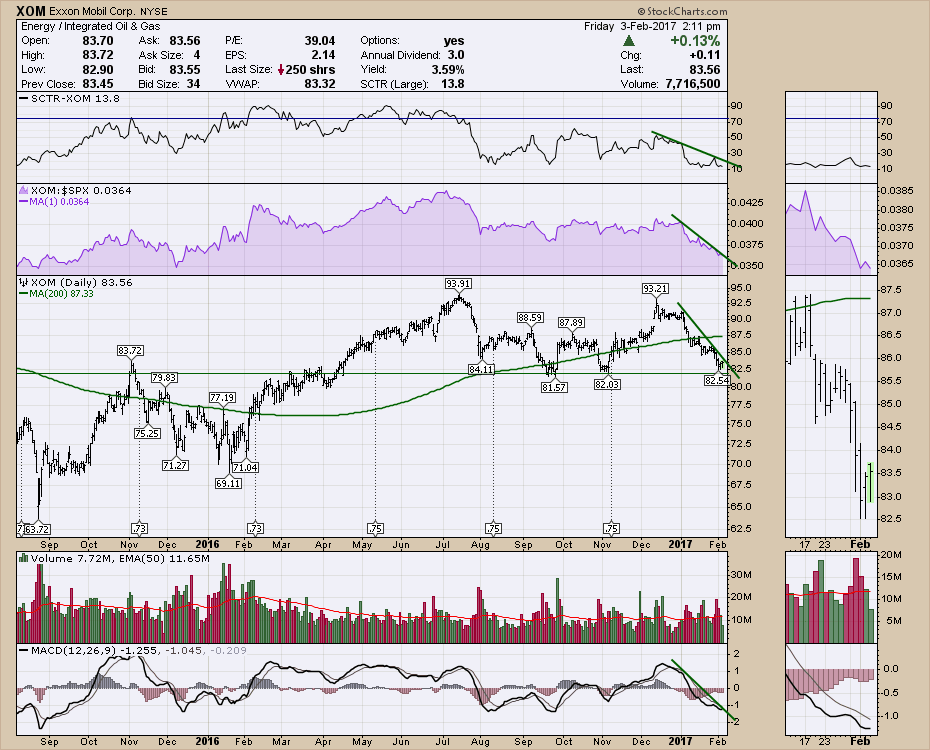
 Exxon Mobil (XOM) sits on support at $82.
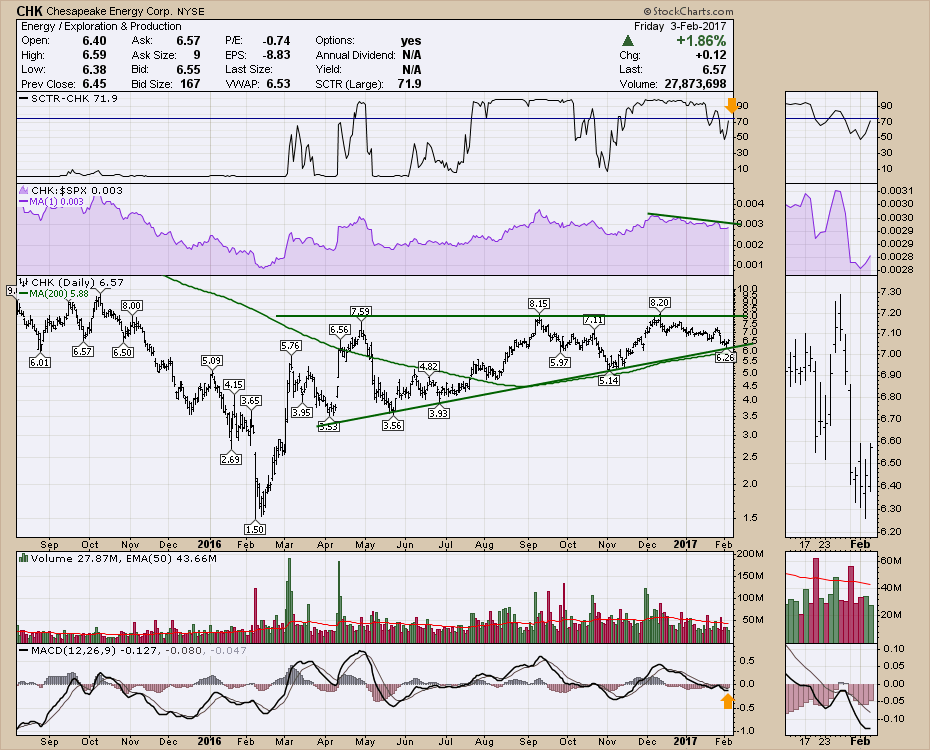
Chesapeake (CHK) is also at support.
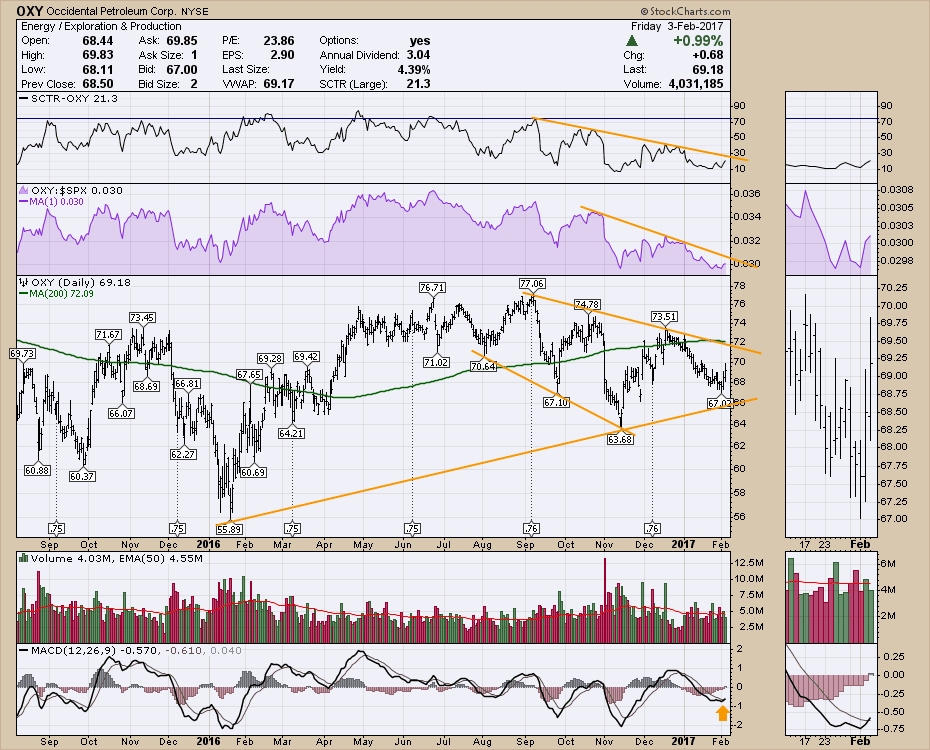
 Occidental Petroleum (OXY) looks to be making a much higher low on the MACD and we just got a confirmed cross.
 For investors buying pullbacks, this looks like a good area to expect a bounce. The real problem is why they are so weak with oil flat above $50? Is it just a rotation from Energy to Financials? I don't have the answer but if this $SPX rally finally breaks out to the high side, it will probably need energy to participate by moving up not down. Every one of these charts started pulling back while the $SPX went sideways. If this industry can start to rise up, we can probably start pushing the $SPX up to new highs that can hold.
Here is the webinar replay for Thursday February 2, 2017. I spent a large portion discussing the currency set up. For those long the $USD, the next few weeks should be interesting. All of the major currencies are up against significant resistance. The Yen at 90 ($XJY), the Euro at 108 ($XEU), the British Pound at 127.5 ($XBP), the Canadian Dollar at 77 ($CDW), and the Aussie Dollar at 77.5 ($XAD). The Yen chart has the MA moved to 65 as the Japanese like to use 65 WMA's. All that to say, all eyes are on the currency markets for the next dramatic move.
Commodities Countdown LIVE! with Greg Schnell - 2017-02-02 17:00 from StockCharts.com on Vimeo.
There is a lot more information on the webinar including a bearish engulfing monthly candle for the $USD for January.
I covered off bonds on the webinar briefly which leads me to the next item. The Educational component of my blog.
A StockCharts Tool Gem!
I want to make you aware of the Dynamic Yield curve. What does that mean, and why would you care?
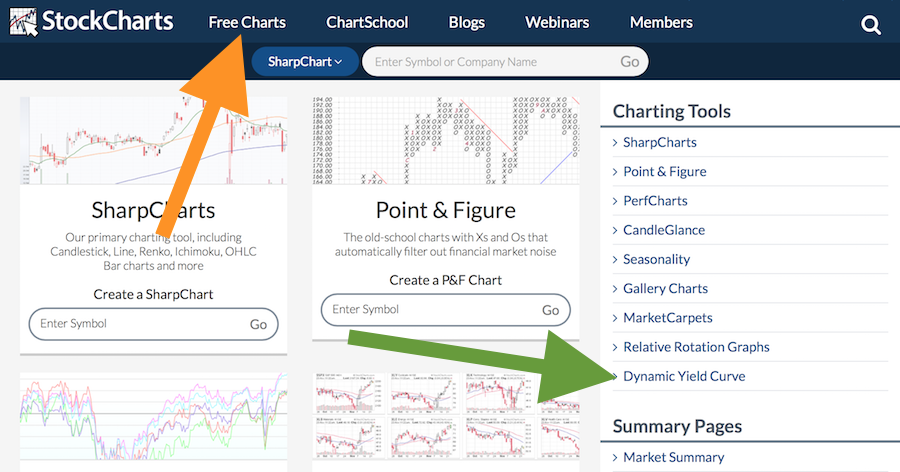
This is accessible from the FreeCharts tab (See orange arrow). Then click on Dynamic Yield Curve shown with a green arrow.
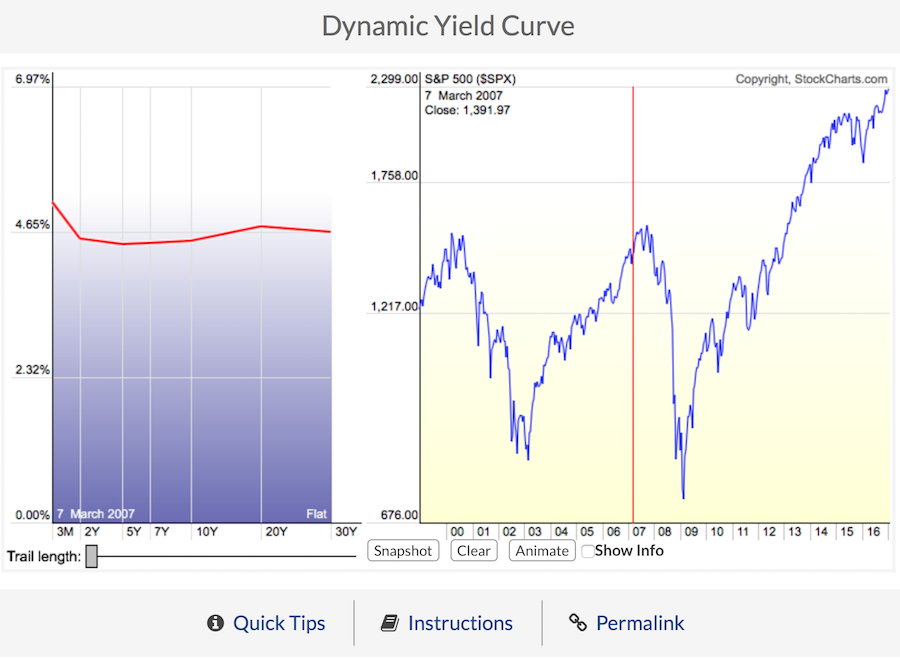
 This brings up a page that looks like the picture below. I have moved the red vertical bar in the picture on the right to early 2007 when we had an "inverted" yield curve. You can also move the red vertical bar around to see 'steepening' yield curves and normal yield curves. This will take the mystery out of the bond conversations on the business channels when they discuss steepening the yield curve and how that is good for banks.
Here is a link to the ChartSchool article about the Dynamic Yield Curve Tool.
My favorite is to hit the 'animate' button to see how the yield curve flattens and steepens automatically.
Work through some of the links and instructions. You can also bookmark this page with lots of other great links into a StockCharts bookmark folder in your web browser. This makes using StockCharts.com more like a cockpit where you land in other perspectives of the market. You can click on your bookmarks to check out all the different chart types that are not normal SharpCharts. By keeping a folder of them, you can rapidly look at what is happening in the market.
With that, have a good weekend! Watch for a ChartWatchers article this weekend with a gigantic announcement!
Good trading,
Greg Schnell, CMT, MFTA.
