While the Commodity markets were deeply oversold, the USD hit a 70 RSI on both Daily and Weekly charts. Perhaps this will spur a small bounce.
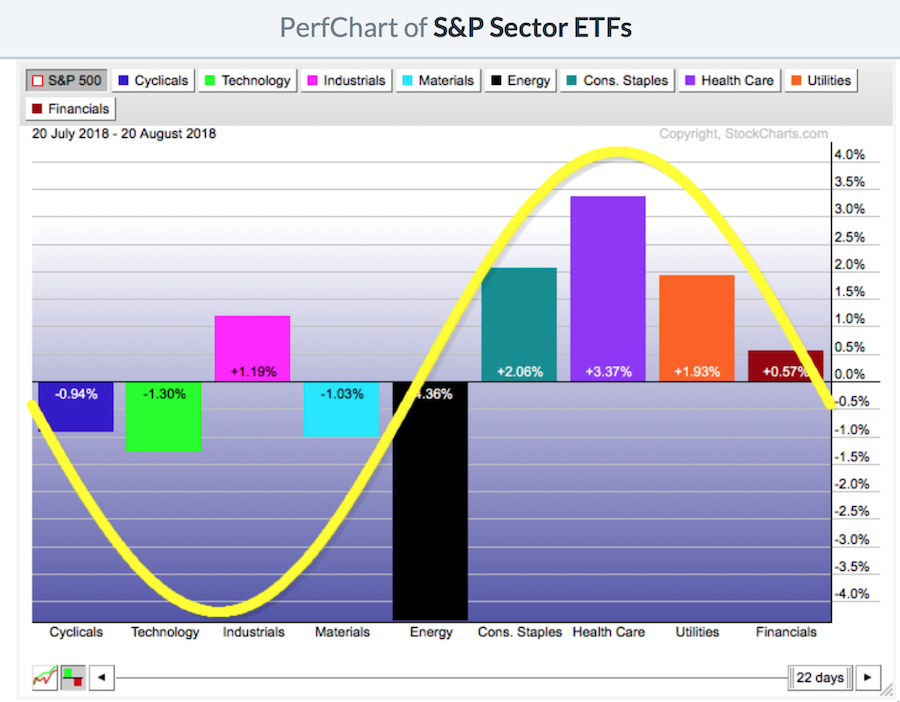
The overall markets are aligning very defensively as the $SPX tests prior highs. While it means some sectors are still working, other former leaders are struggling. The Perf Chart below is for the last 22 days relative to the $SPX.
Due to some technical problems within my computer, I am unable to annotate charts to go along with the video this week. So here is the video I recorded on Monday August 20th.
This Commodities Countdown video discusses the US Dollar, Oil, Gold and an update on Marijuana.
The Final Bar.
If you are missing intermarket signals in the market, follow me on Twitter and check out my Vimeo Channel often. Bookmark it for easy access!
Good trading,
Greg Schnell, CMT, MFTA
Senior Technical Analyst, StockCharts.com
Author, Stock Charts for Dummies
Want to read more from Greg? Be sure to follow his two StockCharts blogs:
Commodities Countdown and The Canadian Technician
