I'm going to give you jump on a ChartSchool article in the making on the DecisionPoint Thrust/Trend Model. Although Carl and I retired it from the DecisionPoint Market/Sector Summary, it is still available in the DecisionPoint Market Indicator ChartPack (free download!).
The Thrust/Trend Model is made up of two primary components, thrust and trend. Each component produces its own BUY/SELL signals, with the Trend Model sometimes triggering Neutral signals. The T/TM actually combines three different timing signals. Thrust is about momentum and internal strength; while, the Trend Model is about trend following timing signals.
In Part I, we will review the Trend Model. This will be a good refresher for DecisionPoint timing followers and a primer to those new to the Trend Model timing tool.
In Part II, I'll introduce you to the Percent Buy Index (PBI) and review the Price Momentum Oscillator (PMO), both of which make up the Thrust component.
In Part III, you will learn how to use both thrust and trend to produce T/TM signals. You'll also be able to weigh the benefits of using the model to refine your timing techniques.
The DecisionPoint Trend Model is reviewed in great detail in ChartSchool. Today, I will go over how signals are generated in the intermediate and long terms. The T/TM uses only intermediate- and long-term Trend Model signals so it is important to understand how they are generated.
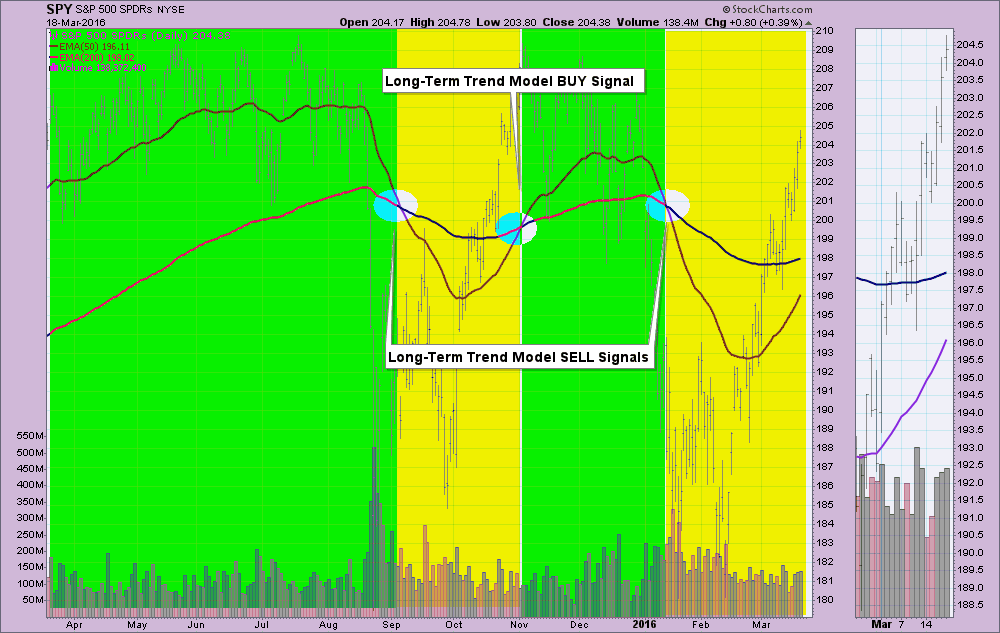
Long-Term Trend: The long-term trend can be determined using daily, weekly or monthly charts. As far as the Trend Model and Thrust/Trend Model, the long-term trend is determined by the location of the 50-EMA in relation to the 200-EMA. Simply put, the Long-Term Trend Model is on a BUY signal when the 50-EMA is above the 200-EMA and a SELL signal when the 50-EMA is below the 200-EMA. It is a simplistic model, but it is very useful for classifying bull and bear markets. In DecisionPoint analysis, a LTTM BUY signal indicates the index, stock, ETF, etc. is in a bull market (green) with the SELL signal indicating a bear market (yellow).
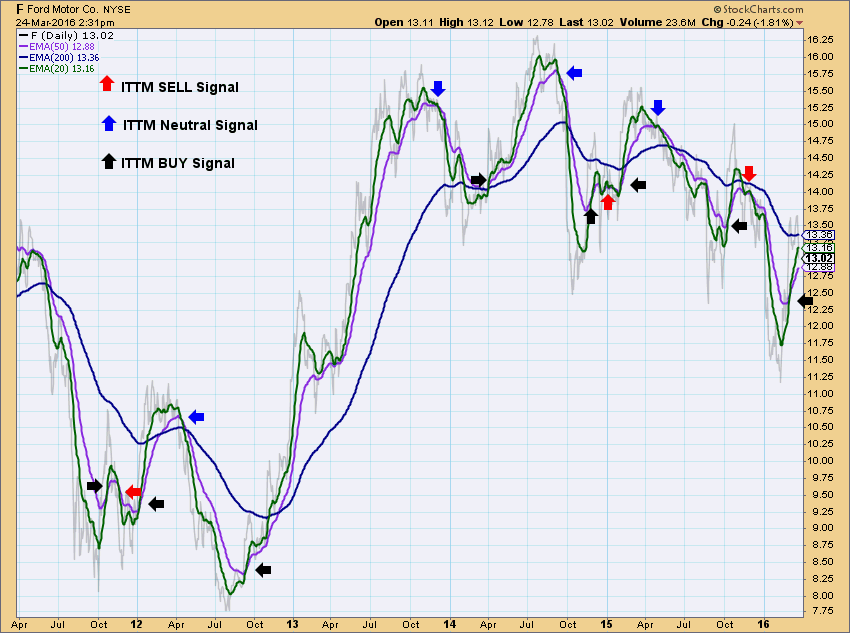
Intermediate Term Trend Model: The ITTM also triggers signals based on EMA crossovers. It gets a little more tricky because now we add Neutral signals to the mix. The signals on the ITTM are determined by 20/50-EMA crossovers. If the 20-EMA crosses above the 50-EMA, it is ALWAYS generates an ITTM BUY signal. However, if the 20-EMA crosses below the 50-EMA, a SELL or Neutral signal will be generated. How do you determine if it is a SELL or Neutral signal? In Alexander Elder's book "Trading for a Living" (available in the StockCharts Bookstore), he tells us that every timing model should have a long-term "screen". The ITTM uses this screen to differentiate between a SELL and a Neutral signal. The screen is the Long-Term Trend Model that I explained above. If the LTTM is on a BUY signal (50-EMA is above the 200-EMA), a negative 20/50-EMA crossover triggers a Neutral signal (cash or fully hedged). DecisionPoint reasoning is that we shouldn't expect a deep decline because the LTTM defines the current trend as bullish. If the LTTM is on a SELL signal (50-EMA below the 200-EMA) then the signal is a SELL because technically it is a bear market.
Now that you are familiar with the Long-Term and Intermediate-Term Trend Models, you now know how the "Trend Component" is determined as part of the Thrust/Trend Model.
NEXT WEEK in Part II: Thrust Component = PMO + PBI, measurement of momentum and internal strength.
Come check out the DecisionPoint Report with Erin Heim on Wednesdays and Fridays at 7:00p EST, a fast-paced 30-minute review of the current markets mid-week and week-end. The archives and registration links are on the Homepage under “What’s New”.
Technical Analysis is a windsock, not a crystal ball.
Happy Charting!
- Erin
