Don't Ignore This Chart! November 30, 2009 at 12:43 PM
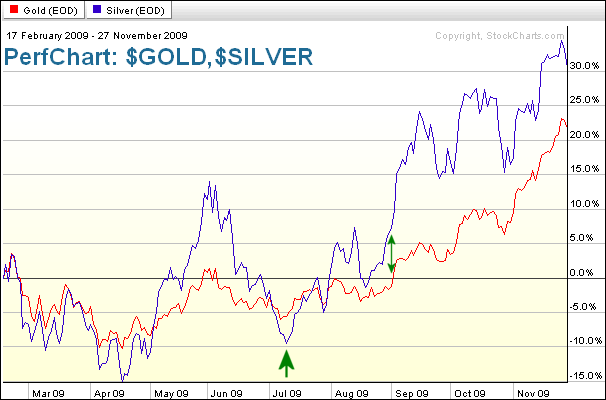
It has been a big year for gold, but an even bigger year for silver. As the Perfchart shows, $SILVER underperforms $GOLD on the way down and outperforms on the way up. Silver was down more than gold in April and July, but up more than gold in June and August... Read More
Don't Ignore This Chart! November 27, 2009 at 05:53 AM
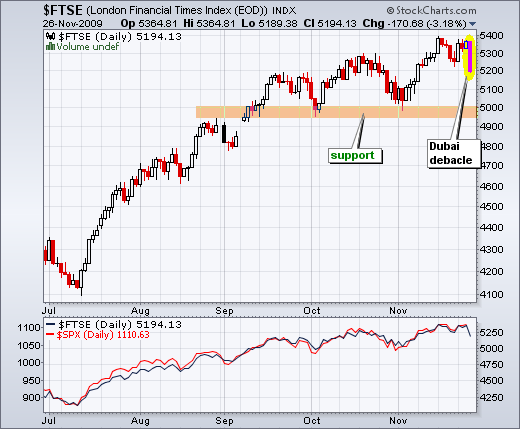
The London FTSE ($FTSE) dropped over 3% on the prospects of a sovereign default from Dubai. Even with this sharp decline, the medium-term trend is up as the index recorded a new reaction high just two weeks ago. Major support is set in the 4950-5000 area... Read More
Don't Ignore This Chart! November 25, 2009 at 08:20 AM
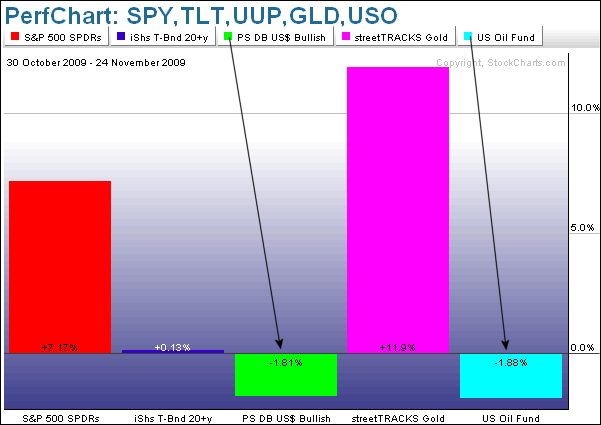
Despite strength in stocks and weakness in the Dollar, the US Oil Fund ETF (USO) is down for the month of November. It is not much, but it is still surprising and merits attention. Strength in stocks points to strength in the economy, which should increase demand for oil... Read More
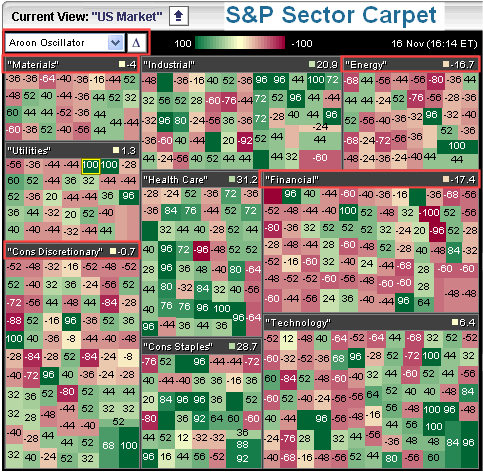
Don't Ignore This Chart! November 24, 2009 at 02:29 PM
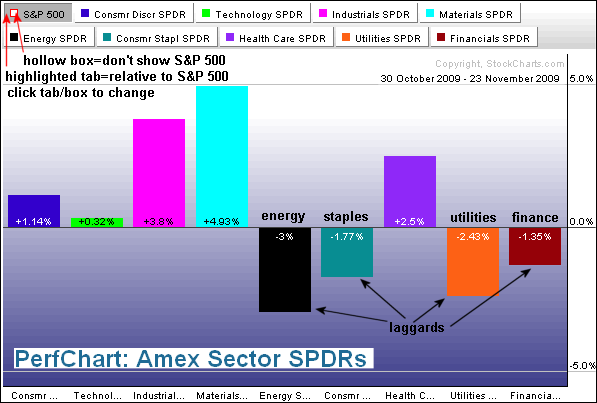
The sector PerfChart from 30-Oct to 23-Nov shows energy as the weakest of the nine sectors. The shaded S&P 500 tab means performance is measured relative to the S&P 500. The percentage changes are not absolute, but rather over or under performance relative to the S&P 500... Read More
Don't Ignore This Chart! November 23, 2009 at 12:52 PM
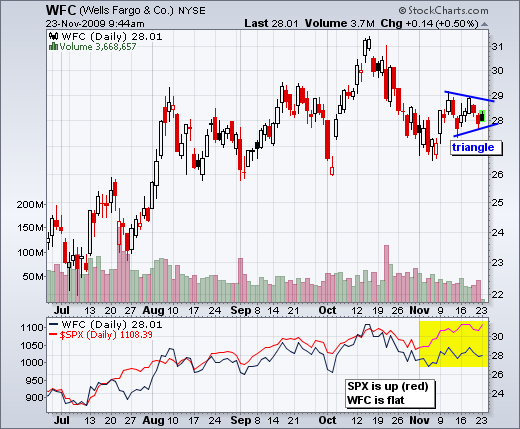
Even though the S&P 500 is up sharply over the last four weeks, Wells Fargo (WFC) is just flat and shows relative weakness. After a surge the first few days of November, WFC traded flat with a small triangle. Watch this neutral pattern for clues on the future... Read More
Don't Ignore This Chart! November 20, 2009 at 02:36 PM
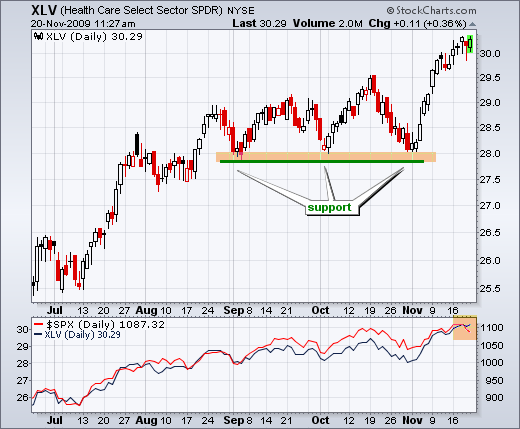
The Healthcare SPDR (XLV) broke above its October high two weeks ago and continued above 30 this week. Even though stocks were weak across the board on Thursday, healthcare managed to show relative strength with a smaller loss... Read More
Don't Ignore This Chart! November 19, 2009 at 01:21 PM
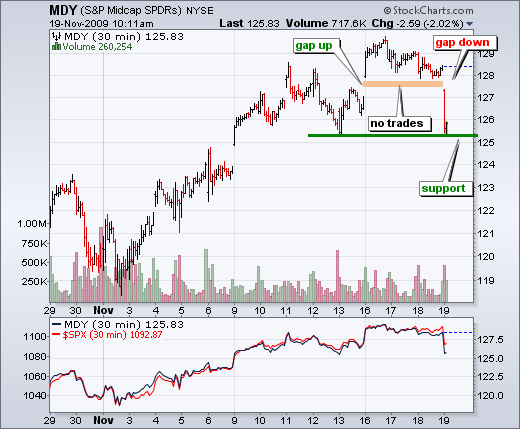
With a gap up on Monday and a gap down on Thursday morning, the S&P 400 MidCap ETF (MDY) has an island reversal working on the 30-minute chart. There were no trades around 127.6, which creates a floating island around 128... Read More
Don't Ignore This Chart! November 18, 2009 at 05:04 PM
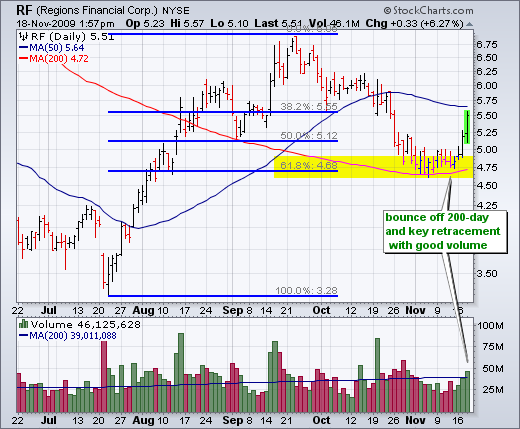
Regions Financial (RF) is showing signs of life with a high-volume bounce off the 200-day simple moving average and a key retracement. Notice that the Sep-Nov decline retraced a Fibonacci 62% of the Jul-Sep advance. The stock firmed around 4... Read More
Don't Ignore This Chart! November 17, 2009 at 01:48 PM
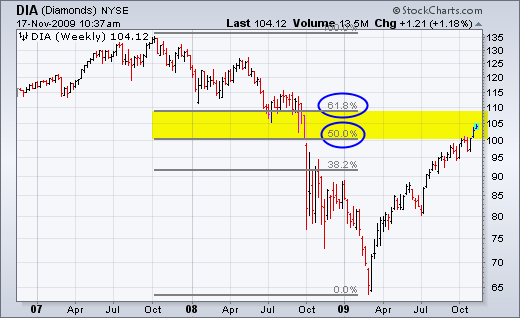
With the advance above 100, the Dow Diamonds (DIA) entered the 50-62% retracement zone. Such retracements can be measured using the Fibonacci Retracements Tool on Sharpcharts. These zones can mark resistance areas and price action merits a close watch... Read More
Don't Ignore This Chart! November 16, 2009 at 07:48 PM
Friday's mailbag answered questions on the Aroon oscillator, which is a trend identification indicator. Basically, a strong uptrend exists when the oscillator is above +50 and a strong downtrend exists when the oscillator is below -50... Read More
Don't Ignore This Chart! November 13, 2009 at 12:20 PM
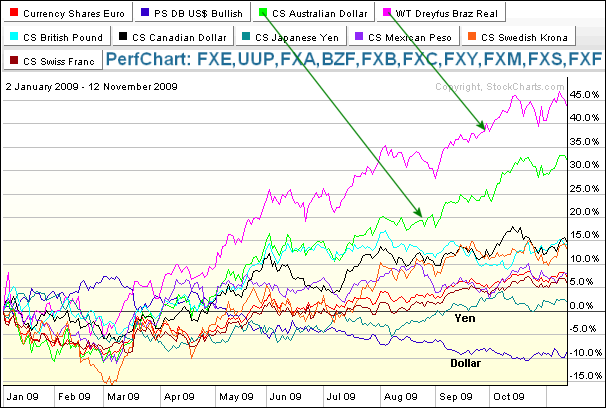
Year-to-date, the WT Brazilian Real Fund (BZF) and the CS Australian Dollar Trust (FXA) are by far the top performing currency ETFs. Of these 10 currency ETFs, only the DB Dollar Bullish ETF (UUP) is in negative territory... Read More
Don't Ignore This Chart! November 12, 2009 at 01:27 PM
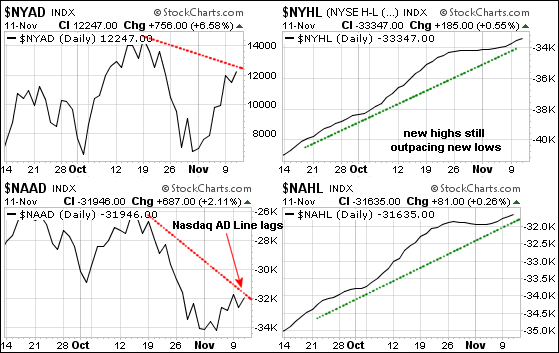
With the surge over the last 1-2 weeks, the NY Composite and the Nasdaq are both trading back near their October highs. However, the Nasdaq AD Line remains well below its October high and shows some relative weakness... Read More
Don't Ignore This Chart! November 11, 2009 at 06:25 AM
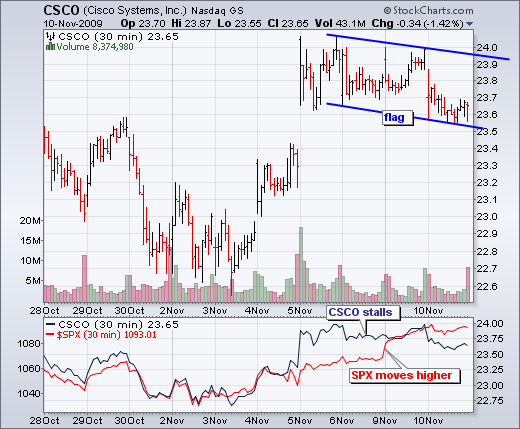
Cisco (CSCO) led the market higher with a big move above 24 last week. While the S&P 500 continued higher the last three days, Cisco stalled with a falling flag taking shape. Bullish flags slope down and form after a sharp advance... Read More
Don't Ignore This Chart! November 10, 2009 at 12:40 PM
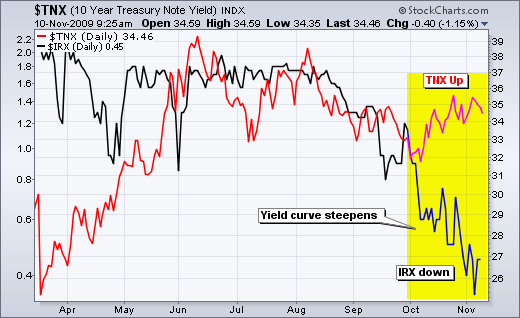
The difference between the 10-Year Treasury Yield ($TNX) and the 3-month Treasury Yield ($IRX) widened significantly since early October. Short-term rates fell ($IRX), while long-term rates rose ($TNX). As a result, the yield curve is the steepest it's been in months... Read More
Don't Ignore This Chart! November 09, 2009 at 07:46 PM
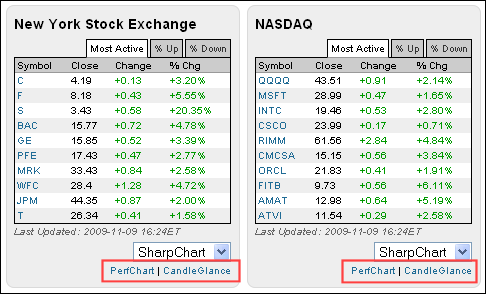
The 10 most active stocks on both the NYSE and Nasdaq are all up, and up big. In the middle of the stockcharts.com home page, you can follow the most actives throughout the day... Read More
Don't Ignore This Chart! November 06, 2009 at 01:19 PM
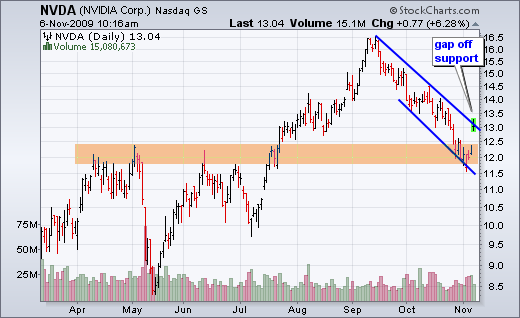
Broken resistance turns into support. This is a classis tenet of technical analysis. Nvidia (NVDA) broke resistance around 12-12.5 in July and returned to this breakout area in late October. Notice that I drew a zone. Support and resistance levels are rarely exact... Read More
Don't Ignore This Chart! November 05, 2009 at 07:28 AM
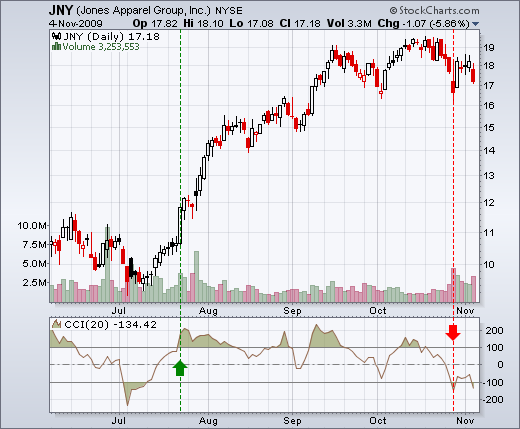
On the Stockcharts.com scan page for Wednesday evening, there were 20 CCI sell signals among NYSE stocks. A CCI sell signal occurs with a plunge below -100. Conversely, a CCI buy signal triggers with a surge above +100... Read More
Don't Ignore This Chart! November 04, 2009 at 01:31 PM
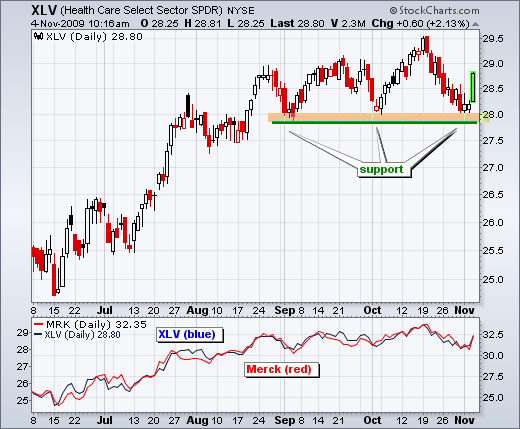
With help from component Merck, the Healthcare SPDR (XLV) bounced off support around 28. The ETF established support here with reaction lows in early September, early October and now early November... Read More
Don't Ignore This Chart! November 03, 2009 at 01:38 PM
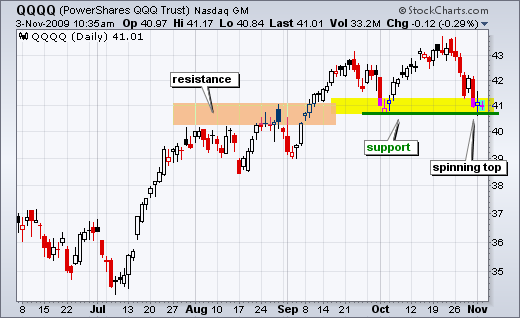
After a sharp decline the prior two weeks, the Nasdaq 100 ETF (QQQQ) turned indecisive with a spinning top on Monday. This candlestick reflects a wide high-low range during the day, but little change from open to close. QQQQ surged above 41.5 in early trading, plunged below 40... Read More
Don't Ignore This Chart! November 02, 2009 at 01:19 PM
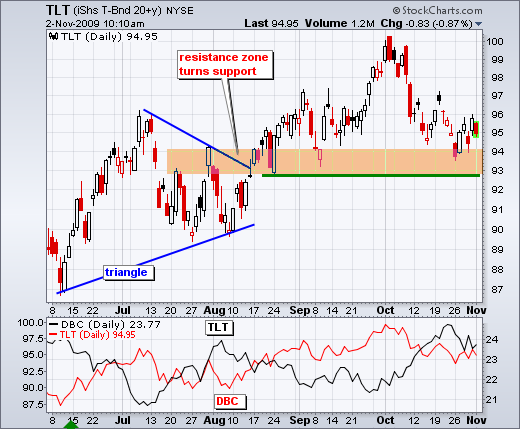
The 20+ Year Treasury ETF (TLT) bounced off support last week, but fell today as the ISM Manufacturing Survey surged to 55.7. Readings above 50 favor economic expansion. Bonds fell and the 10-Year Treasury Yield ($TNX) rose with this positive economic news... Read More