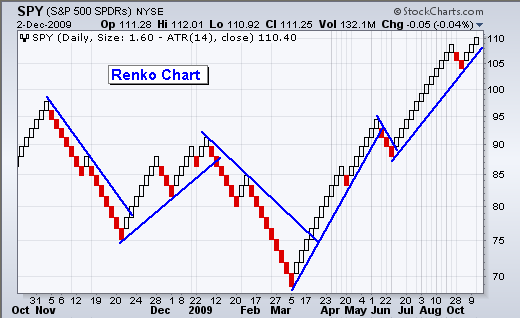
The chart below shows a
Renko chart for the S&P 500 ETF (SPY). Like Point & Figure, these charts focus on price action, independent of time. Notice that the first half of the chart extends from late October 2008 to early March 2009. The second half extends from early March to early December. A big uptrend is underway with trendline support at 108.
Renko charts are available under "Chart Attributes" and "Type. You can also adjust the ATR to change the size of the Renko boxes, which affects the reversals.

About the author:
Arthur Hill, CMT, is the Chief Technical Strategist at TrendInvestorPro.com. Focusing predominantly on US equities and ETFs, his systematic approach of identifying trend, finding signals within the trend, and setting key price levels has made him an esteemed market technician. Arthur has written articles for numerous financial publications including Barrons and Stocks & Commodities Magazine. In addition to his Chartered Market Technician (CMT) designation, he holds an MBA from the Cass Business School at City University in London.
Learn More

