Don't Ignore This Chart! November 29, 2013 at 01:23 PM
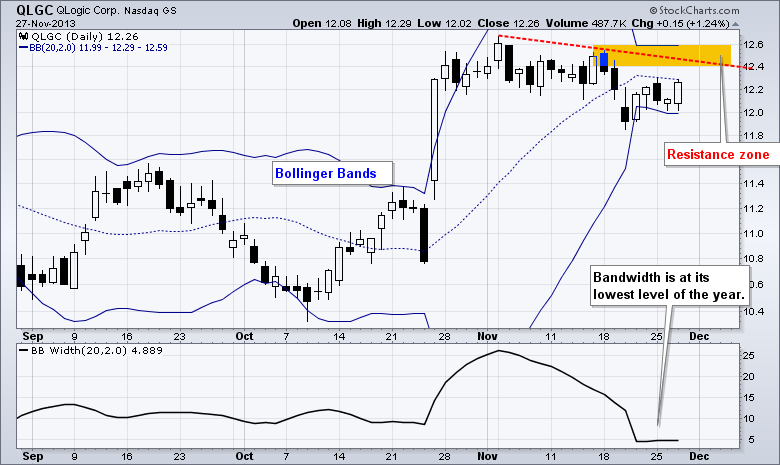
After a big surge in October, Qlogic (QLGC) moved into a consolidation as volatility contracted. Notice that the Bollinger Bands contracted and the Bandwidth moved to its lowest level of the year... Read More
Don't Ignore This Chart! November 27, 2013 at 05:37 PM
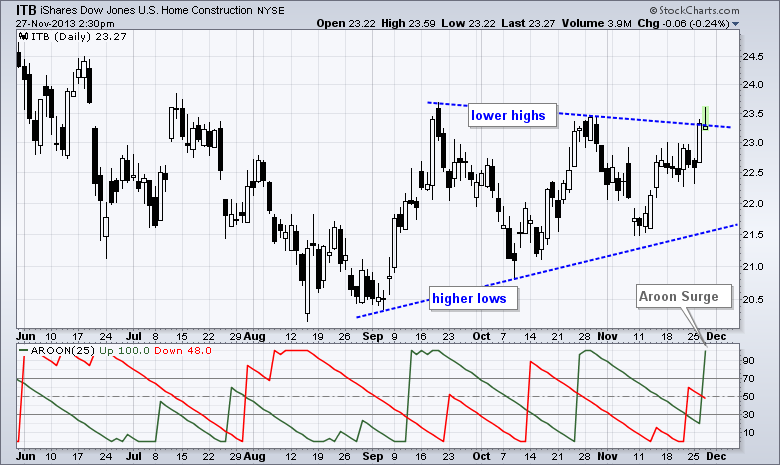
The Home Construction SPDR (ITB) is making a bid to break resistance as Aroon Up surges above Aroon Down. Also notice that Aroon Up hit 100, which suggests that a new uptrend may be emerging... Read More
Don't Ignore This Chart! November 26, 2013 at 01:04 PM
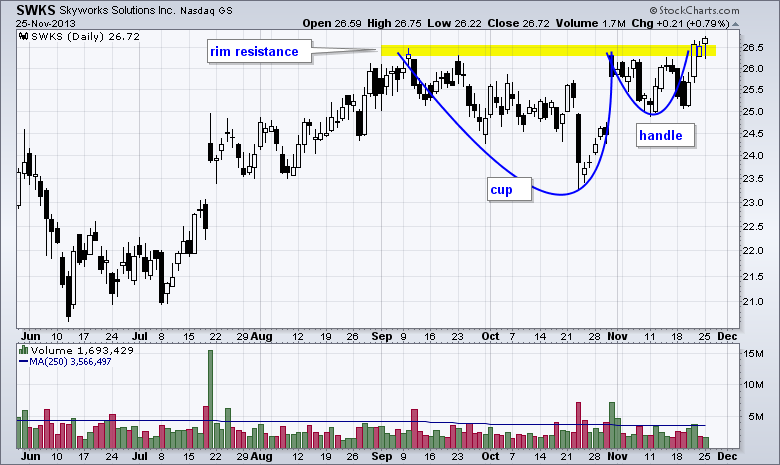
The cup-with-handle pattern is a bullish continuation pattern that was popularized by William O'Neil of IBD. The handle marks a small consolidation near resistance and the breakout confirms the pattern... Read More
Don't Ignore This Chart! November 25, 2013 at 12:59 PM
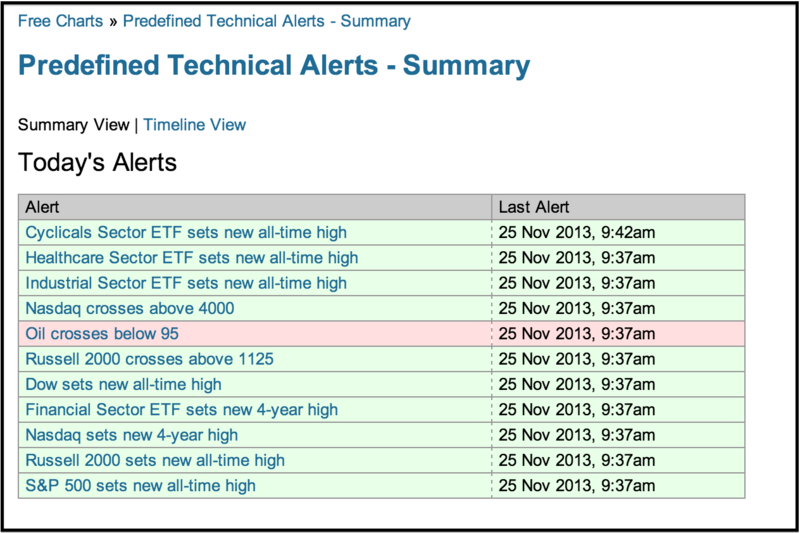
Stocks opened higher on Monday with several ETFs hitting new highs and new all time highs. Chartists can follow these milestones on the Predefined Technical Alerts page. In addition to several major stock indices, note that XLY, XLV, XLI and XLF recorded new highs on Monday... Read More
Don't Ignore This Chart! November 22, 2013 at 06:12 AM
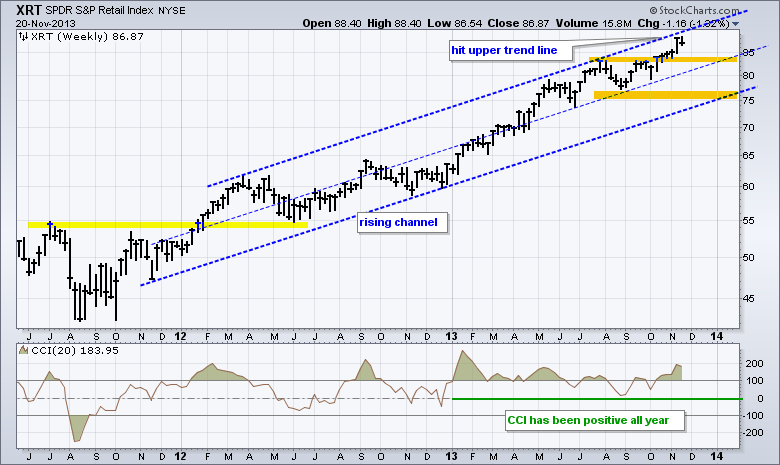
The Retail SPDR (XRT) has been one of the strongest industry group ETFs this year with a 25+ percent advance. Even though the ETF is looking overextended as it hits the upper trend line of a rising channel, it is by no means weak... Read More
Don't Ignore This Chart! November 21, 2013 at 12:01 PM
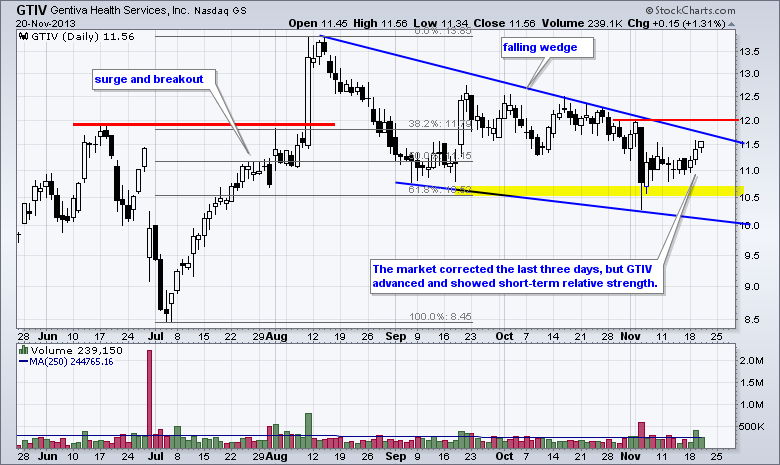
The healthcare sector is one of the strongest sectors in the market, but Gentiva (GTIV) has lagged and failed to keep pace. Even though the stock is in a medium-term downtrend, this decline could be a correction. Notice how the decline formed a falling wedge and retraced 62%... Read More
Don't Ignore This Chart! November 20, 2013 at 08:46 PM
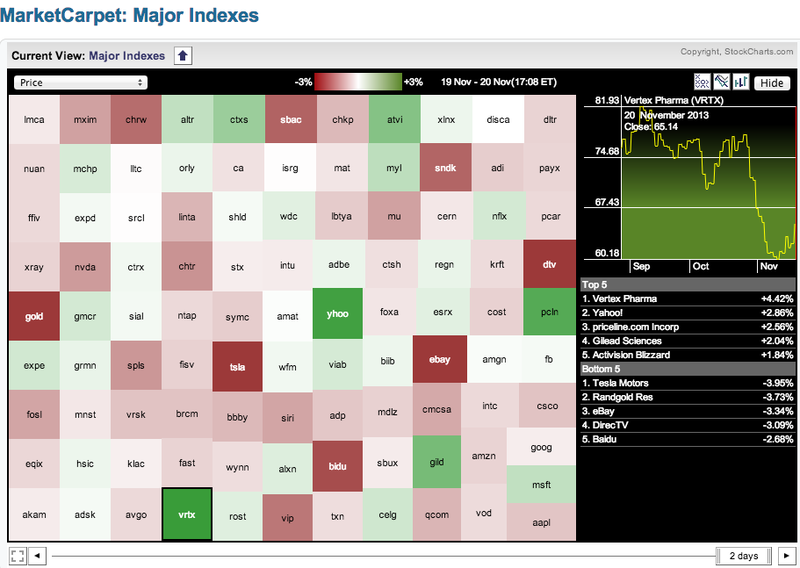
The Nasdaq 100 MarketCarpet was mixed on Wednesday with several big losers and a handful of strong gainers. The dark green boxes show big gains in Yahoo! (YHOO), Vertex (VRTX), PriceLine (PCLN) and Gilead Science (GILD)... Read More
Don't Ignore This Chart! November 19, 2013 at 02:51 PM
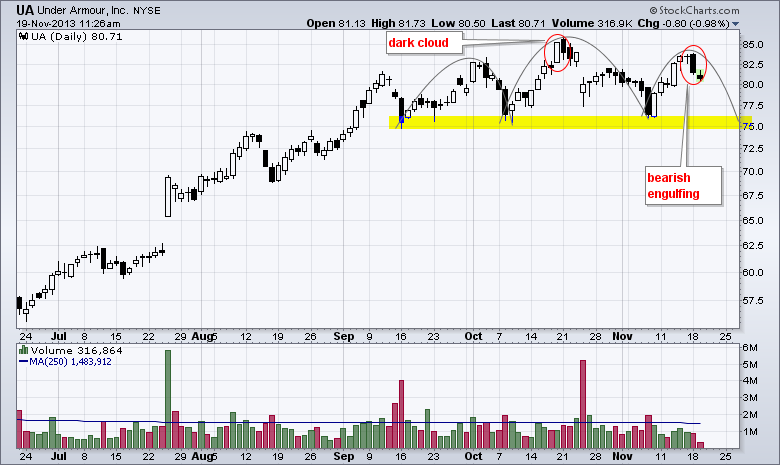
Under Armour (UA) is currently in a long-term uptrend, but the stock stalled over the last three months with a head-and-shoulders pattern taking shape. The right shoulder is under construction with a bearish engulfing marking the high... Read More
Don't Ignore This Chart! November 18, 2013 at 02:54 PM
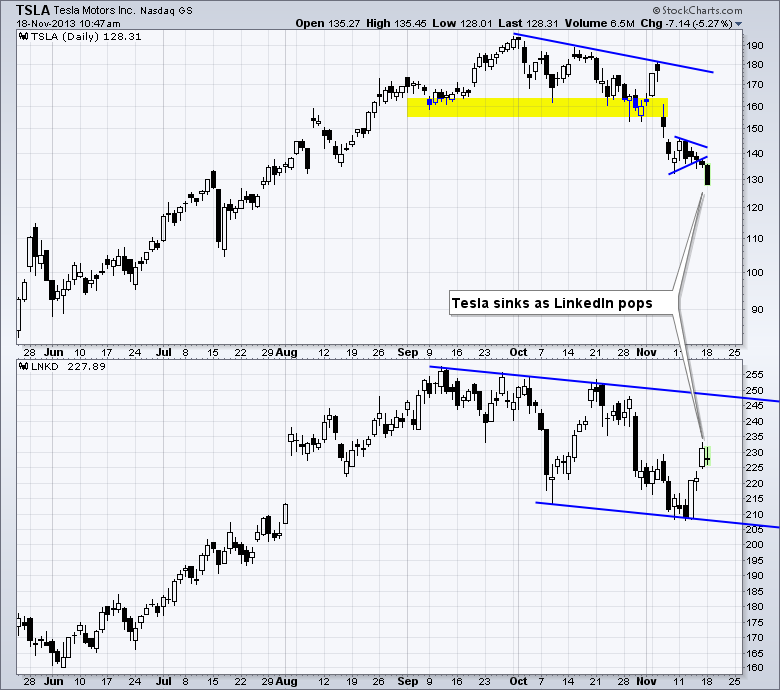
There was a time when LinkedIn (LNKD) and Tesla (TSLA) were joined at the hip and led the momentum crowd. Both stocks surged from January to September and then corrected from early October to mid November... Read More
Don't Ignore This Chart! November 15, 2013 at 10:04 AM
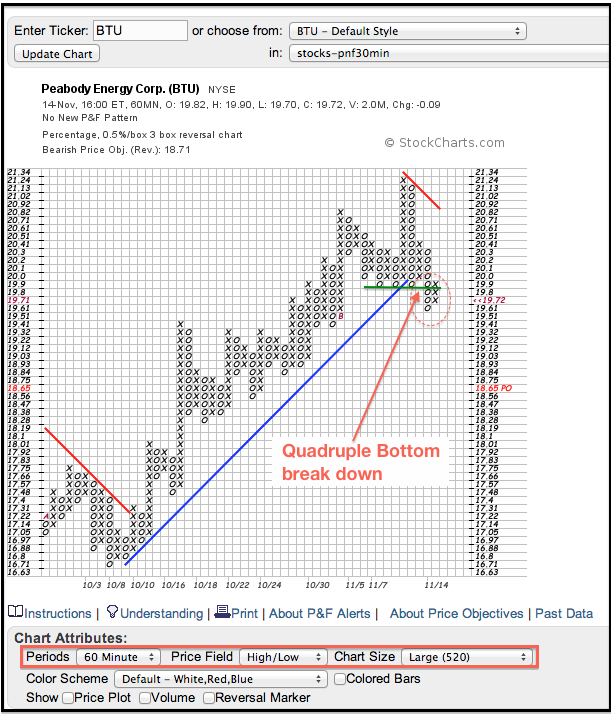
Coal stocks were hit with selling pressure after the TVA announced the closing of eight coal-fired power plants. The 60-minute P&F chart shows BTU breaking Quadruple Bottom support and sporting a downside price objective of 18.65... Read More
Don't Ignore This Chart! November 14, 2013 at 12:15 PM
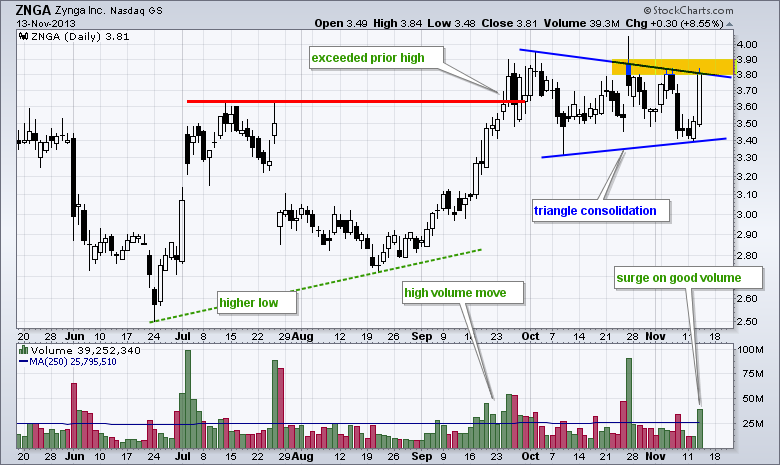
After a bullish engulfing on Tuesday, Zynga (ZNGA) surged to triangle resistance with high volume on Wednesday. Overall, chartists can make a bullish case for this internet-mobile gaming company... Read More
Don't Ignore This Chart! November 13, 2013 at 07:33 PM
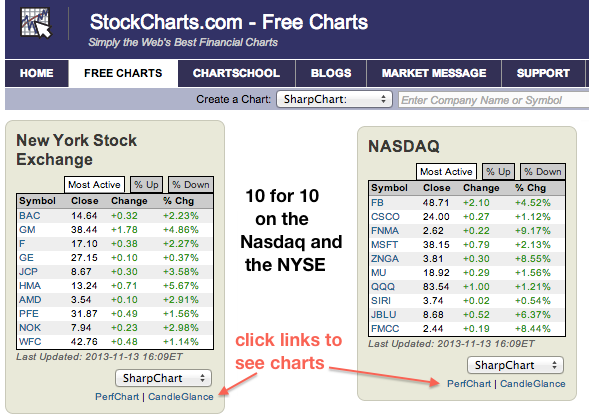
It was a big day for stocks as the ten most active stocks on the NYSE and Nasdaq advanced. As the Free Charts page shows, both exchanges went ten for ten. Bank of America (BAC) led the NYSE with a 2+ percent gain. Facebook (FB) led the Nasdaq with a 4+ percent gain... Read More
Don't Ignore This Chart! November 12, 2013 at 11:15 AM
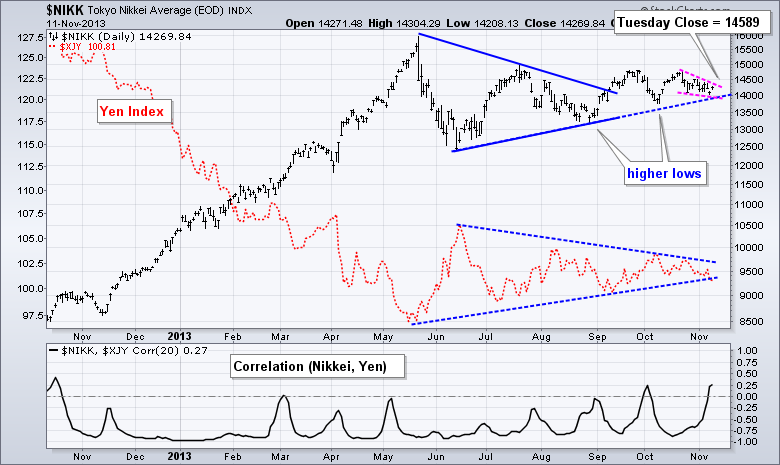
The Nikkei 225 ($NIKK) broke above wedge resistance with a surge to 14589 and extended its long-term uptrend. First, note that the long-term trend is up after the big surge from November to May... Read More
Don't Ignore This Chart! November 11, 2013 at 04:25 PM
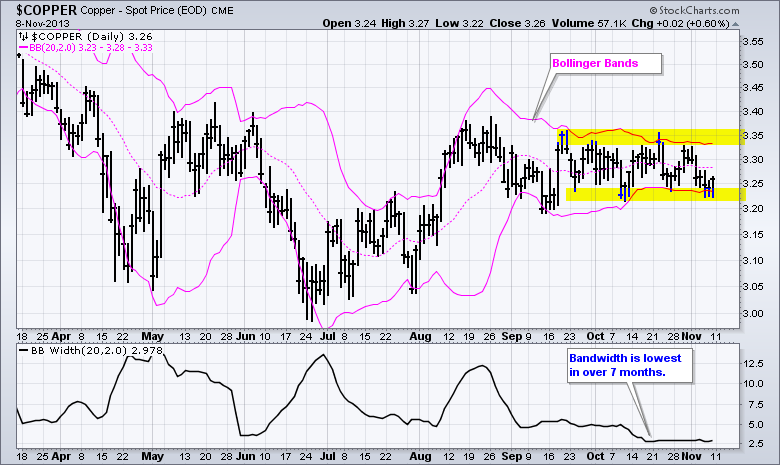
Spot Copper ($COPPER) has gone nowhere the last three months and a narrowing consolidation is taking shape. The pink lines show the Bollinger Bands narrowing as volatility contracts. This is confirmed by the bandwidth indicator, which is trading near seven month lows... Read More
Don't Ignore This Chart! November 08, 2013 at 11:03 AM
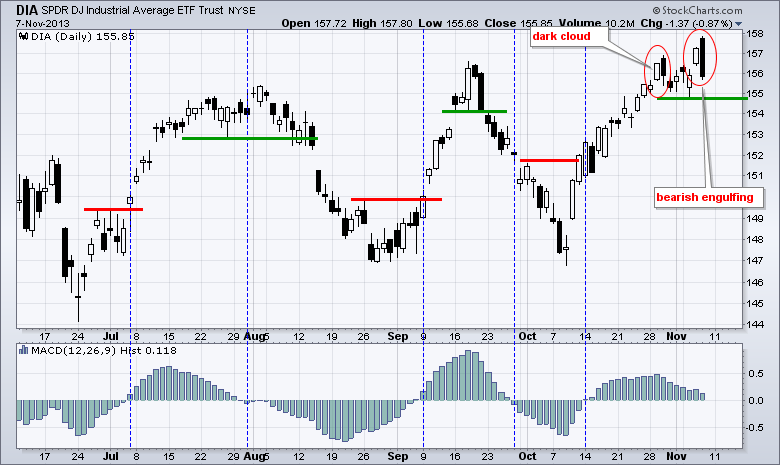
There are bearish engulfing patterns and then there are BEARISH ENGULFING PATTERNS. With a strong open and weak close on Thursday, the Dow SPDR (DIA) formed the latter. This is the second bearish candlestick pattern in two weeks... Read More
Don't Ignore This Chart! November 07, 2013 at 02:51 PM
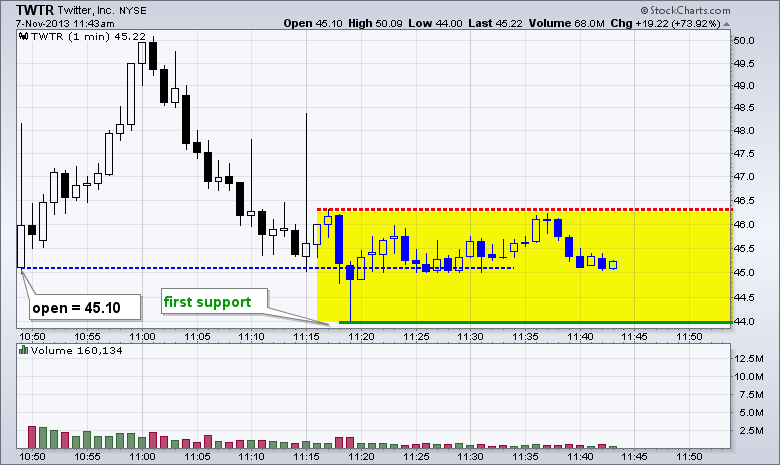
There is not much historical data for Twitter (TWTR) because it opened for trading just today. However, there are already signs of support near the opening price. The 1-min chart shows TWTR opening at 45.10, surging to 50 and then falling back to the 45 area... Read More
Don't Ignore This Chart! November 06, 2013 at 01:08 PM
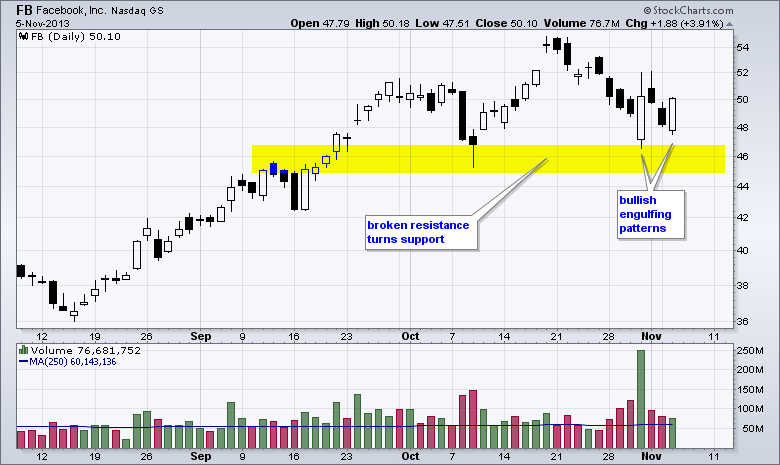
Facebook (FB) came across the bullish engulfing scan twice in the last four days. The stock fell to support last week and then formed a big bullish engulfing pattern on high volume... Read More
Don't Ignore This Chart! November 05, 2013 at 02:01 PM
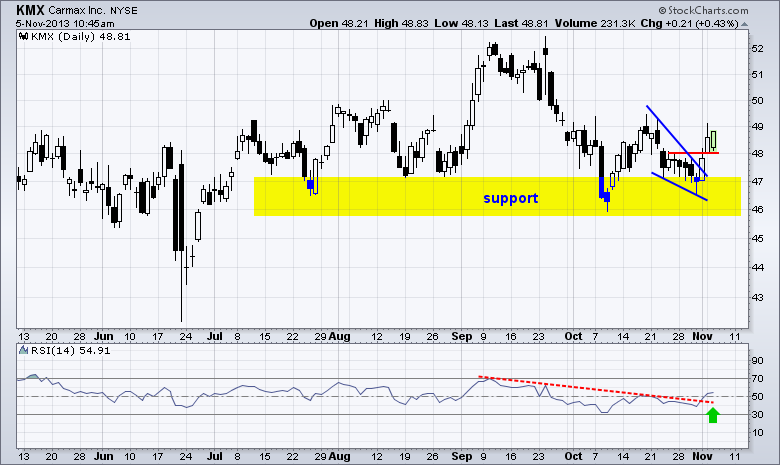
Carmax is making a move as it bounces off support and breaks wedge resistance. Support in the 46-47 area extends back to the July low. The breakout is valid as long as it holds and I would watch 47.6 for the first signs of failure... Read More
Don't Ignore This Chart! November 04, 2013 at 08:27 PM
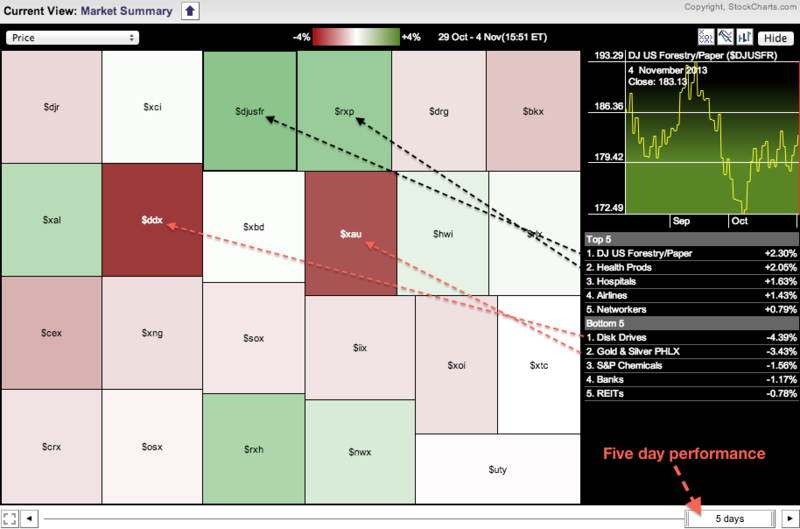
The Market Carpet shown here focuses on the US industry groups from the Market Summary Market. Chartists can focus on a particular section of a Market Carpet by double clicking a square... Read More
Don't Ignore This Chart! November 01, 2013 at 11:26 AM
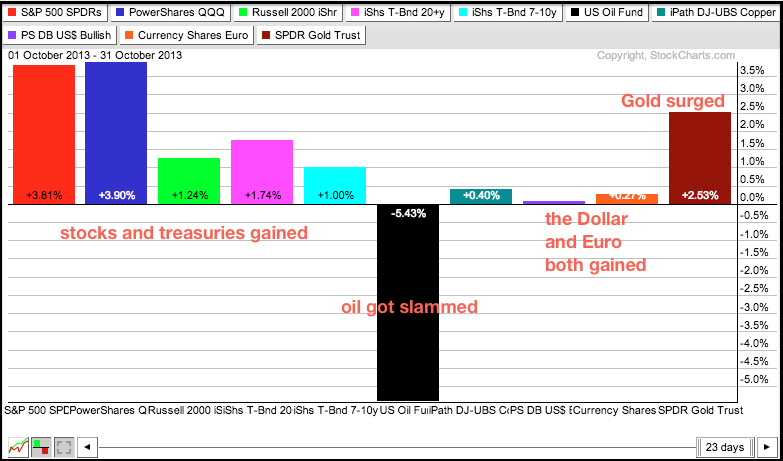
This PerfChart shows ten ETFs that cover the intermarket picture. Notice that nine of the ten moved higher with stocks and gold leading the way. Oil was hit the hardest with a 5+ percent loss. In a surprise, the Dollar and the Euro both gained... Read More