Don't Ignore This Chart! January 31, 2014 at 05:53 PM
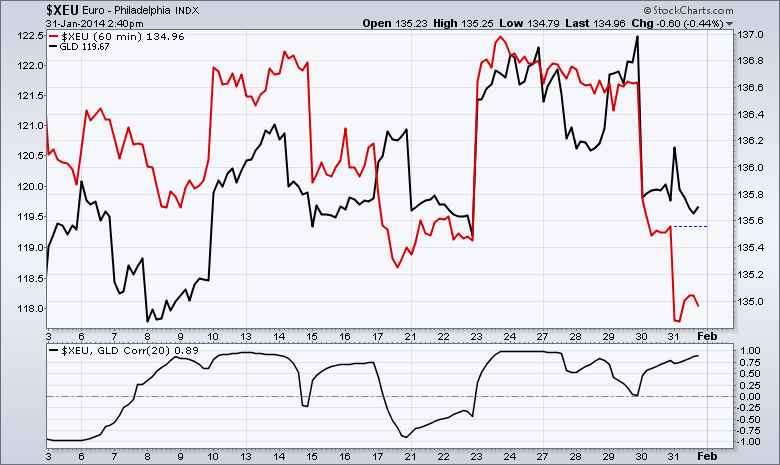
Well, a shaky January comes to a close. The discussion of deflation and commodities is front and centre. Check out this Euro and GLD chart. Look at how closely they correlate in January. You can see the correlation down below is very strong... Read More
Don't Ignore This Chart! January 31, 2014 at 09:47 AM
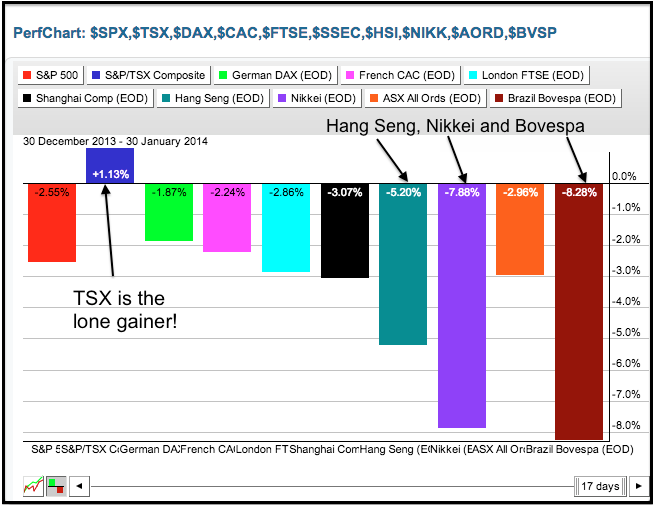
It has been a rough year for global equity markets, but the S&P/TSX Composite ($TSX) is bucking the trend with a small gain year-to-date... Read More
Don't Ignore This Chart! January 30, 2014 at 03:12 PM
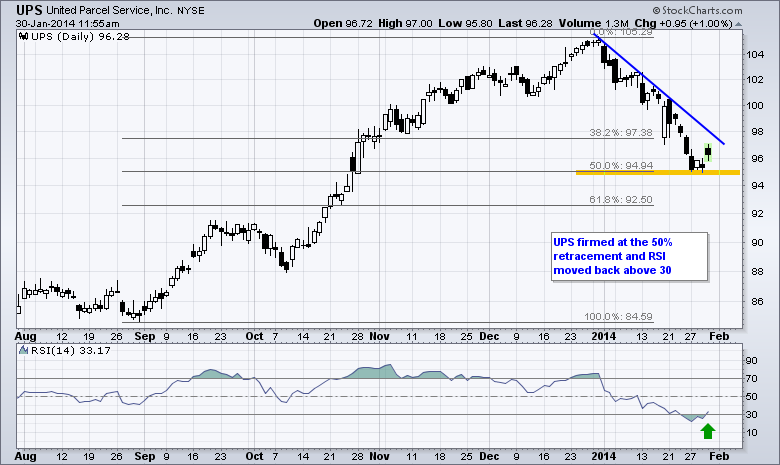
After a sharp decline the last three days, the stock market was oversold and ripe for a bounce. Looking through the predefined scans page, chartists can find a great scan for this situation, such as the "oversold with an improving RSI" scan... Read More
Don't Ignore This Chart! January 29, 2014 at 06:10 PM
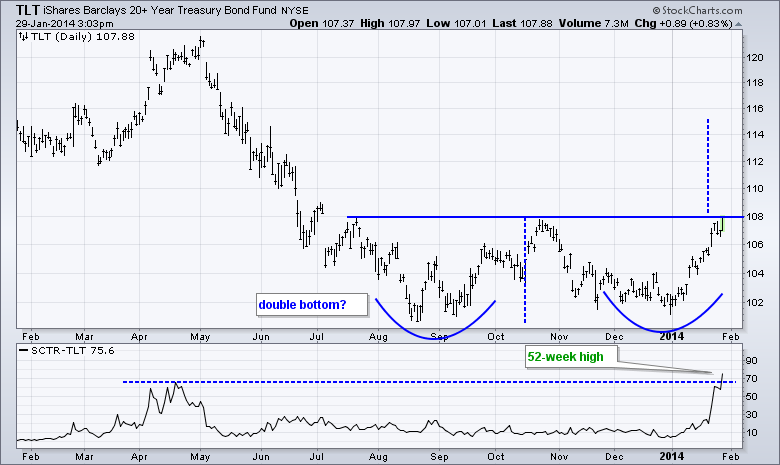
The 20+ YR T-Bond ETF (TLT), which is one of the best performing ETFs this year, is challenging its October high after a 5+ percent advance this year. The double bottom lows are around 101 and resistance is set at 108... Read More
Don't Ignore This Chart! January 29, 2014 at 01:25 PM
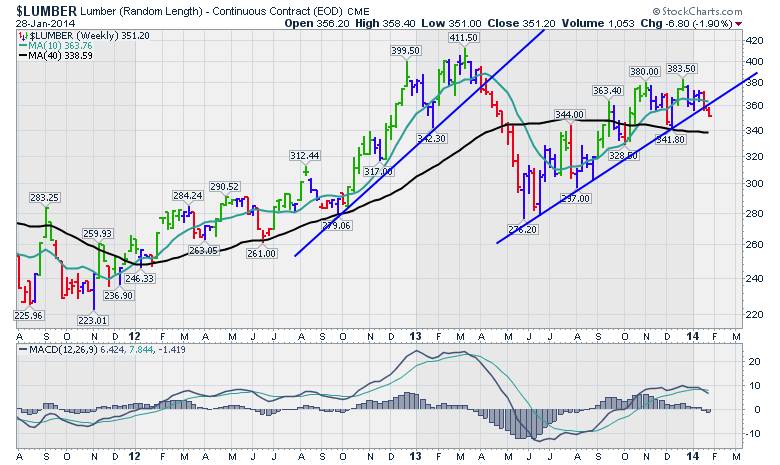
$LUMBER has been a great story for the last 5 years. However, the roller coaster has been difficult for investors to watch. It's been a traders market. This week, we got a signal on the $LUMBER chart... Read More
Don't Ignore This Chart! January 29, 2014 at 12:09 AM
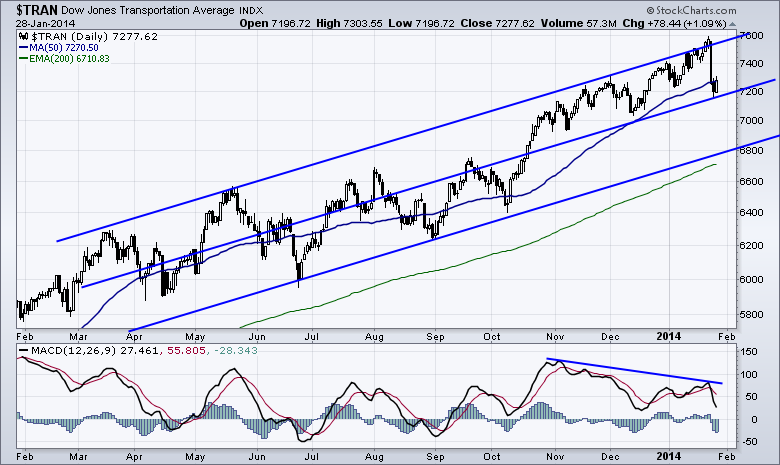
The Transport Index is very interesting here. The divergence showing on the right hand side marked in blue looks very negative. But on the slope of the transport index, this might just mean a move to the bottom of the channel... Read More
Don't Ignore This Chart! January 28, 2014 at 05:34 AM
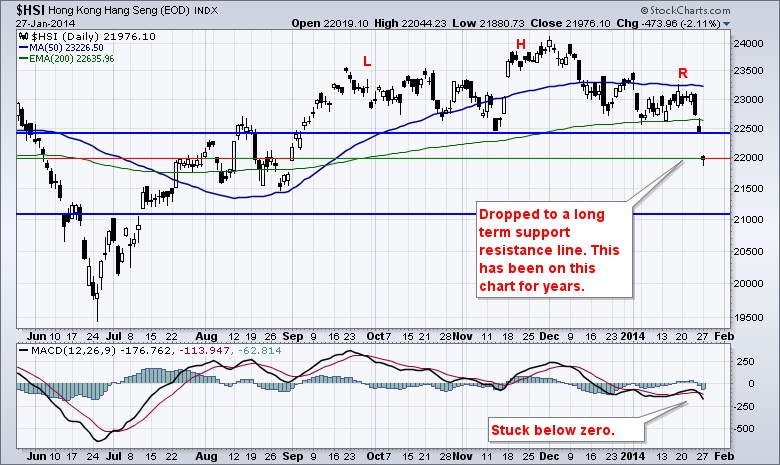
Recently, the Hang Seng has been building a broadening top formation. We'll call it a Head/Shoulders pattern. Note the loss of the 200 DMA again. What is more interesting are the lines on the chart. Those lines have been there for years... Read More
Don't Ignore This Chart! January 27, 2014 at 03:35 PM
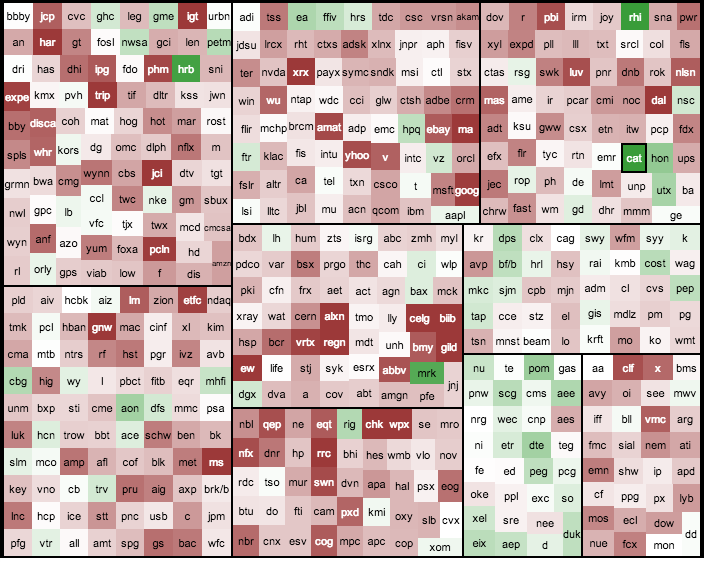
The Sector Carpet is mostly red on Monday, but pockets of green can be seen within the utilities sector as money moves into this defensive area of the market. Pepco Holdings (POM) is leading the group with a 1.5% gain... Read More
Don't Ignore This Chart! January 24, 2014 at 01:17 PM
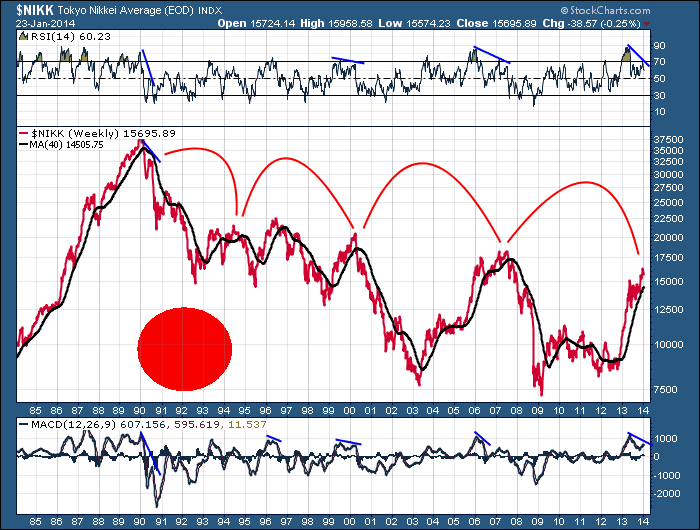
One of the important technical advantages that a technician can use to prevent losses is by studying how parabolic moves fail. Here is a long term chart of the $NIKK in Japan... Read More
Don't Ignore This Chart! January 24, 2014 at 08:43 AM
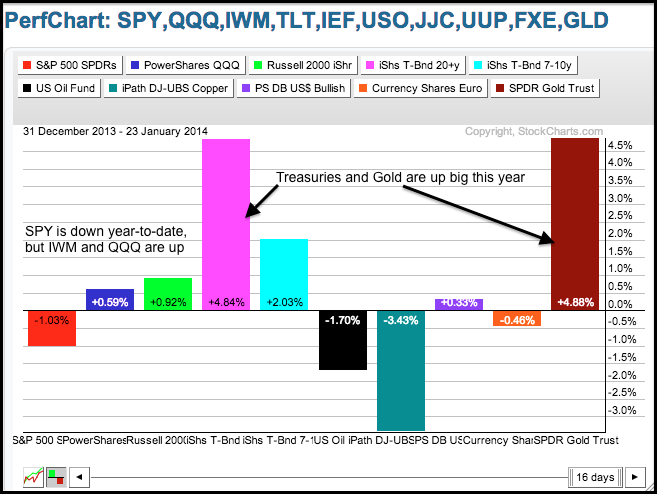
The stock market finished strong in 2013, but has not been able to gain much traction in 2014. Instead, money has moved into the Gold SPDR (GLD) and the 20+ YR T-Bond ETF (TLT). The intermarket PerfChart shows TLT and GLD with 4+ percent gains year-to-date... Read More
Don't Ignore This Chart! January 23, 2014 at 02:57 PM
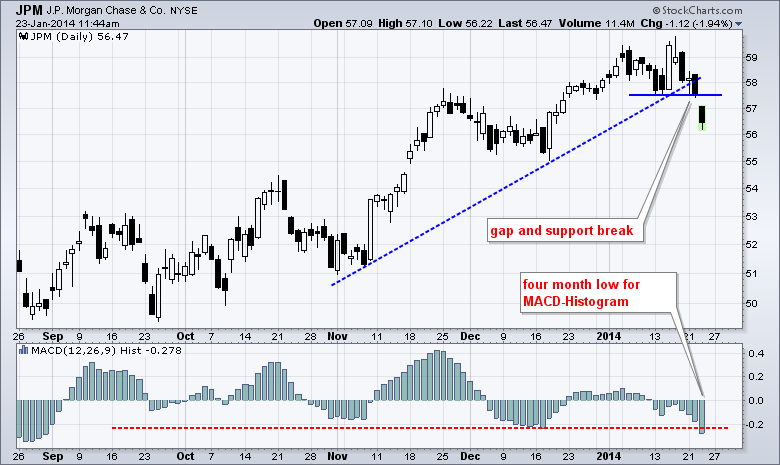
JP Morgan (JPM) is leading the finance sector lower on Thursday with a gap and support break. This gap should be considered a breakaway gap as long as it remains unfilled. The indicator window shows the MACD Histogram moving to its lowest level in over four months... Read More
Don't Ignore This Chart! January 22, 2014 at 03:54 PM
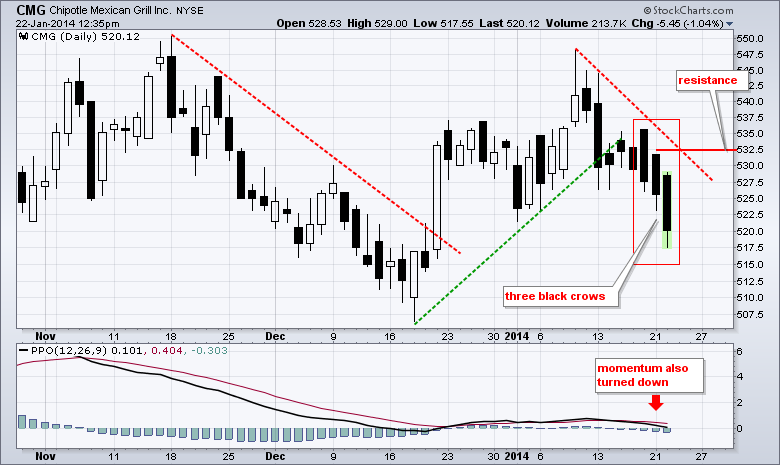
Momentum darling Chipotle (CMG) has come under selling pressure with eight filled candlesticks in a row. A filled, or black, candlestick forms when the close is below the open, which indicates selling pressure after each open... Read More
Don't Ignore This Chart! January 21, 2014 at 12:23 PM
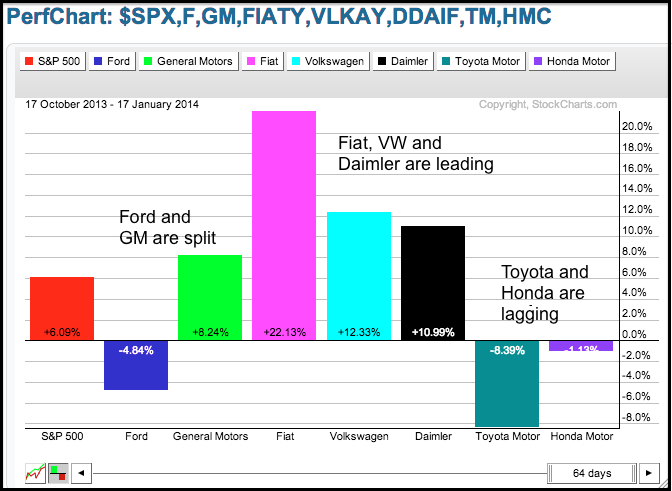
The PerfChart below shows three month performance for seven auto stocks, six of which feature in the Global Auto ETF (CARZ). Notice that Fiat, VW and Damlier have the biggest gains... Read More
Don't Ignore This Chart! January 20, 2014 at 05:15 AM
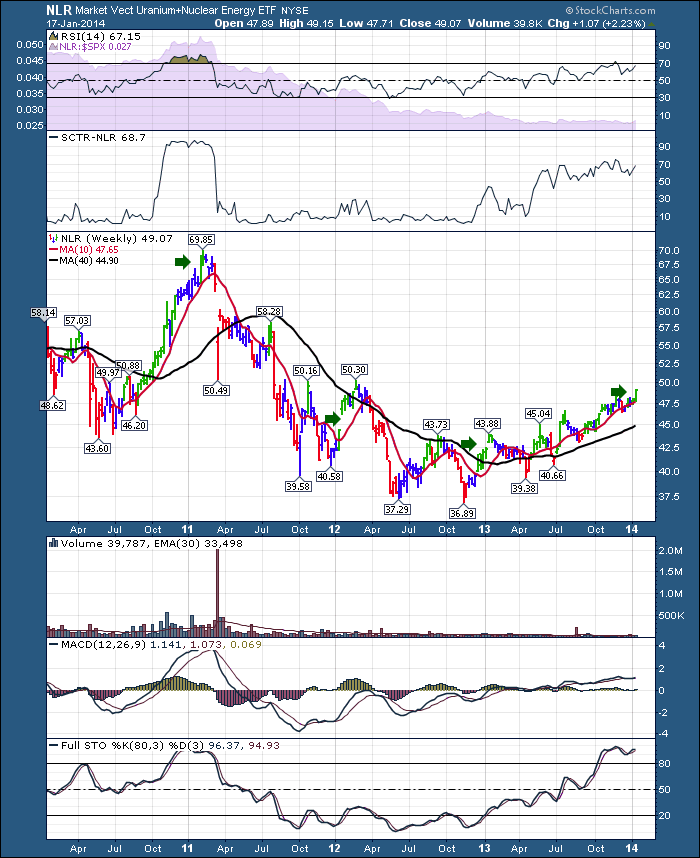
Seasonality is always an interesting part of TA. Look at this trend in NLR. One of the interesting patterns in this chart is the strong January every year... Read More
Don't Ignore This Chart! January 17, 2014 at 07:15 PM
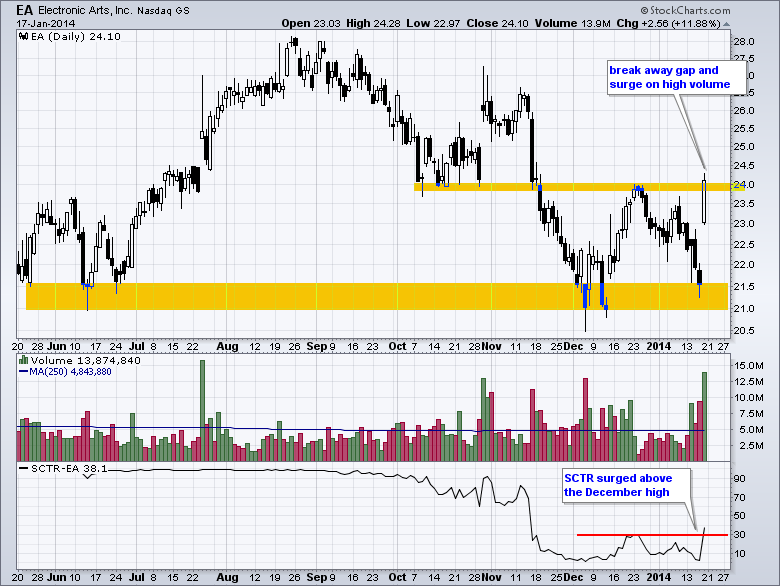
Electronic Arts (EA) came to life with its second bounce off support and a breakaway gap. This gap occurred on high volume and the stock broke above the late December high. Friday's move put EA into positive territory for the year... Read More
Don't Ignore This Chart! January 16, 2014 at 03:24 PM
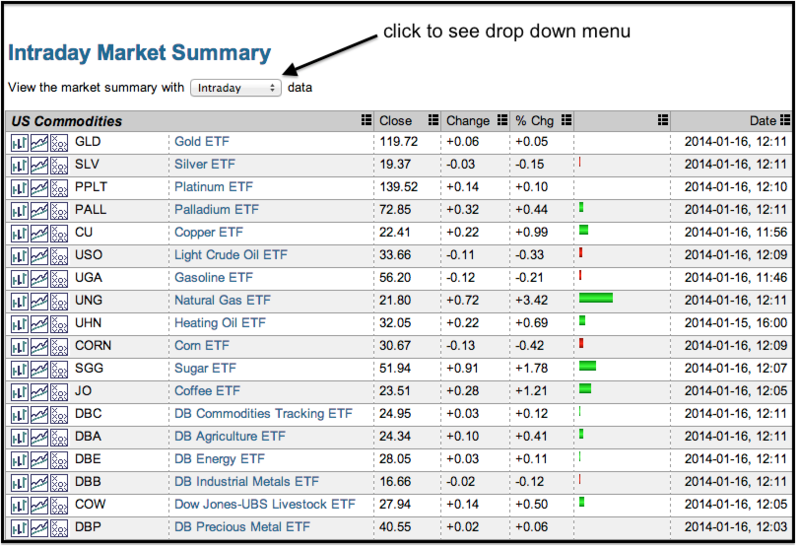
As its name suggests, the Market Summary provides an excellent overview of the financial markets in one page. There are nine tables representing nine different groups... Read More
Don't Ignore This Chart! January 15, 2014 at 05:48 PM
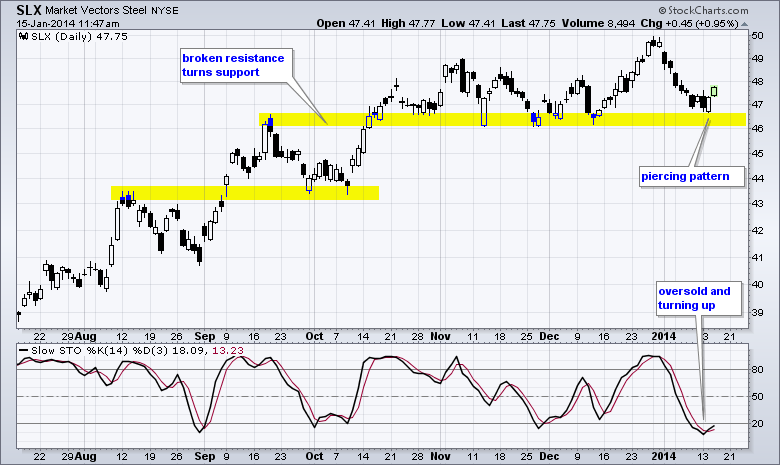
The Steel ETF (SLX) is perking up after a pullback to support. First, notice how broken resistance in the 46.5-47 area turned into support and held in November and December... Read More
Don't Ignore This Chart! January 14, 2014 at 05:04 AM
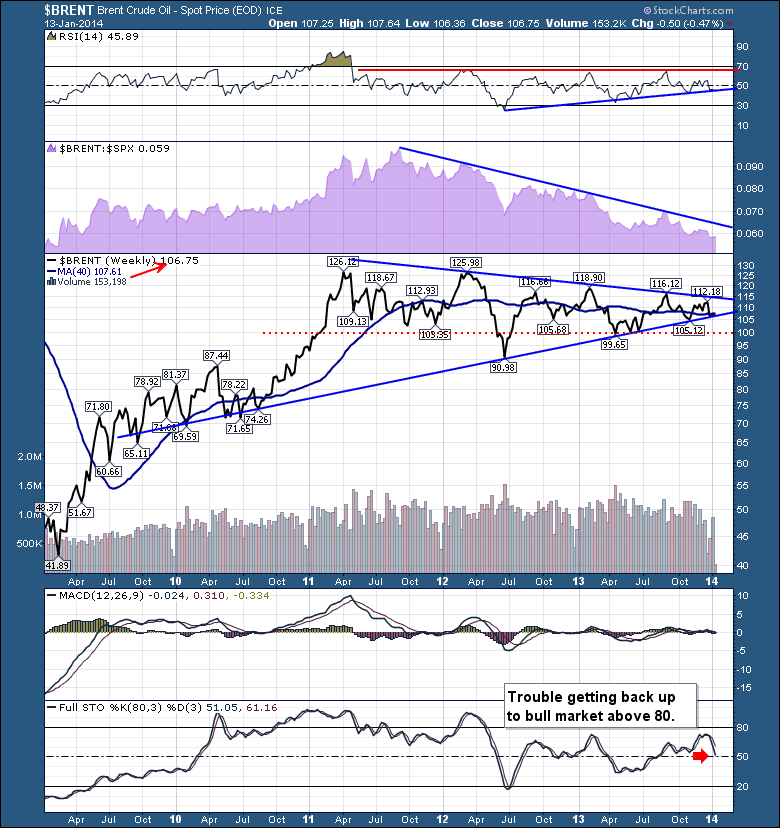
This compelling point in time on the $BRENT chart makes it very worthy of the 'Don't Ignore This Chart' blog. Starting at the top, the RSI is still staying under 65 which we would associate with a bear market pattern... Read More
Don't Ignore This Chart! January 13, 2014 at 09:02 PM
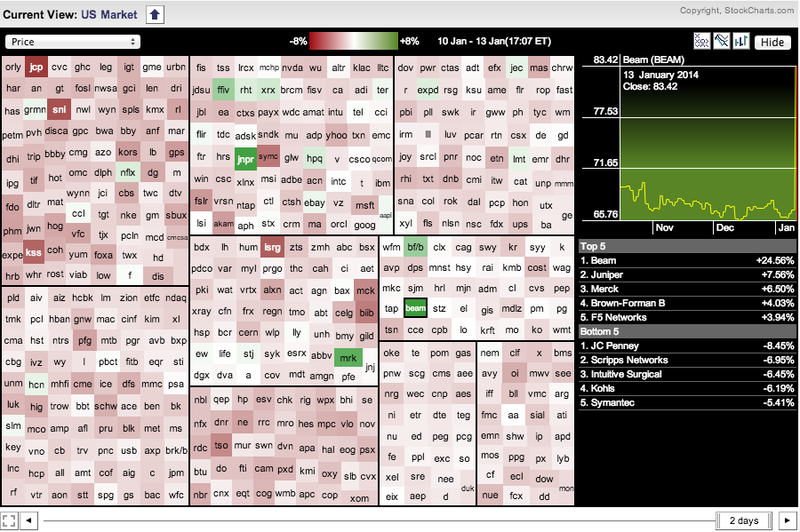
The Sector Market Carpet showed a lot of red on Monday, but there were a few green squares within the tech sector. In fact, a couple of networking stocks led as F5 Networks (FFIV) and Juniper (JNPR) scored big gains... Read More
Don't Ignore This Chart! January 10, 2014 at 12:21 PM
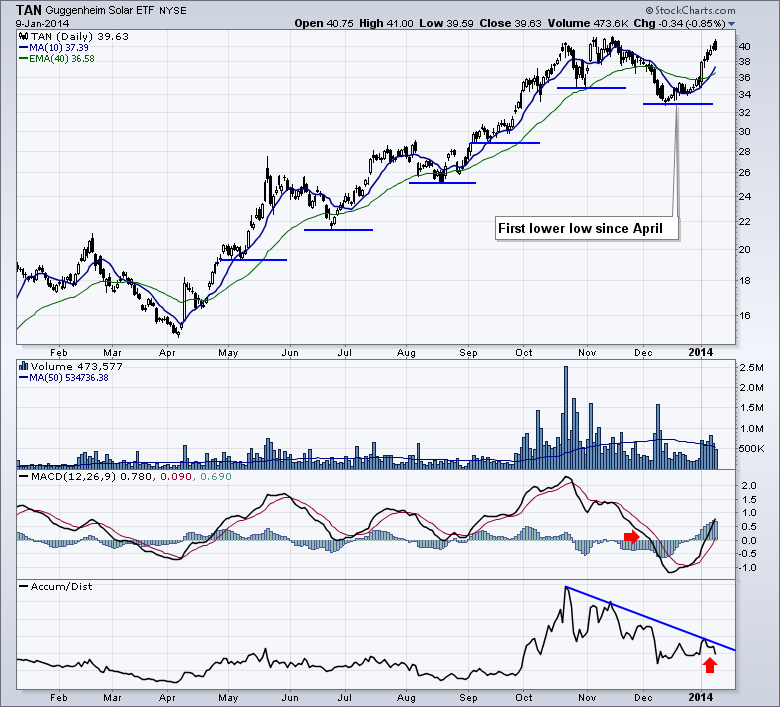
The solar industry has had a ray of sunlight shining on it all year. TAN and KWT were two huge performing ETFs in the space. There are a few points on this chart that make it very timely. We are trying to break out to new highs currently... Read More
Don't Ignore This Chart! January 10, 2014 at 08:46 AM
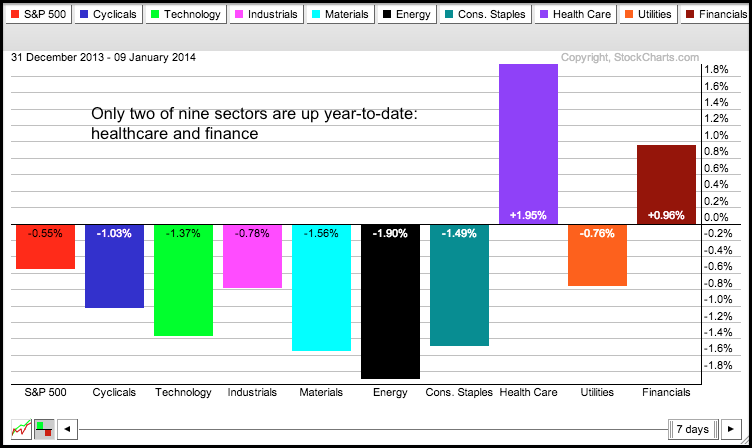
Stocks are off to a rough start in 2014 with seven of the nine sectors SPDRs under water. The Energy SPDR (XLE), Materials SPDR (XLB) and Consumer Staples SPDR (XLP) are leading the way lower... Read More
Don't Ignore This Chart! January 09, 2014 at 03:13 PM
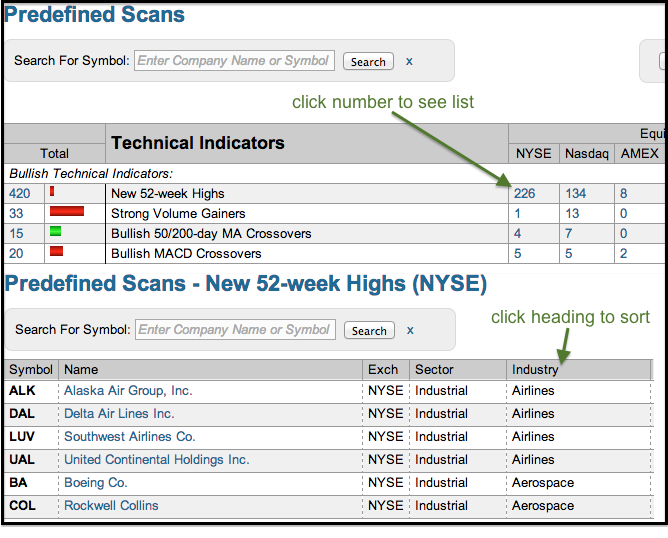
Stocks were under mild selling pressure early Thursday, but airlines bucked the trend with good gains and fresh highs. A look at the predefined scans page shows several airlines and two airline-related stocks making the 52-week high list today... Read More
Don't Ignore This Chart! January 08, 2014 at 03:27 PM
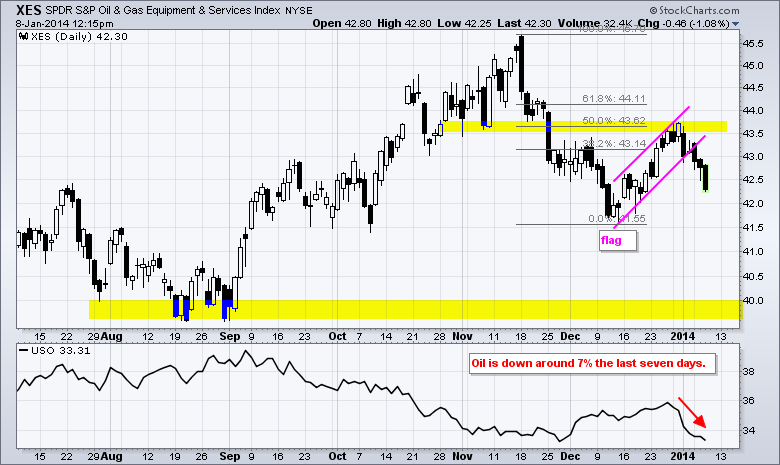
Weakness in oil continues to weigh on the Oil & Gas Equip & Services SPDR (XES) as the ETF broke flag support. The chart below shows XES hitting resistance at the 50% retracement and breaking flag support over the last three days... Read More
Don't Ignore This Chart! January 07, 2014 at 05:57 PM
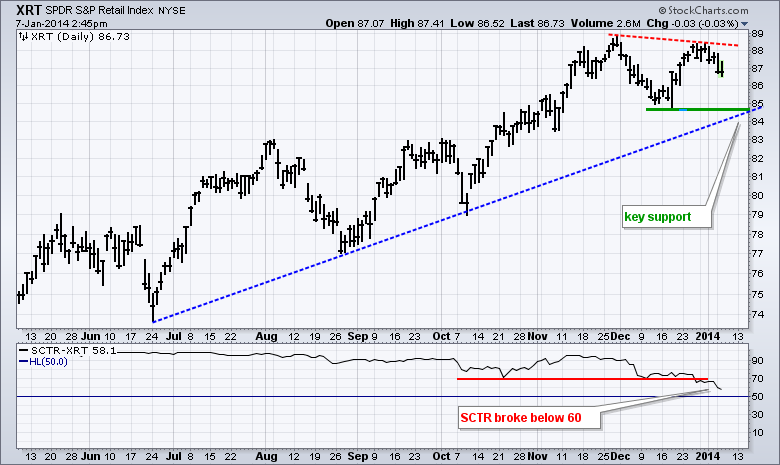
The S&P 500 hit a new high in late December, but the Retail SPDR (XRT) fell short of its prior high and could be forming a lower high, which is the first step to a downtrend. The June trend line and December low mark key support in the 84-84.5 area... Read More
Don't Ignore This Chart! January 06, 2014 at 07:56 PM
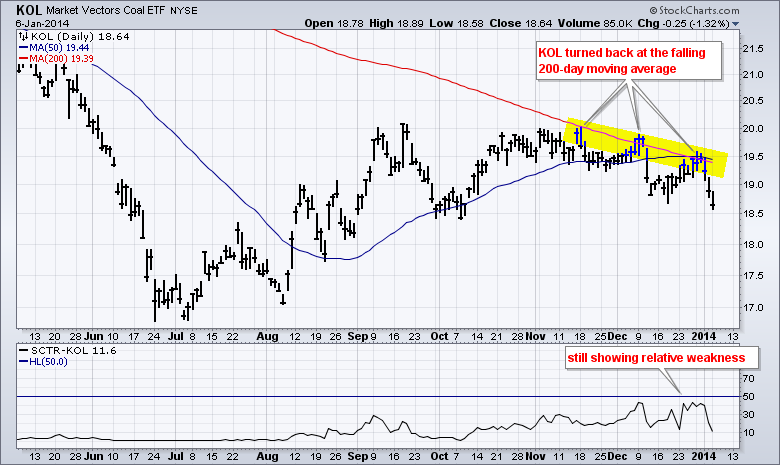
The Coal ETF (KOL) got a summer bounce, but stalled in the autumn and then hit resistance from the falling 200-day moving average. The 50-day moving average joined the battle as it met the 200-day at the end of December... Read More
Don't Ignore This Chart! January 03, 2014 at 09:07 AM
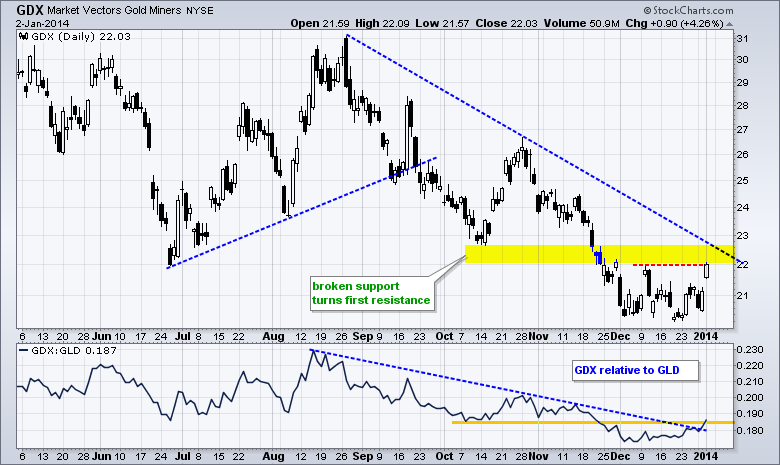
The Gold Miners ETF (GDX) remains in a downtrend overall, but the ETF is showing signs of life with a resistance challenge to start the year. Resistance in the 22-23 area stems from broken support, the August trend line and the early December high... Read More
Don't Ignore This Chart! January 02, 2014 at 02:27 PM
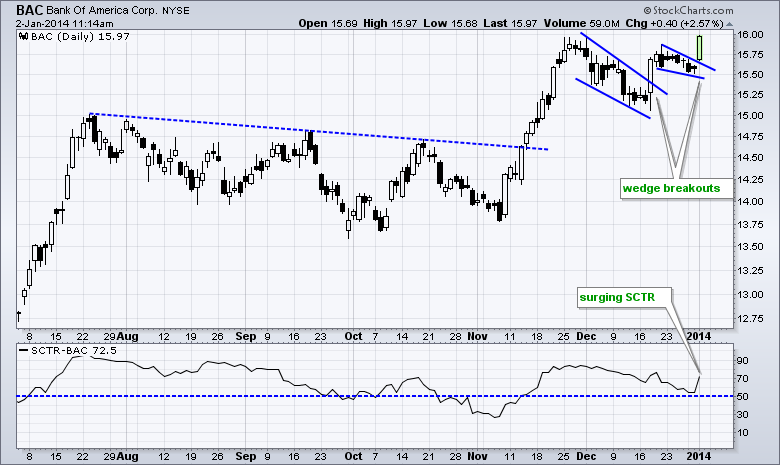
Bank of America (BAC) is starting the New Year with a breakout on the price chart and surge in the StockCharts Technical Rank (SCTR). The SCTR is up over 15 points and back above 70, which made it easy to spot on the SCTR table when sorted by change... Read More