Don't Ignore This Chart! August 31, 2014 at 11:01 AM
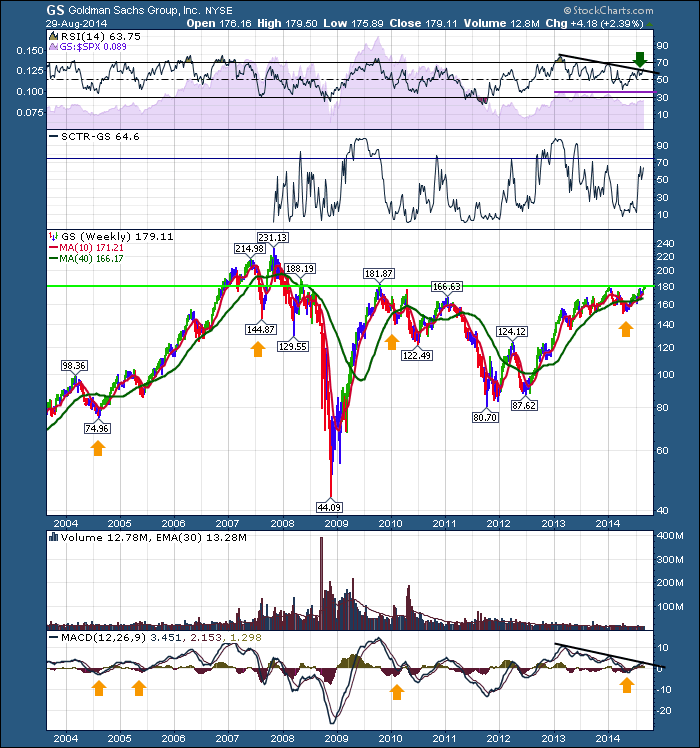
I did a presentation for a chapter of the CSTA back in July. At the time, Goldman Sachs (GS) was mired below the 40 WMA. I like to use Goldman Sachs as a warning bell... Read More
Don't Ignore This Chart! August 29, 2014 at 03:45 PM
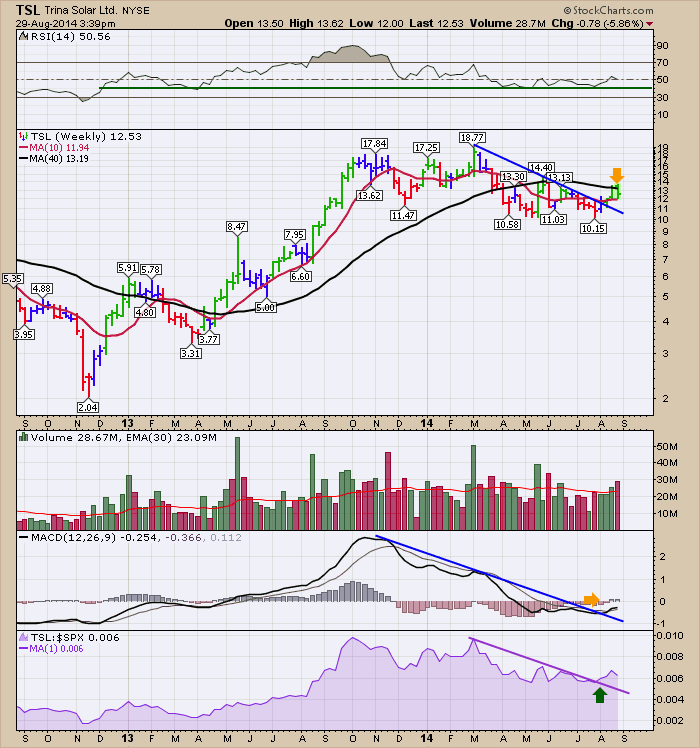
Trina Solar (TSL) is poised to break out here, but it has important resistance to get through first. The RSI has stayed bullish throughout the 1 year pullback. The stock has drifted sideways since last August... Read More
Don't Ignore This Chart! August 28, 2014 at 09:13 AM
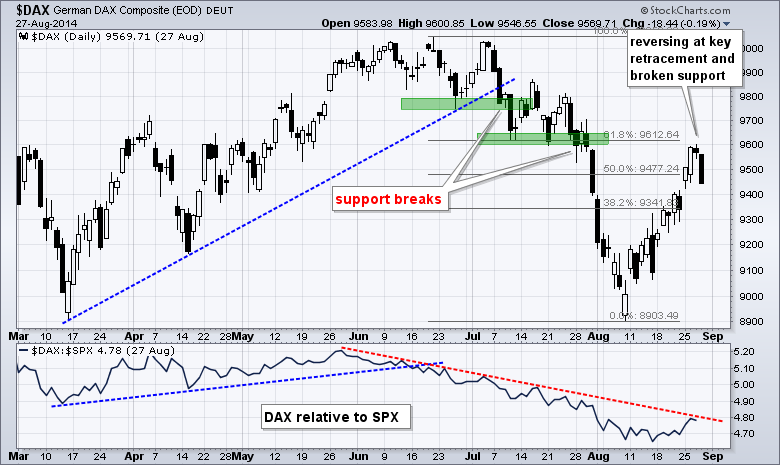
The German DAX Index ($DAX) is at an interesting juncture because it broke down in July and then retraced 62% of the prior decline with a bounce in August. Notice that broken support turns into resistance in the 9600 area as well... Read More
Don't Ignore This Chart! August 26, 2014 at 09:37 PM
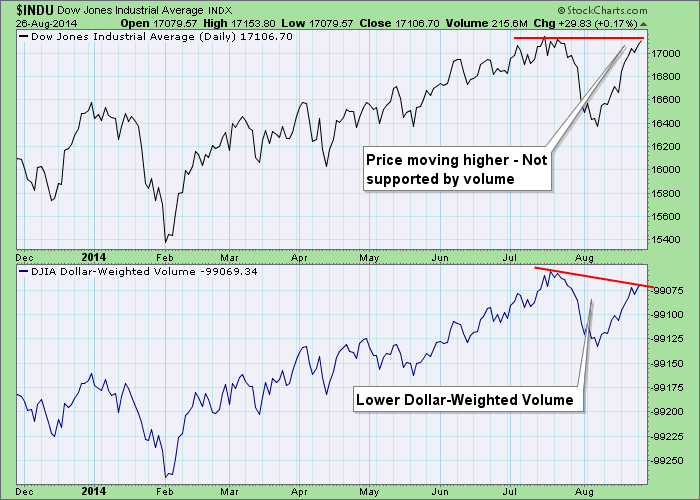
Dollar-Weighted Volume (DWV) is a short-term indicator. Generally the DWV and the price index run pretty close together, with tops confirming tops and bottoms confirming bottoms... Read More
Don't Ignore This Chart! August 26, 2014 at 02:13 PM
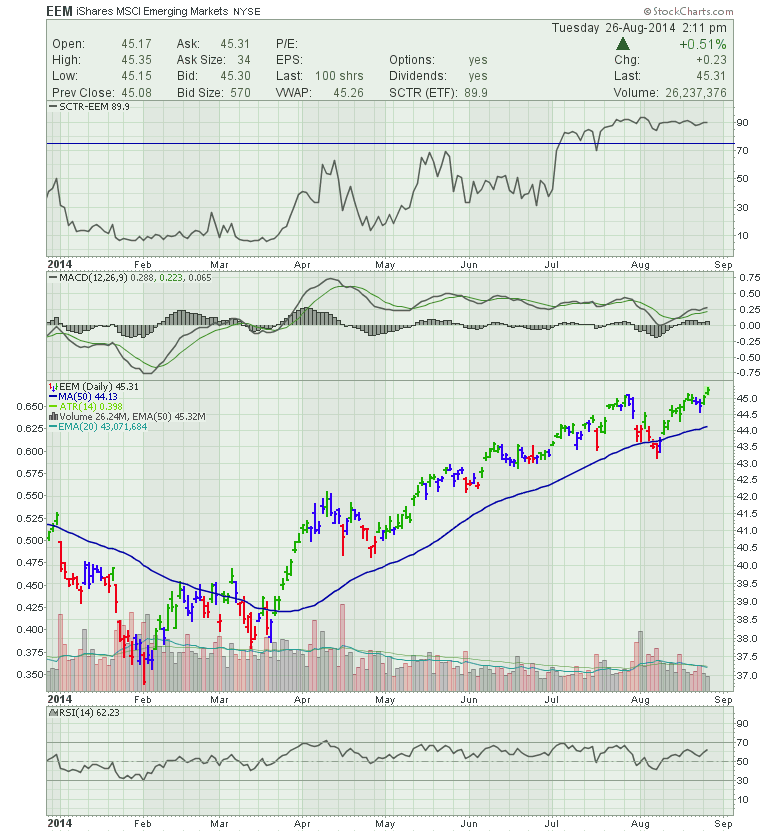
The Emerging Markets ETF (EEM) continues to post new highs today. The SCTR ranking has moved into the cherished top quartile, and the EEM segment looks to be powering higher... Read More
Don't Ignore This Chart! August 25, 2014 at 04:02 PM
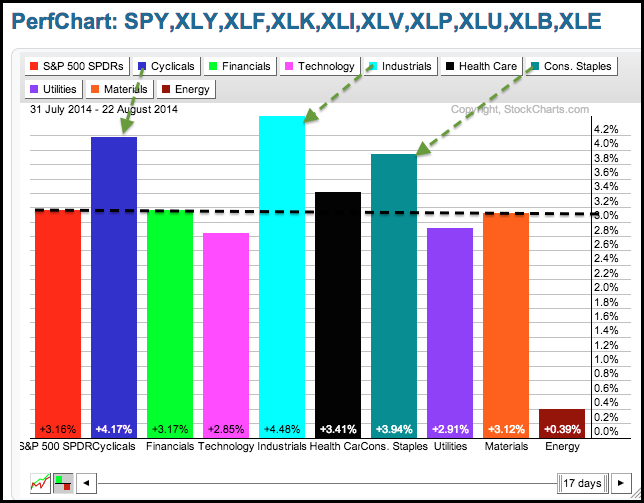
Contrary to seasonal tendencies, August has been a strong month for the stock market. The Sector PerfChart shows the S&P 500 SPDR (SPY) up just over 3% since July 31st... Read More
Don't Ignore This Chart! August 22, 2014 at 10:45 AM
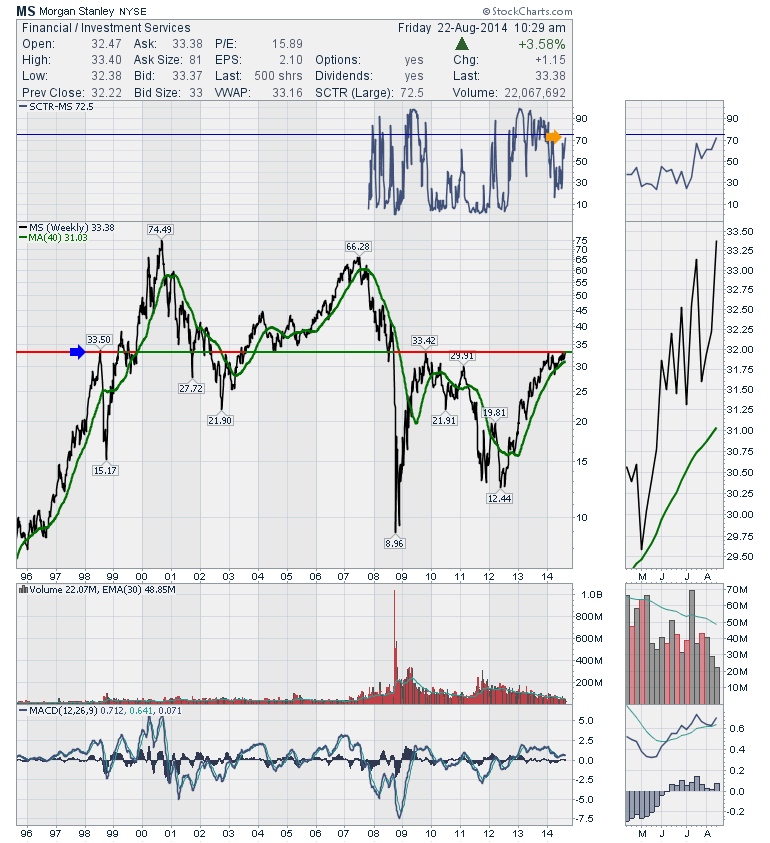
Morgan Stanley (MS) had a beautiful run in 2013. In 2014, MS continued to make mostly higher lows but the ceiling was capped in the $33 - $33.50 range. Today it is back there testing it again... Read More
Don't Ignore This Chart! August 21, 2014 at 12:09 PM
The finance sector is showing strength as the annual conference in Jackson Hole gets under way. Fed Chair Janet Yellen will speak tomorrow and this could move Treasury yields and further affect the group... Read More
Don't Ignore This Chart! August 20, 2014 at 12:45 PM
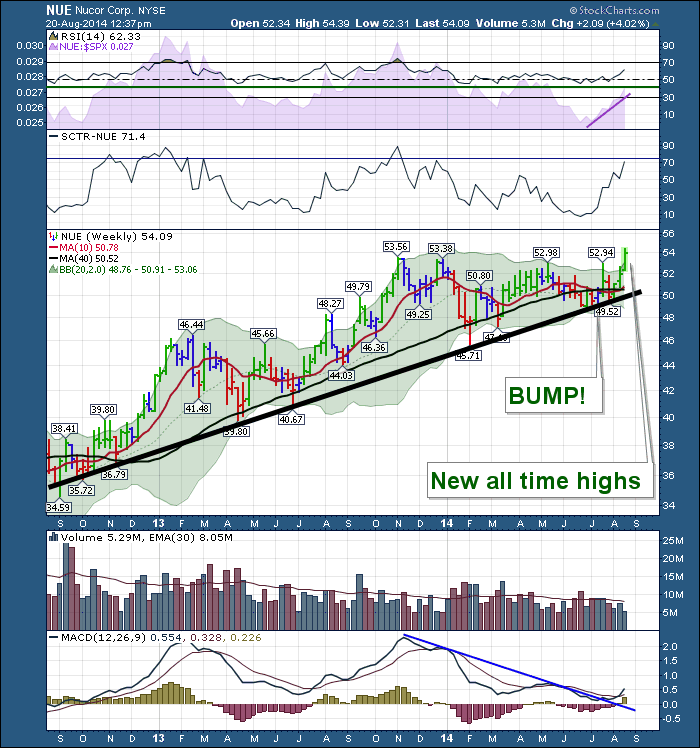
Some of the Steel sector has been moving up aggressively. But poking out to new 52 week and All Time Highs today was NuCor (NUE). This chart has great technicals. The RSI has stayed in bull mode above 40 for 2 years... Read More
Don't Ignore This Chart! August 20, 2014 at 12:21 PM
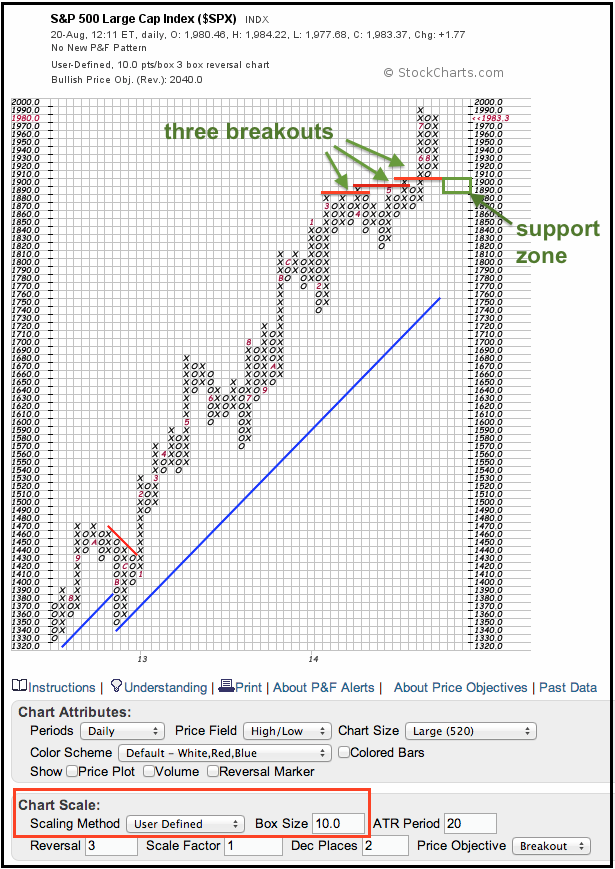
The Point & Figure chart below, which is based on 10 points per box, shows the S&P 500 with successive upside breakouts in April, May and June. A key tenet of technical analysis is that broken resistance turns into support... Read More
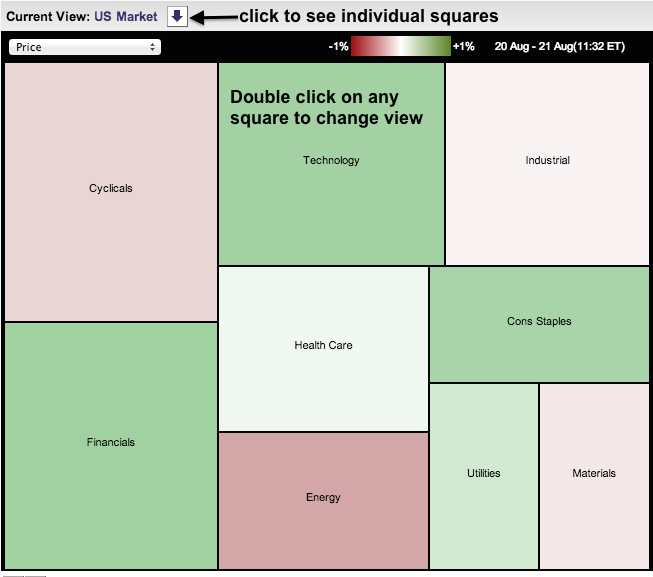
Don't Ignore This Chart! August 19, 2014 at 01:01 PM
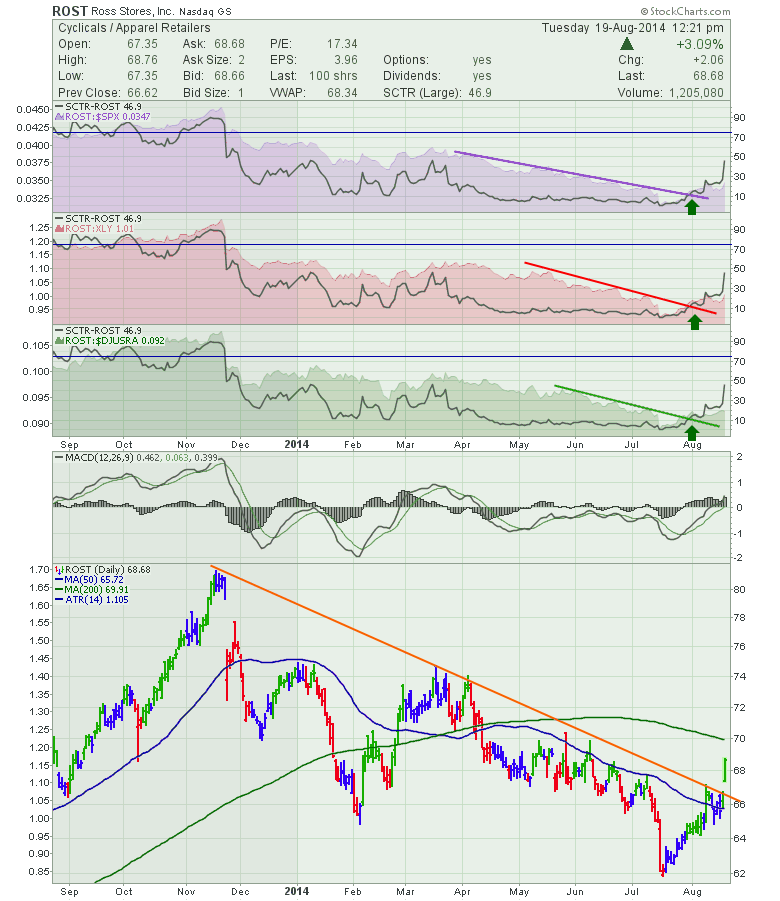
The Consumer Cyclicals have been spiralling into the leading zone on the RRG charts. The stocks have been surging. Arthur Hill and I have been pointing to Consumer Cyclicals since mid July... Read More
Don't Ignore This Chart! August 18, 2014 at 12:13 PM
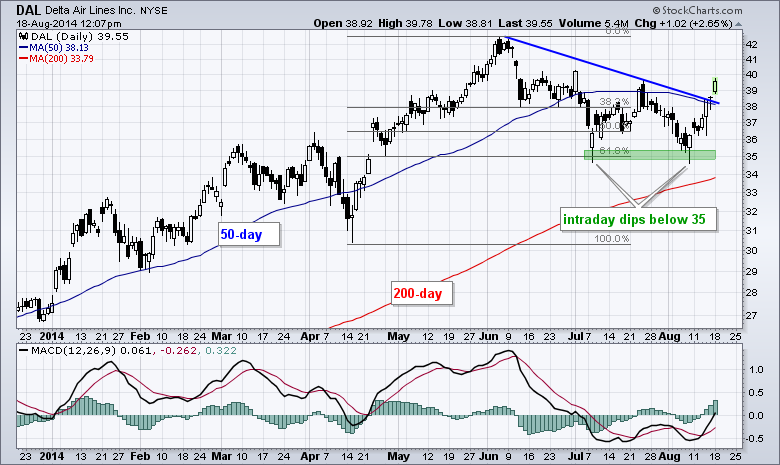
Delta Airlines (DAL) appears to be ending its two month correction with a surge back above the 50-day moving average. Notice how the stock successfully tested the 35 level twice and did not even test the rising 200-day... Read More
Don't Ignore This Chart! August 15, 2014 at 01:23 PM
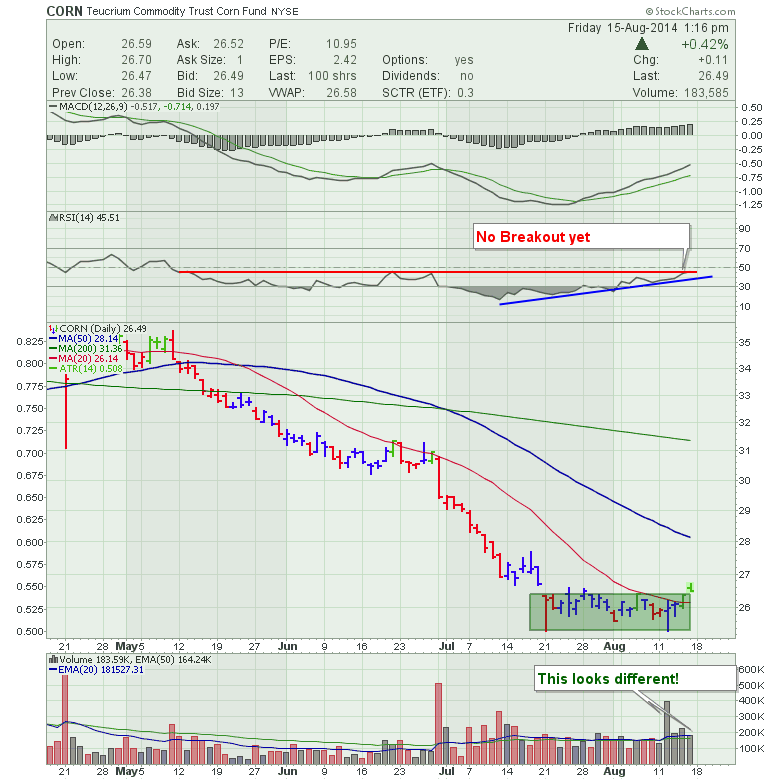
The chart of Corn (CORN) has been moving sideways for a month. We have been watching corn closely. On the big downward intraday reversal today, CORN held the gap on the open. The RSI has not broken out yet and this is bottom fishing... Read More
Don't Ignore This Chart! August 14, 2014 at 11:24 AM
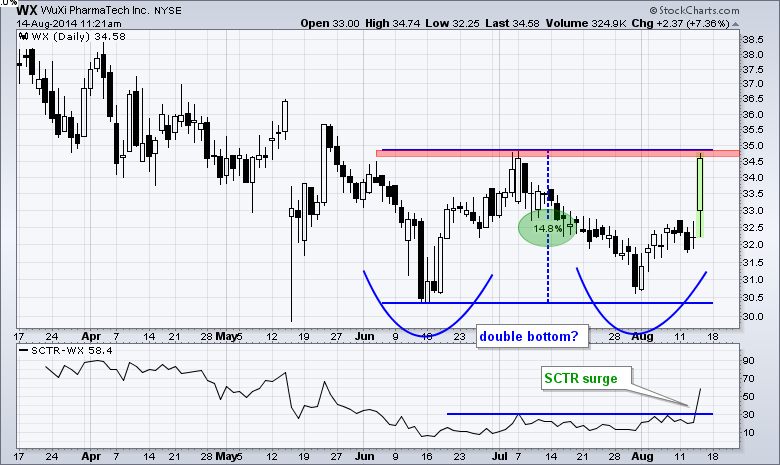
WuXi PharmaTech (WX) is a mid cap stock showing a big gain in its StockCharts Technical Rank (SCTR) on Thursday. Notice that the SCTR surged above 50 and to its highest level since May. On the price chart, the two lows in the 30.5 area form a possible double bottom... Read More
Don't Ignore This Chart! August 13, 2014 at 11:54 AM
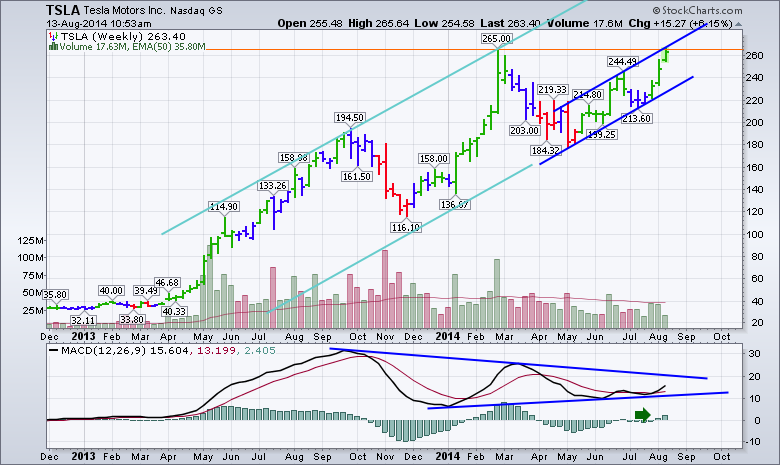
Tesla (TSLA) generates lots of discussion these days. From the Consumer Reports with no door handles appearing to giga factories and new SUV's, the stock couldn't be more in the news. Today, TSLA is testing the thrust high from February 2014 with a peak at $265... Read More
Don't Ignore This Chart! August 12, 2014 at 12:55 PM
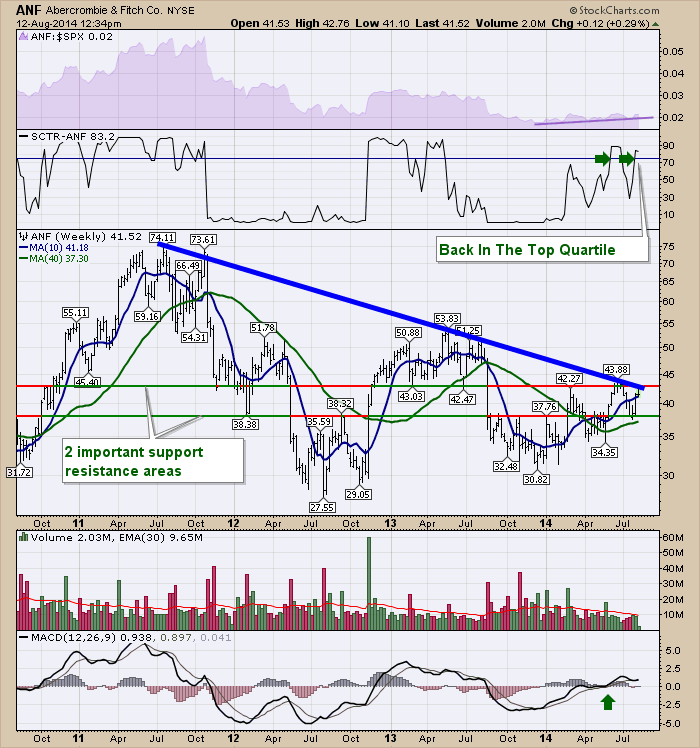
As retail starts shining with Back-To-School and the early ramp into US Thanksgiving and Christmas, the Consumer Cyclicals sector is in prime focus. Abercrombie And Fitch Co. (ANF) is an apparel retailer associated with a younger demographic... Read More
Don't Ignore This Chart! August 11, 2014 at 01:58 PM
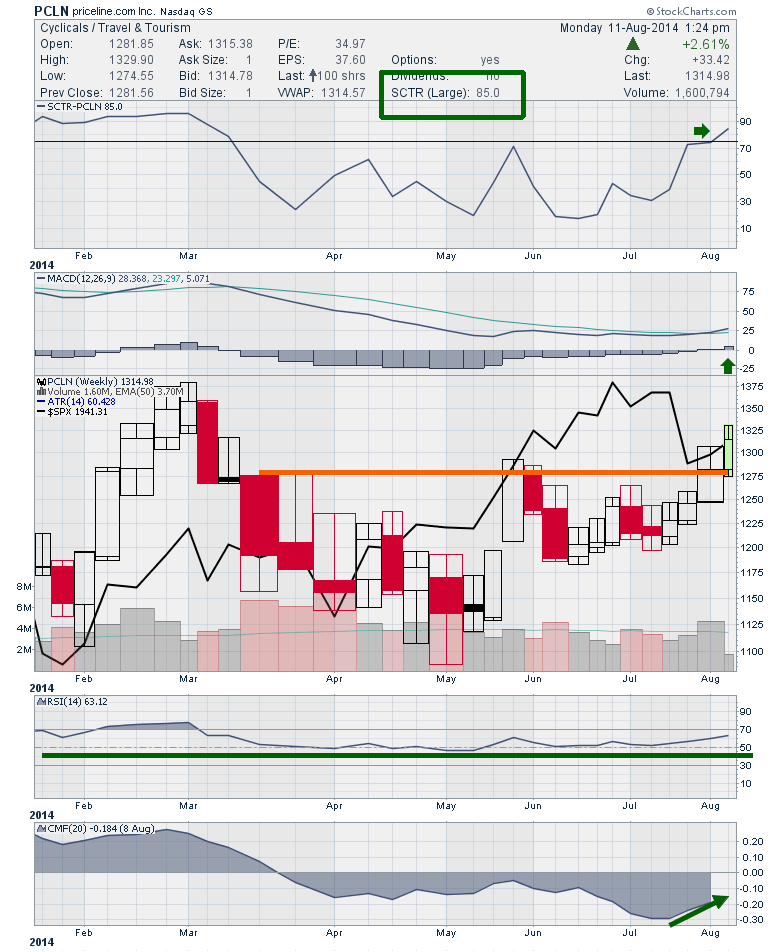
After a fantastic Chartcon 2014 conference with technicians, we are all fired up to find the best stocks with the best tools. With all of the attendees travelling from multiple countries and continents, looking at Priceline (PCLN) seems only fitting today... Read More
Don't Ignore This Chart! August 08, 2014 at 01:11 PM
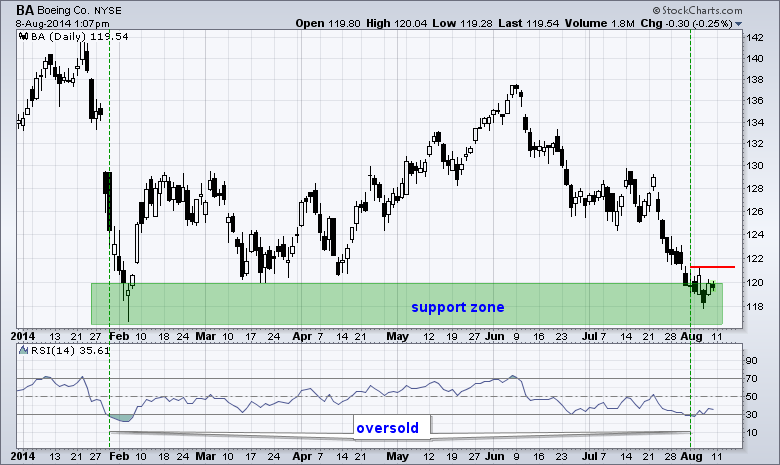
It has been a rough year for Boeing, but the stock may be poised for an oversold bounce. After a big plunge in January, the stock firmed for a few months and then worked its way higher in April-May. BA peaked in early June and fell back to support over the past week... Read More
Don't Ignore This Chart! August 07, 2014 at 08:21 PM
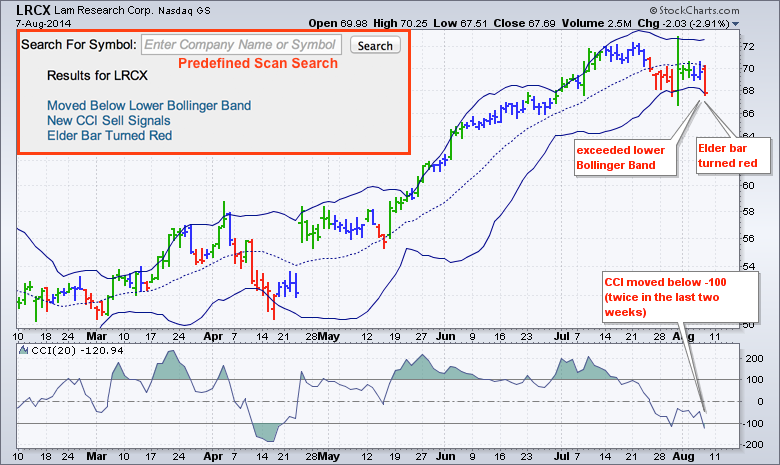
Chartists can search pre-defined scans to find out if their favorite stock or ETF triggered any scans. The chart below shows Lam Research (LRCX) triggering three bearish scans today... Read More
Don't Ignore This Chart! August 06, 2014 at 03:46 PM
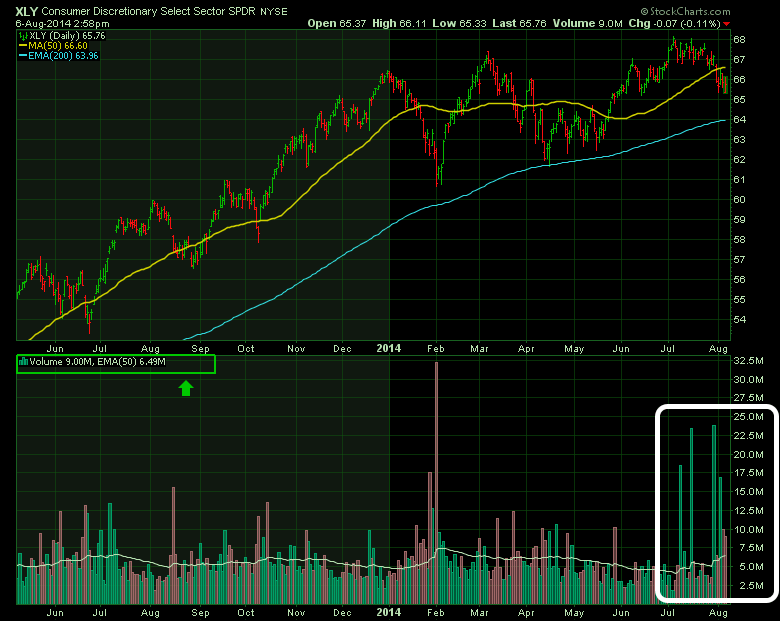
Rolling through the sector ETF's I noticed something that was way,way out of scale. Here is the one year daily chart of the Consumer Cyclical(Discretionary) sector SPDR (XLY). Look at the volume profile for the month of July... Read More
Don't Ignore This Chart! August 06, 2014 at 02:23 PM
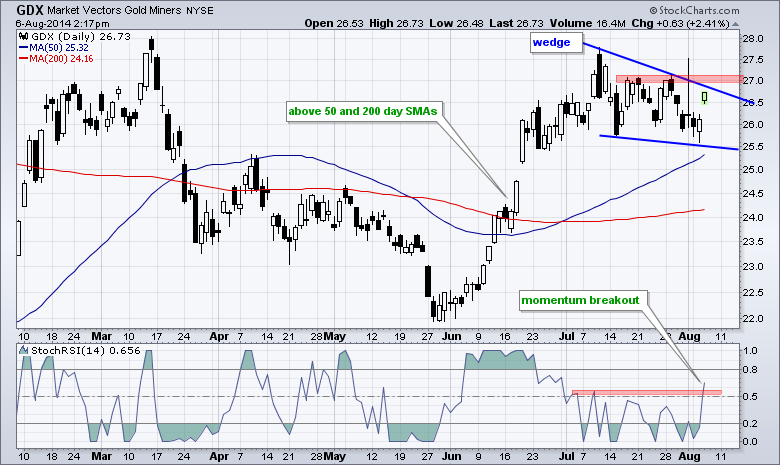
The Gold Miners ETF (GDX) is reacting to strength in gold with a gap and 2+ percent surge. The chart below shows GDX forming a wedge above the 50 and 200 day moving averages. The ETF gapped up within this wedge and StochRSI surged above its July highs for a momentum breakout... Read More
Don't Ignore This Chart! August 05, 2014 at 07:52 PM
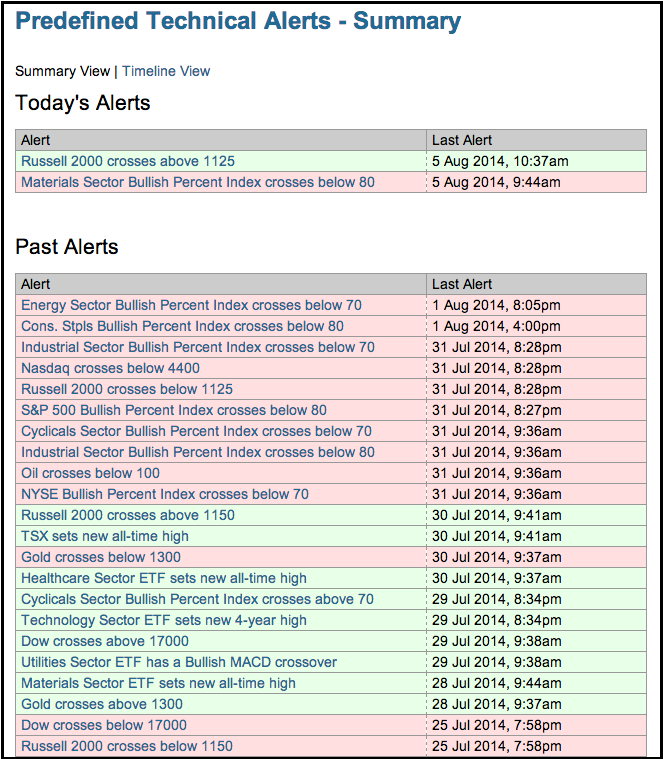
The pre-defined technical alerts page is a great place see the positive and negative events of the last few days. The image below shows a green (positive) alert for the Russell 2000 and a red (negative alert for the Materials SPDR (XLB)... Read More
Don't Ignore This Chart! August 04, 2014 at 07:30 PM
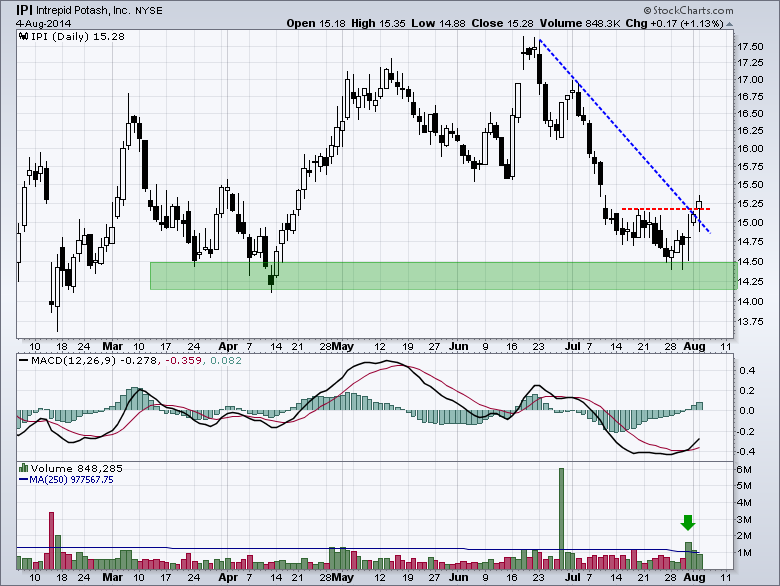
Intrepid Potash (IPI) fell to support in July, firmed for a few days and then surged above first resistance with good volume. Support stems from the March-April lows, and now the July low. The indicator window shows MACD moving above its signal line the last two days... Read More