Don't Ignore This Chart! September 30, 2014 at 09:37 AM
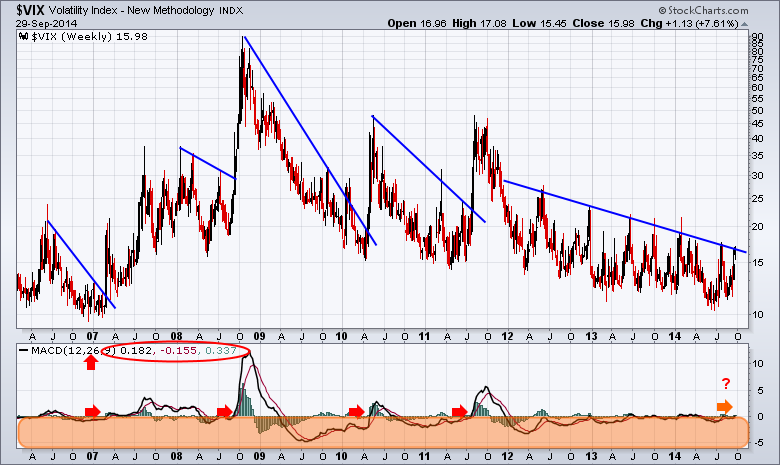
The $VIX chart says its business as usual out there. I have a lot of signals that say the interim top is in. The main signals would be the breadth charts but the $VIX is always considered the fear index... Read More
Don't Ignore This Chart! September 29, 2014 at 03:05 PM
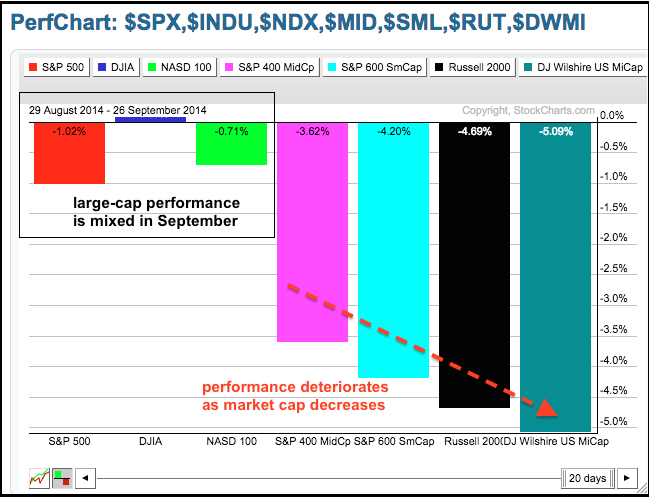
September is been rather unkind to mid-caps, small-caps and micro-caps, but large-caps and large-cap techs are holding up ok. The PerfChart below shows the Dow Industrials with a small gain this month, the S&P 500 with a 1% loss and the Nasdaq 100 with a .71% loss... Read More
Don't Ignore This Chart! September 26, 2014 at 12:46 PM
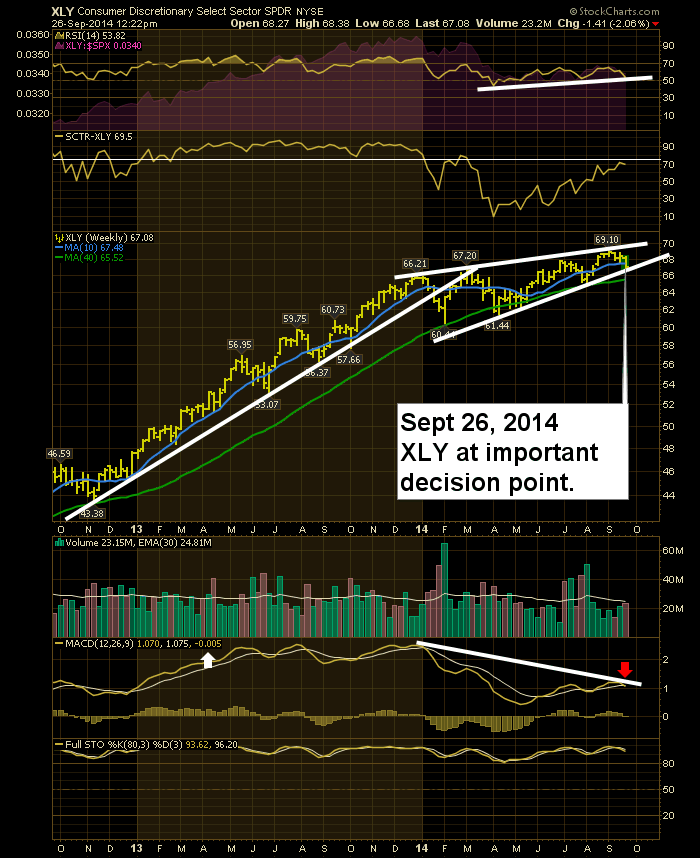
The Consumer Cyclicals Sector ETF (XLY) is testing a very important level technically this week. The RSI uptrend line is being tested and has been in place since March 2014. The SCTR ranking is very interesting. The SCTR was in the top quartile almost all of 2013... Read More
Don't Ignore This Chart! September 25, 2014 at 12:22 PM
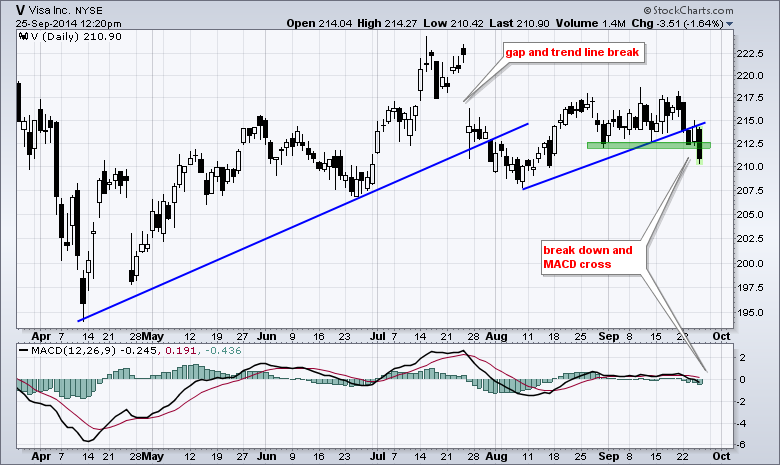
The Dow Jones Industrial Average is a price-weighted average and this means the stocks with the highest prices carry the most weight. Visa (V) is the highest priced Dow stock and it was down around 1.5% at midday, thus weighing on the Dow today... Read More
Don't Ignore This Chart! September 24, 2014 at 11:10 AM
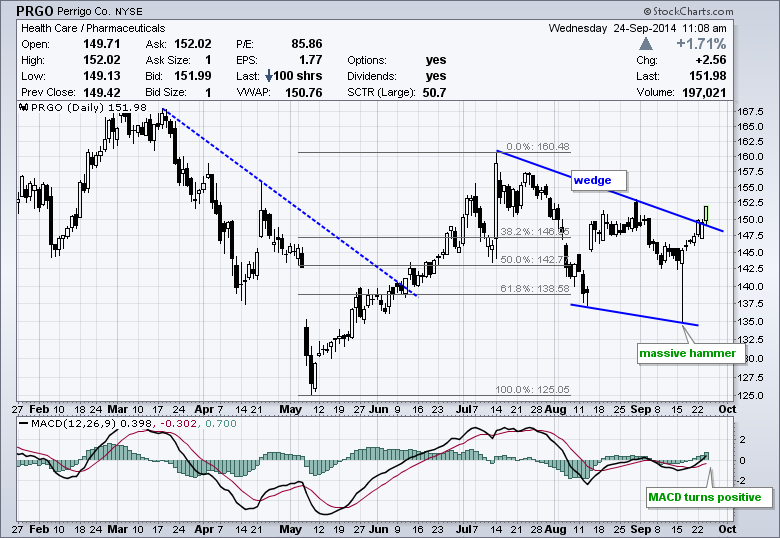
Perrigo (PRGO), which is part of the healthcare sector, formed a massive hammer in mid September and followed up on this candlestick reversal with a break above the wedge trend line. Also notice that MACD moved above its signal line and turned positive... Read More
Don't Ignore This Chart! September 23, 2014 at 11:22 AM
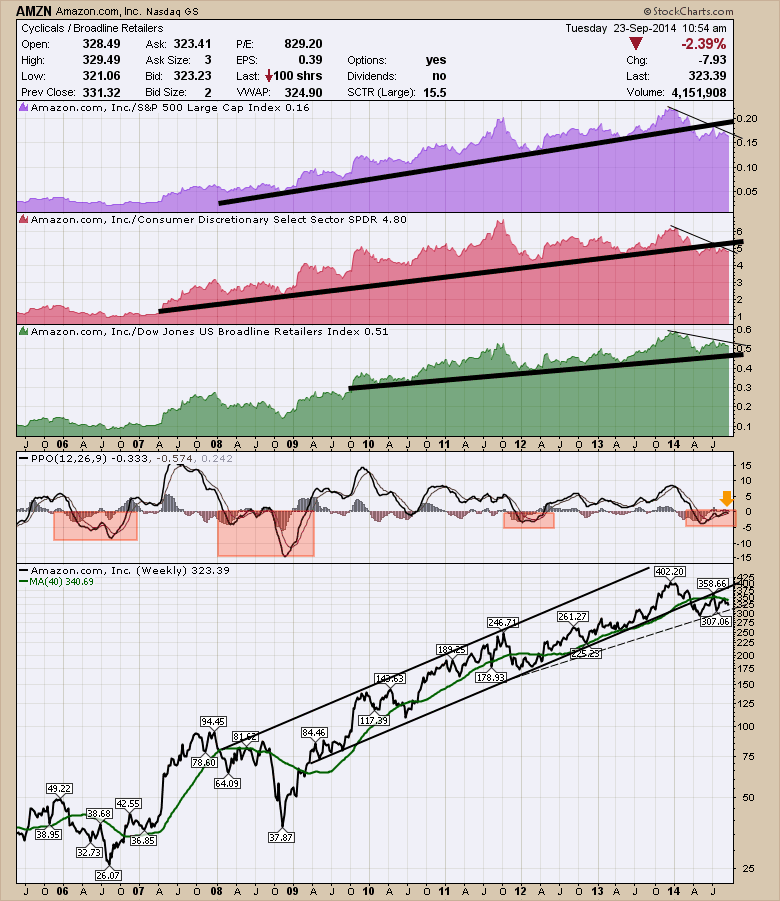
Amazon. One of the largest, most used, unprofitable companies in the internet space. Almost every fundamental metric has failed to hold the stock in reality. It has had a P/E for years with a negative denominator. Technically, Amazon has been equally as hard... Read More
Don't Ignore This Chart! September 22, 2014 at 03:30 PM
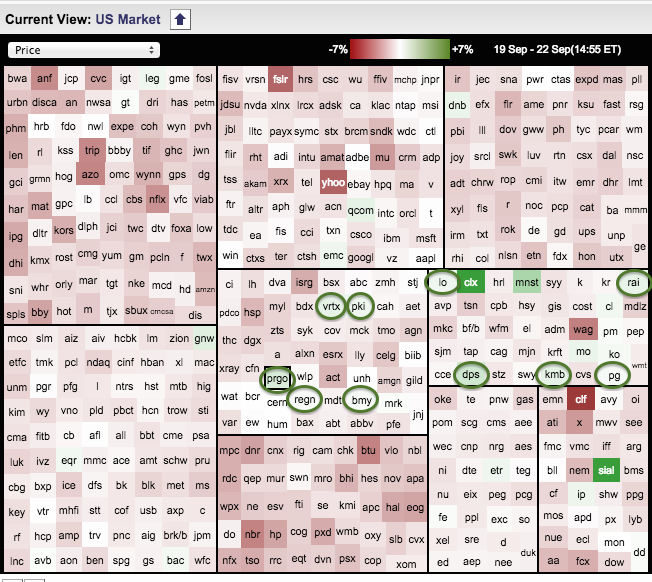
Stocks are down pretty much across the board on Monday, but there are some pockets of green and chartists can find these stocks using the Sector Market Carpet... Read More
Don't Ignore This Chart! September 20, 2014 at 10:22 AM
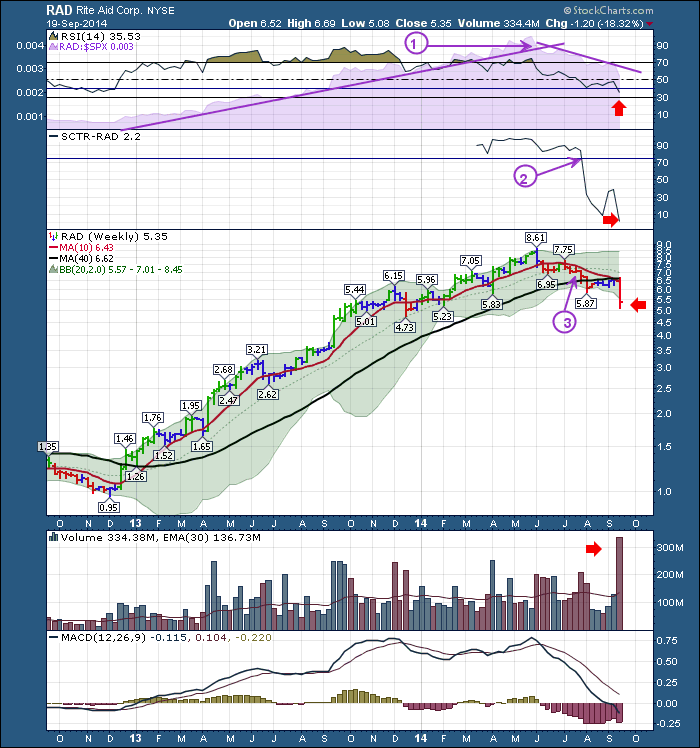
Rite Aid Pharmacy (RAD) changed its shareholder medication this week. The pharmacy chain moved up 900% in 18 months delivering happiness to the shareholders. That move up topped out in May. Since then, the pharmacy lost almost 50% of the gain... Read More
Don't Ignore This Chart! September 18, 2014 at 10:18 AM
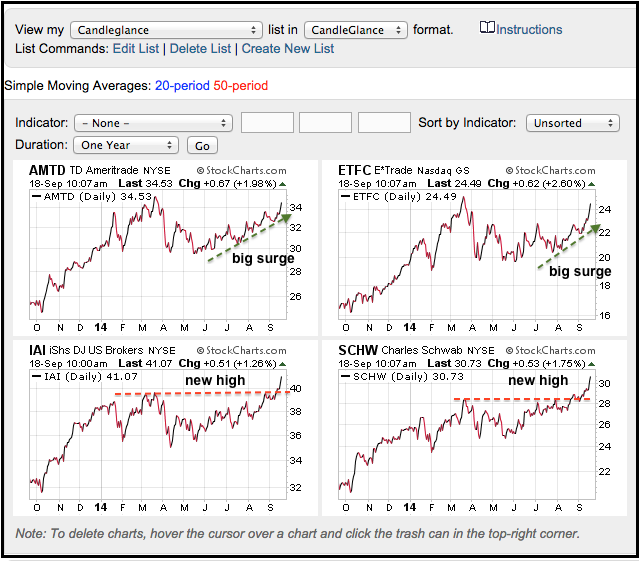
The Broker-Dealer iShares (IAI) is showing leadership over the last few weeks with a surge above its March highs. Notice that the ETF is up around 10% from its early August low... Read More
Don't Ignore This Chart! September 17, 2014 at 07:47 AM
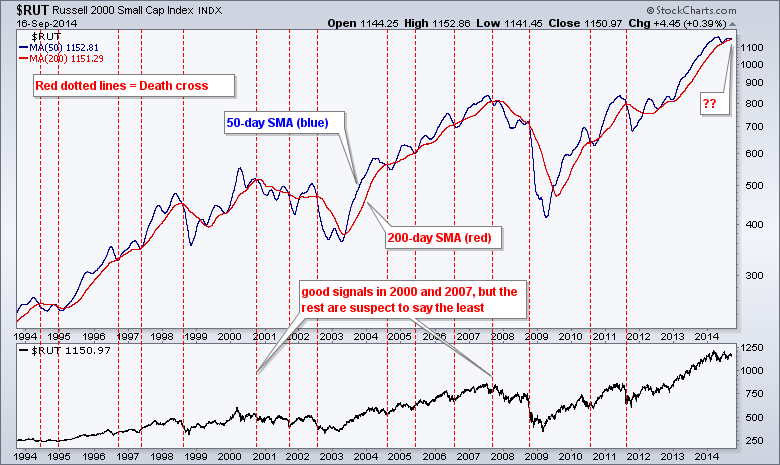
There is a lot of talk of an "impending" death cross for the Russell 2000. This event occurs when the 50-day simple moving average crosses below the 200-day SMA... Read More
Don't Ignore This Chart! September 15, 2014 at 01:41 PM
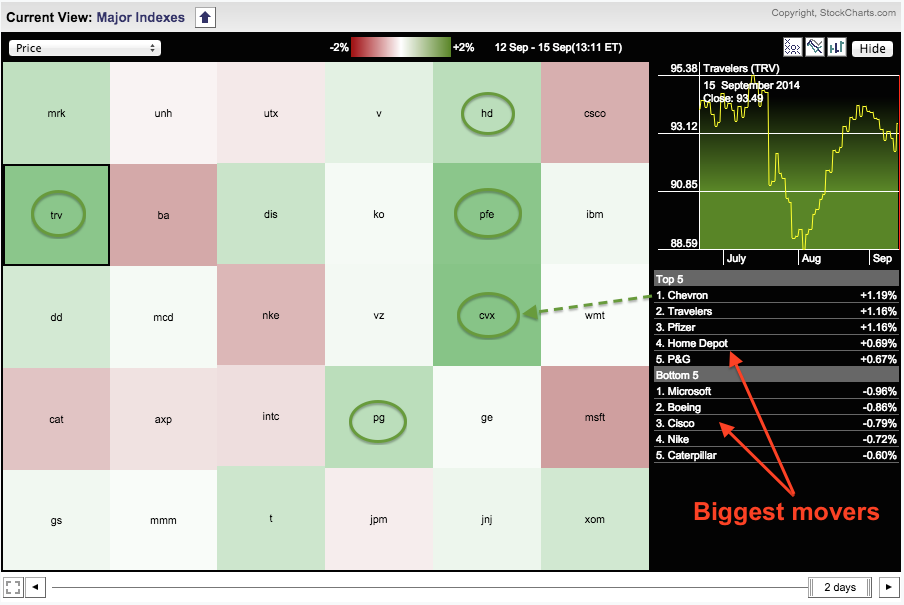
The Dow Industrials is bucking the selling pressure with strength in Chevron, Pfizer, Travellers, Procter & Gamble and Home Depot (among others). Chartists can easily spot the winners and losers on a Market Carpet... Read More
Don't Ignore This Chart! September 15, 2014 at 12:02 AM
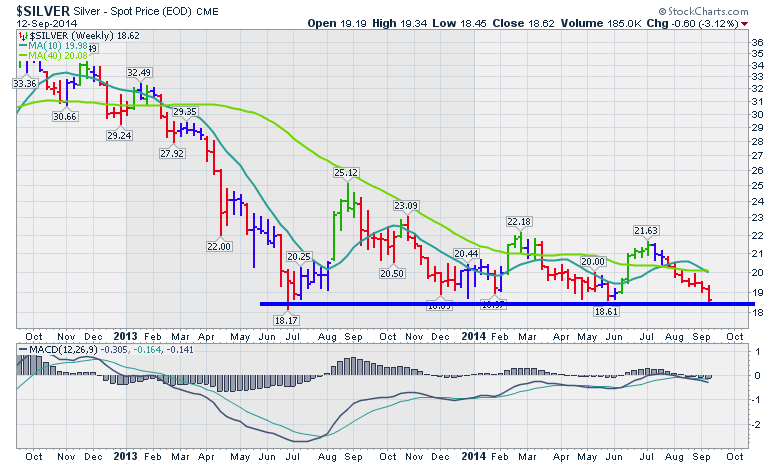
Silver ($SILVER) collapsed this week to the same level where support has been found before. The $18.61 level is critical for $SILVER. There is a small chance at $18.17 to find support but Silver needs to get up and go from here... Read More
Don't Ignore This Chart! September 12, 2014 at 01:21 PM
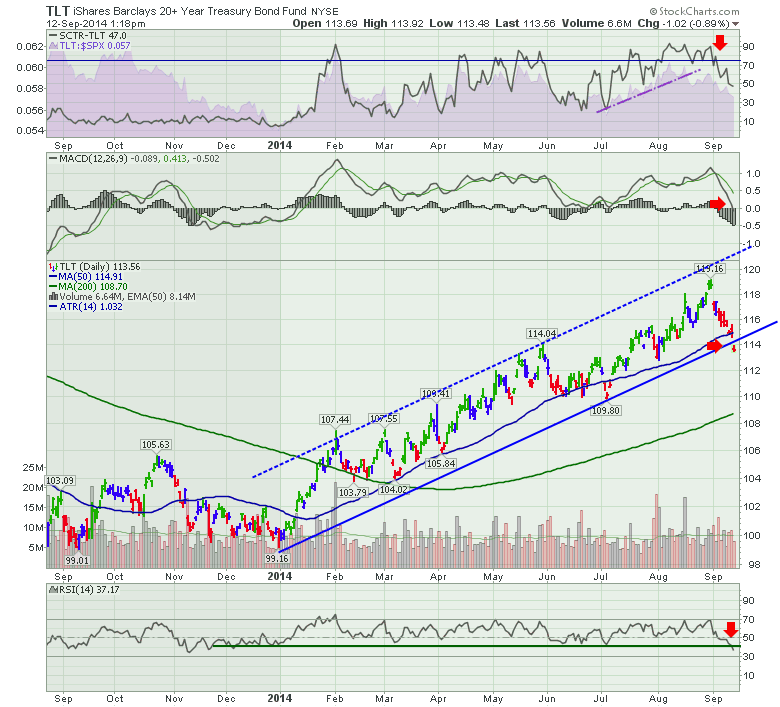
The long Bond ETF (TLT) has changed its character this week. We can see in Early September, the SCTR fell below the top quartile reading of 75. The Purple trend line on the relatives strength to $SPX has been broken. So both of those are concerning... Read More
Don't Ignore This Chart! September 11, 2014 at 11:32 AM
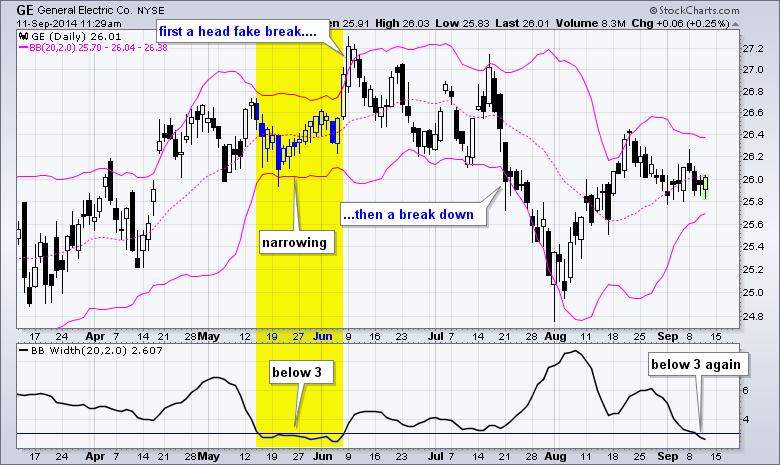
Trading in General Electric (GE) has slowed over the last two weeks and the Bollinger Bands have contracted to their narrowest since early July. The indicator window confirms this volatility contraction as BandWidth dipped below 3 again... Read More
Don't Ignore This Chart! September 10, 2014 at 12:39 PM
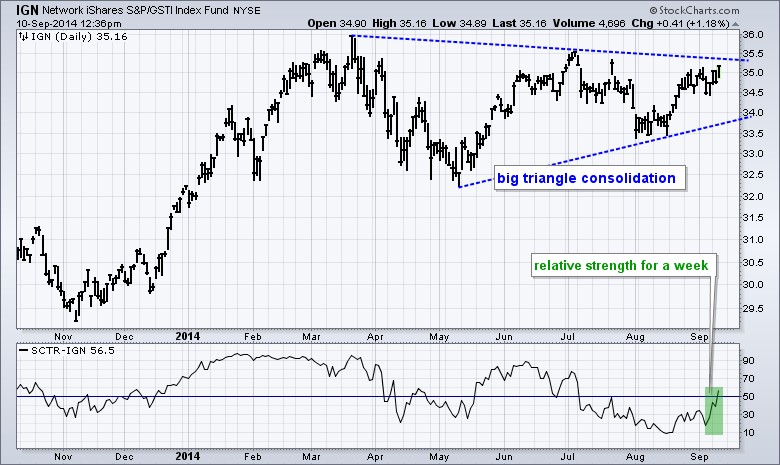
The Networking iShares (IGN) is making a move over the last few weeks and the StockCharts Technical Rank (SCTR) surged above 50 this week. The chart shows IGN with a big triangle forming since March... Read More
Don't Ignore This Chart! September 09, 2014 at 01:20 AM
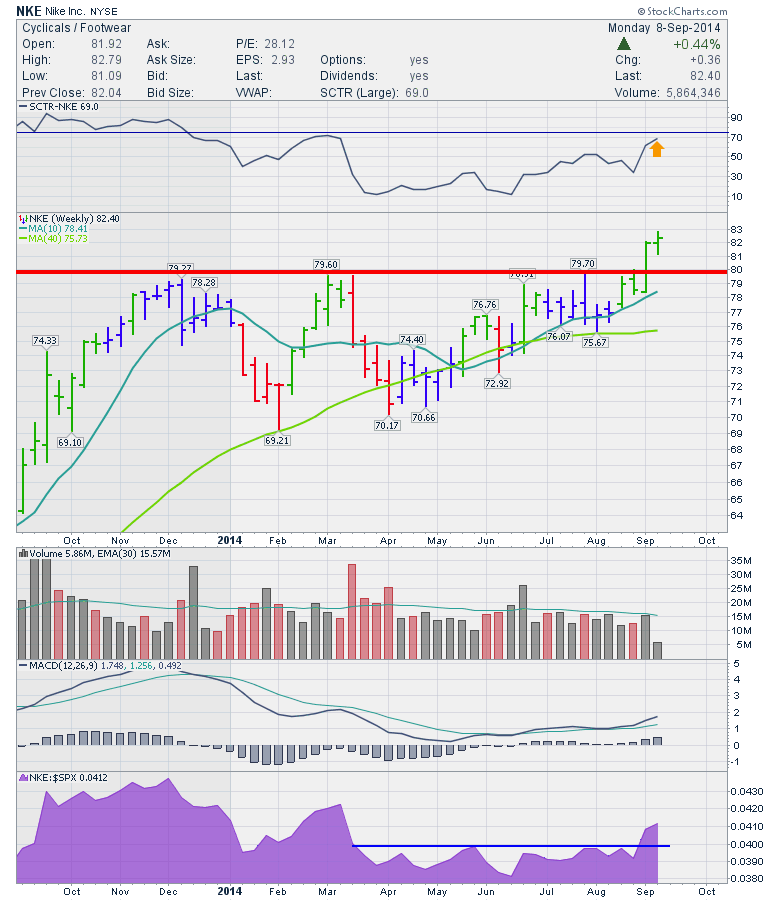
The battle for sports jerseys is always a big deal. Its an even bigger deal with the World Cup in 2014. Nike (NKE) is interesting because the stock was relatively static leading into the World Cup in Brazil. Now it has broken above a 10 month consolidation with average volume... Read More
Don't Ignore This Chart! September 08, 2014 at 04:00 PM
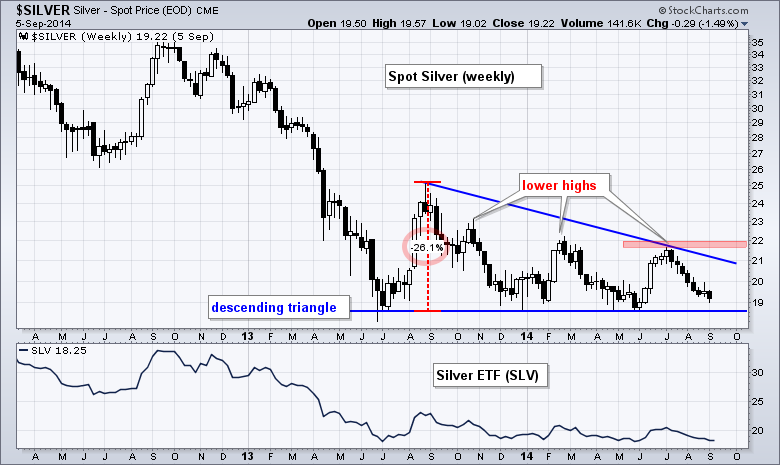
The chart below shows Spot Silver ($SILVER) consolidating after a sharp decline. Notice that the metal fell from 35 to 19 and then traded flat from June 2013 until now. With lower highs taking shape, a descending triangle has formed and this is a bearish continuation pattern... Read More
Don't Ignore This Chart! September 04, 2014 at 11:59 AM
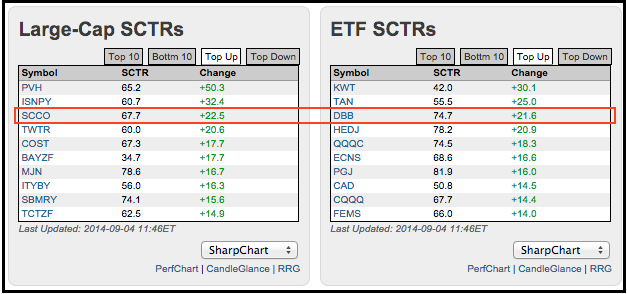
StockCharts users can find the market movers and shakers by checking the SCTR tables on our home page. Click the top up or top down tabs to see securities that show the biggest gains or losses in relative strength... Read More
Don't Ignore This Chart! September 03, 2014 at 12:06 PM
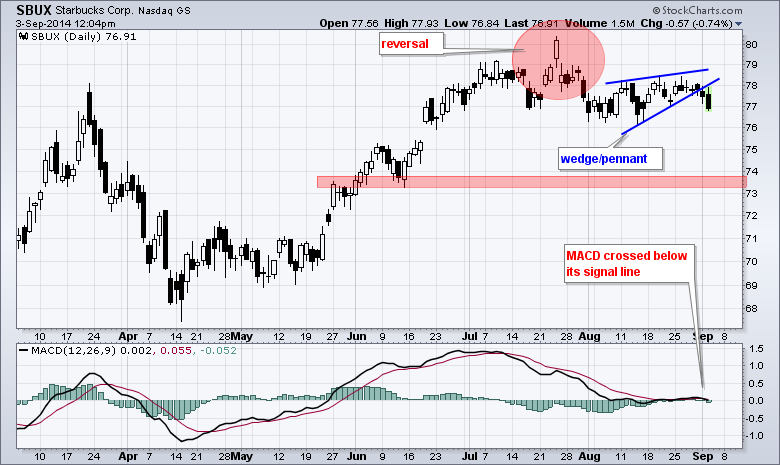
The S&P 500 is up around over 4 percent the last four weeks, but Starbucks is underperforming and is barely positive over the same timeframe. In fact, SBUX is well below its July high and recently broke wedge support... Read More
Don't Ignore This Chart! September 01, 2014 at 10:57 PM
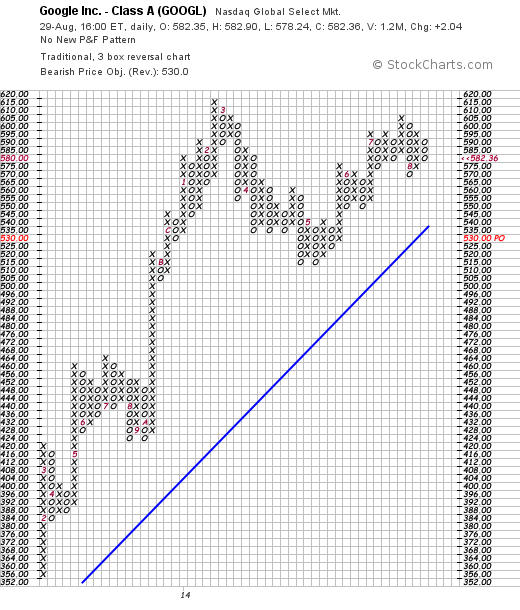
Google (GOOGL) has been holding a PnF support trend above the normal PnF major support trend. Google is currently on a sell signal because it has made a lower low than the $580 level. Since breaking below $580, Google has bounced back up and back down... Read More