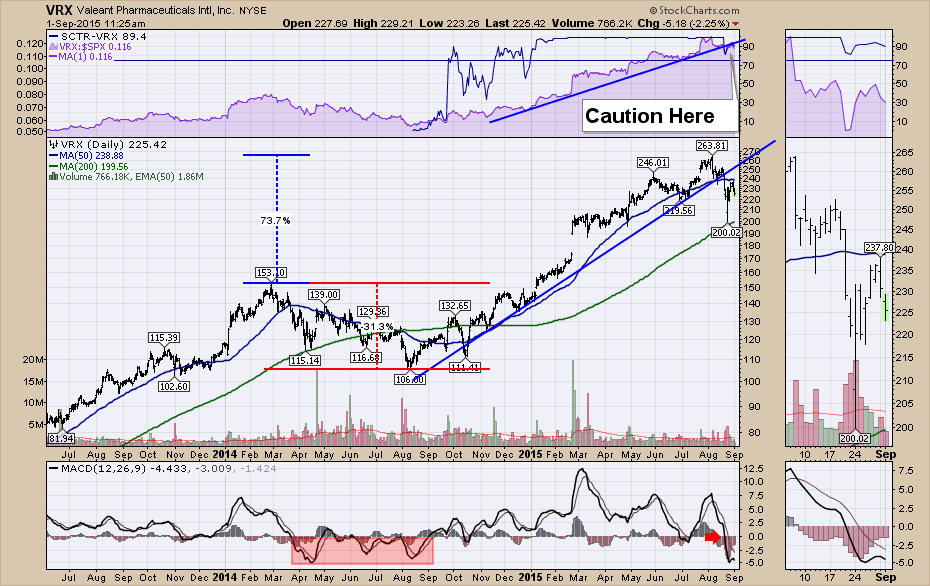
Valeant Pharmaceuticals (VRX) has been a very popular stock in North America with its acquisitive business model. The chart is showing some changes in trend, so it bears watching closely.
The SCTR ranking has started to wobble recently, which is not a problem in itself. My concern shows up in the Relative Strength trend line breaking. I don't like to see something like Valeant that was outperforming the $SPX so strongly, start to perform with or under perform the $SPX on a monthly basis. We can see the price has broken the uptrend line after a 73% gain from January 1, which also was when the stock started to make new 52 week highs. In the zoom panel we can see a trend of lower lows and lower highs in the intermediate term. There is gap support around the $190 level. Recent high volume days are all red candles and some days were double the average. Lastly the MACD has moved below zero which is a concern. Notice how the stock behaved in 2014 after momentum turned negative.
The Canadian version of the same chart shows similar information with different percentages in Canadian dollars. While the selling volume was not as extreme, that could be due to the lack of choice for strong stocks in Canada. Most of the Canadian stocks are below the 200 DMA.
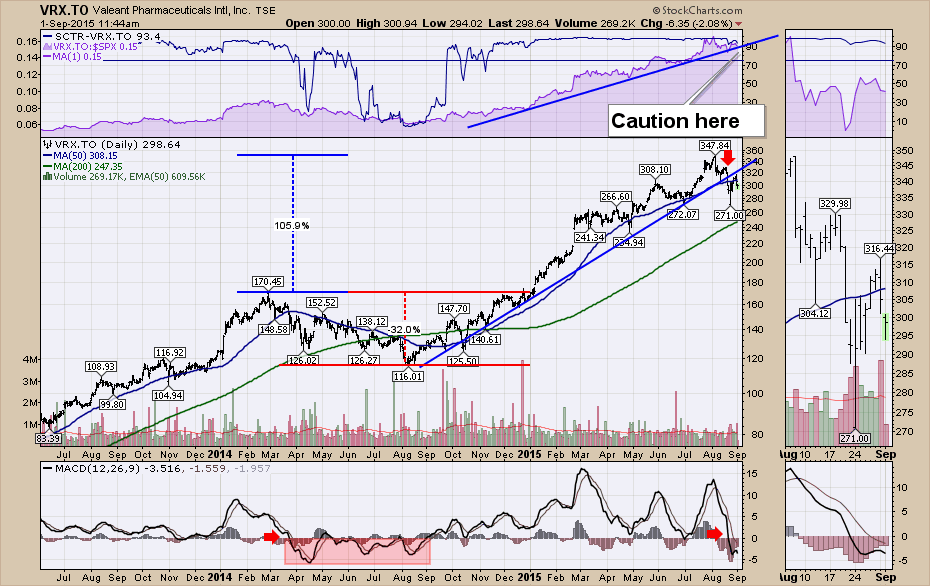
The Valeant charts look like they might need some protection in the form of options or position size just to ensure that all the gains made are not given back. While it might not be a long term weakening, it is important to recognize the stock is changing behaviour relative to the market and the trend. Momentum shown by the MACD has gone negative for the first time in a year which was a good sell signal or at least a defensive signal last year.
Good trading,
Greg Schnell, CMT
