Don't Ignore This Chart! July 29, 2016 at 12:15 PM

It has been a long time since we talked about Caterpillar (CAT) making new highs. The equipment machinery maker has been under duress since the oil market top in 2014... Read More
Don't Ignore This Chart! July 28, 2016 at 03:12 PM
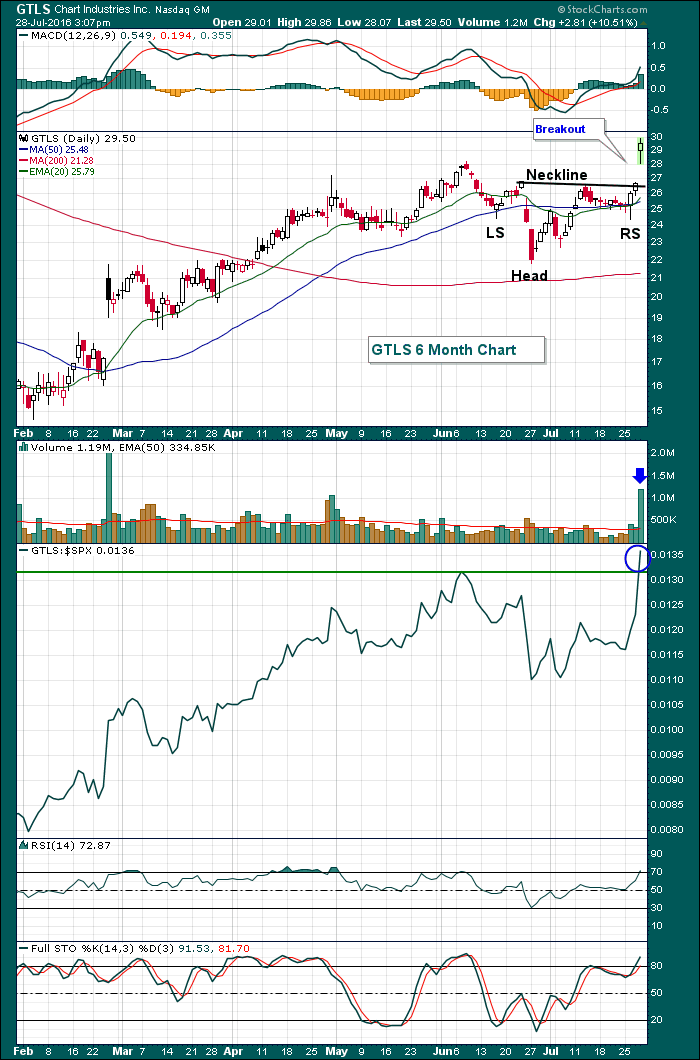
Chart Industries (GTLS) was mired in a downtrend for two years, shedding 90% of its market value, but things have changed and the upward momentum is quickly building for this equipment maker for the energy sector... Read More
Don't Ignore This Chart! July 27, 2016 at 12:16 PM
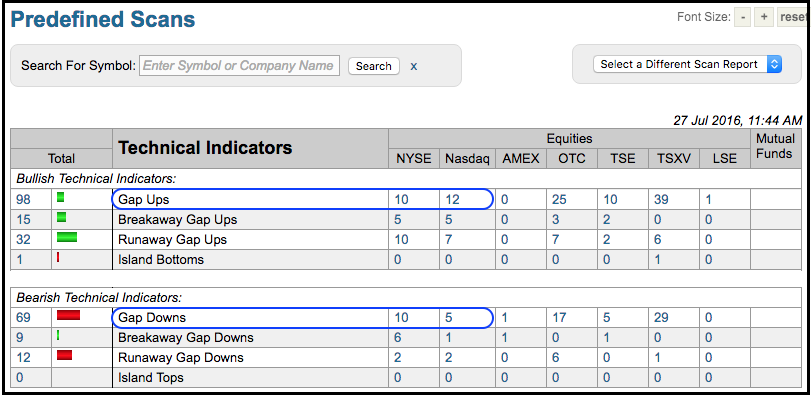
There were dozens of gaps today with most coming to the upside. Down gaps in Akamai (AKAM) and Lumber Liquidators (LL) were countered with up gaps in Apple (AAPL) and Buffalo Wild Wings (BWLD)... Read More
Don't Ignore This Chart! July 25, 2016 at 10:01 PM
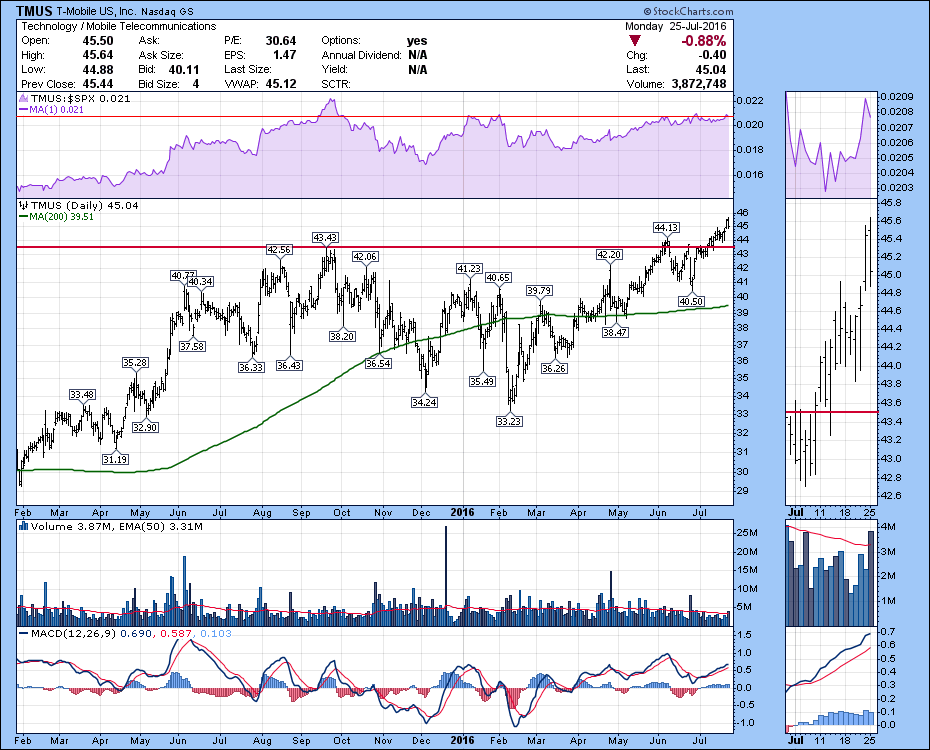
T-Mobile (TMUS) is never short of attention-getting advertising. In the stock world, nothing garners more attention than new 52 week highs. Last week T-Mobile moved to new highs but never really had a breakout size bar... Read More
Don't Ignore This Chart! July 25, 2016 at 11:53 AM
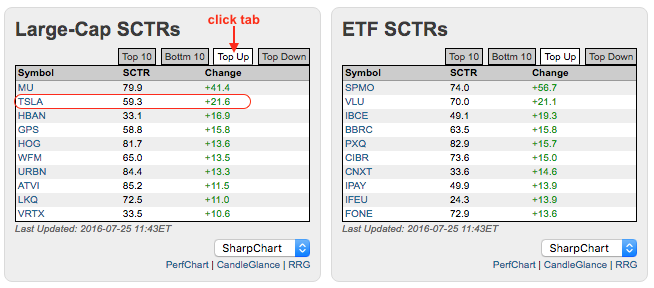
Tesla (TSLA) caught my eye on Monday because its StockCharts Technical Rank (SCTR) surged over 20 points. The image below shows the SCTR tables for large-cap stocks and ETFs. Notice that I clicked the Top Up tabs to view those with the biggest SCTR gains... Read More
Don't Ignore This Chart! July 24, 2016 at 11:06 AM
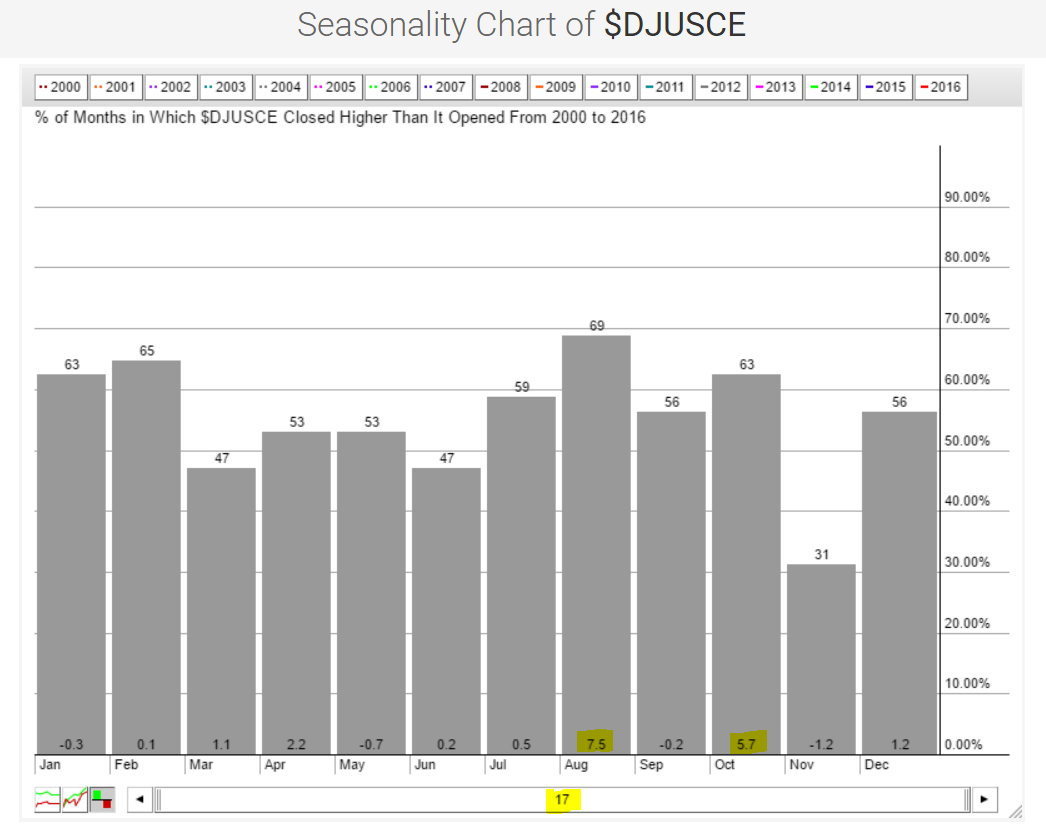
The summer months can be very difficult for U.S. equities, as history has proven over time. But there's always a bull market somewhere and the consumer electronics space seems to find a sweet spot in August... Read More
Don't Ignore This Chart! July 22, 2016 at 01:37 AM
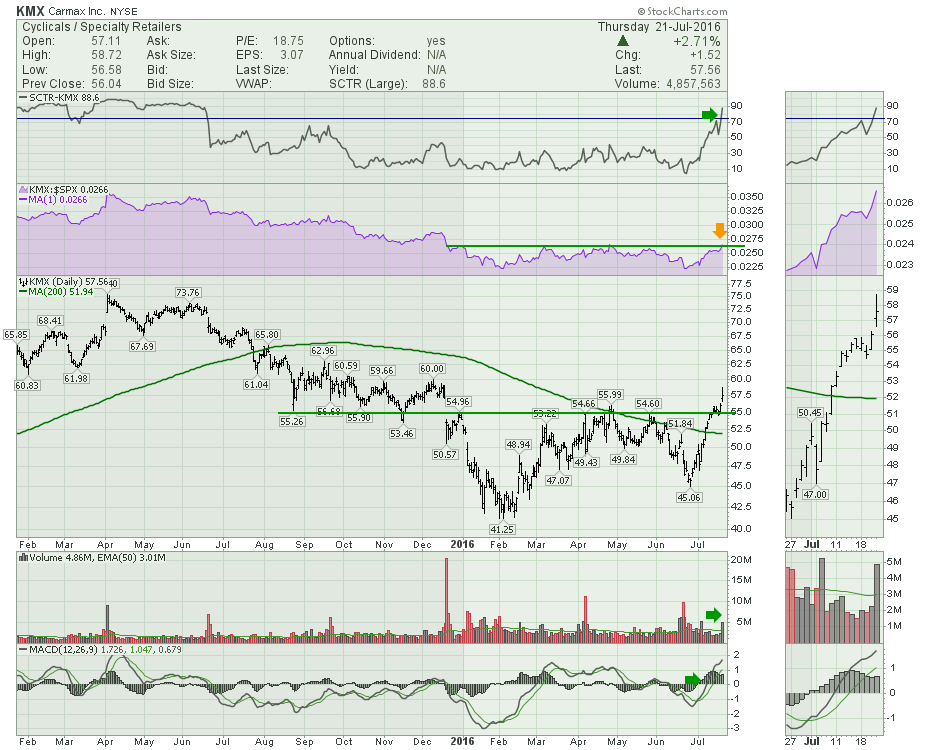
Carmax (KMX) has a great technical chart today. With the SCTR soaring to 88, the price action shows it is one of the best stocks out there. But there is a little more history on the SCTR that is important... Read More
Don't Ignore This Chart! July 21, 2016 at 01:40 PM
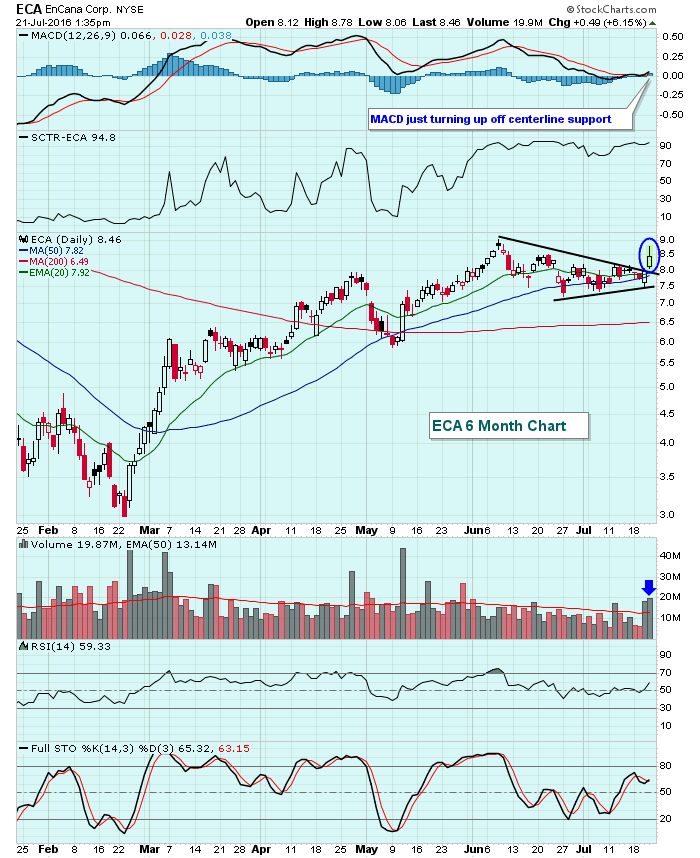
Actually, Encana (ECA) has broken two downtrends - a short-term trend and a long-term trend. ECA hit its all-time high of roughly 42.50 just before this bull market began... Read More
Don't Ignore This Chart! July 20, 2016 at 11:26 AM
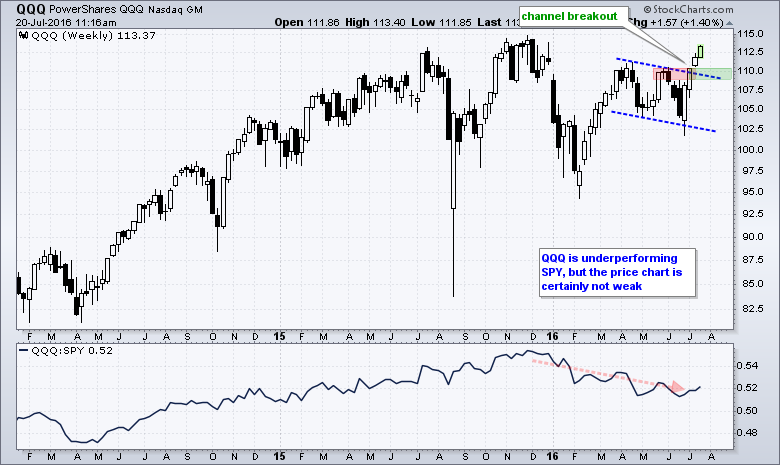
The surge in stocks entered its fourth week with QQQ extending its channel breakout. The chart below shows the ETF surging earlier this year and then embarking on a correction with a falling channel into June... Read More
Don't Ignore This Chart! July 19, 2016 at 01:40 PM
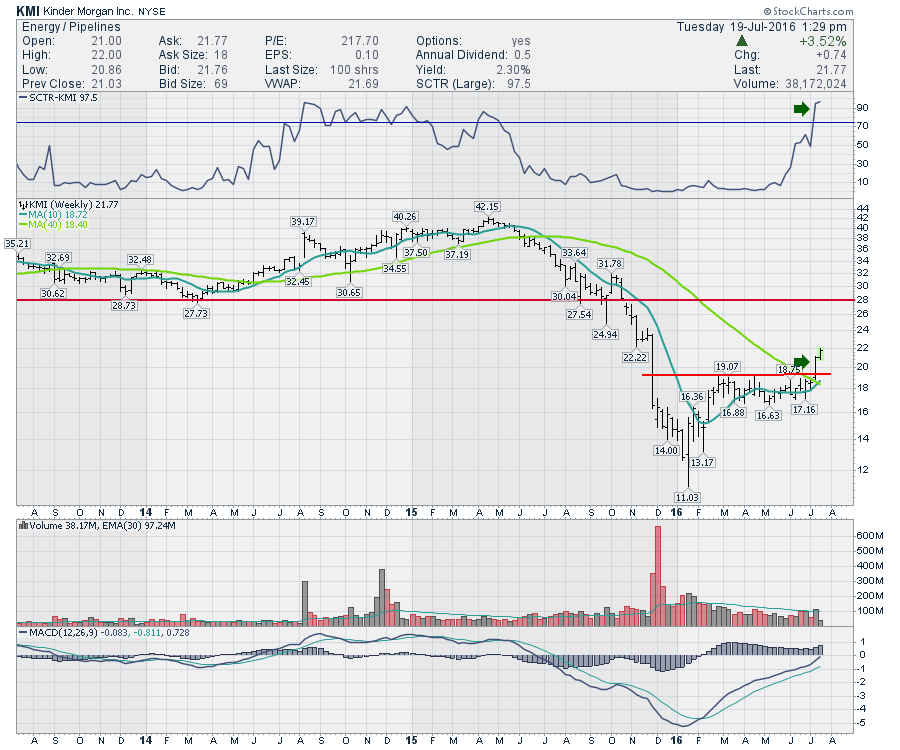
Kinder Morgan (KMI) is a large energy transporter with pipelines and storage across North America. This vast network of systems is a key component to the energy infrastructure and flow of key commodities... Read More
Don't Ignore This Chart! July 18, 2016 at 11:37 AM
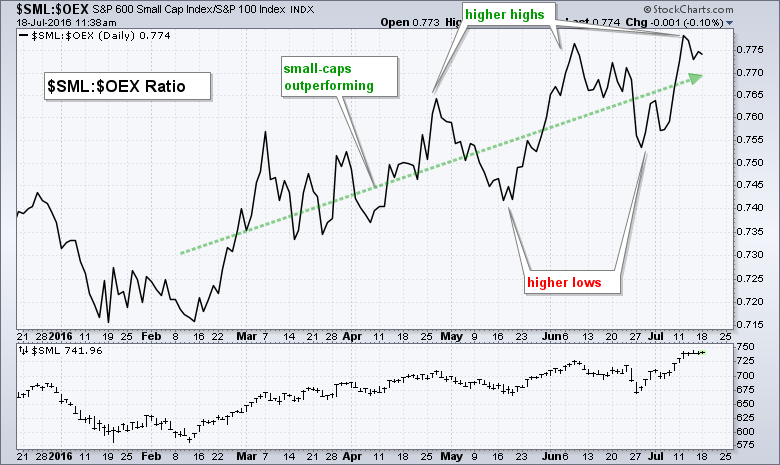
The S&P Small-Cap 600 has been leading the S&P 500 since mid February as a key ratio chart hit a multi-month high last week. The main window in the chart below shows the $SML:$OEX ratio, which plots the performance of the S&P Small-Cap 600 relative to the S&P LargeCap 100... Read More
Don't Ignore This Chart! July 15, 2016 at 12:35 AM
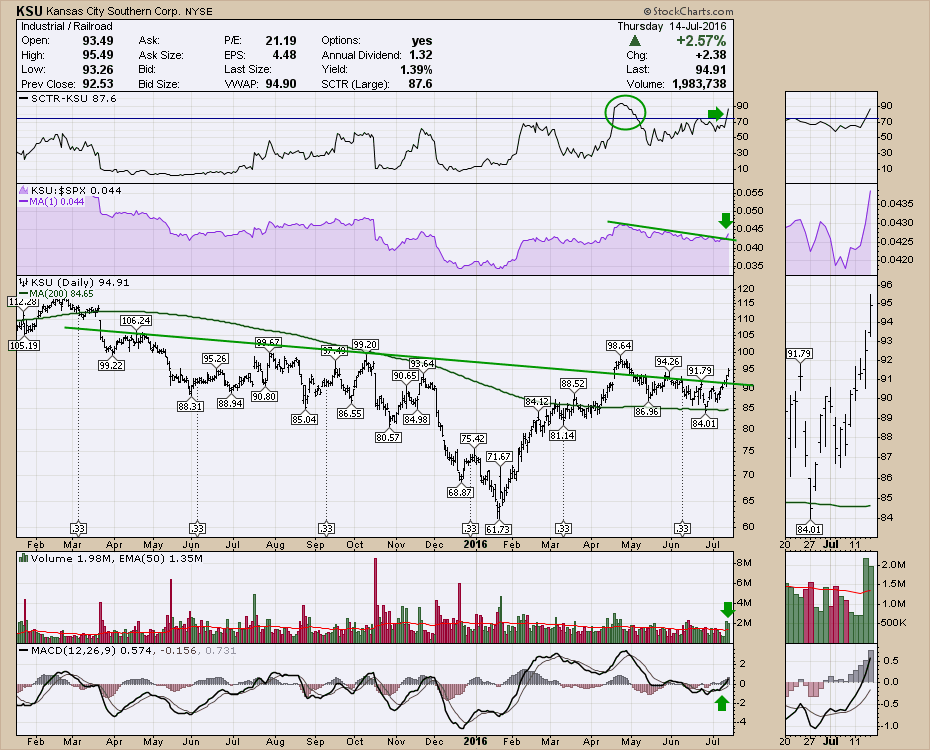
This week all the railways accelerated higher and the Railway Index broke out to new highs. But the breadth across all the railways is particularly important. I've chosen Kansas City Southern (KSU) to demonstrate the railways are breaking out... Read More
Don't Ignore This Chart! July 14, 2016 at 09:32 AM
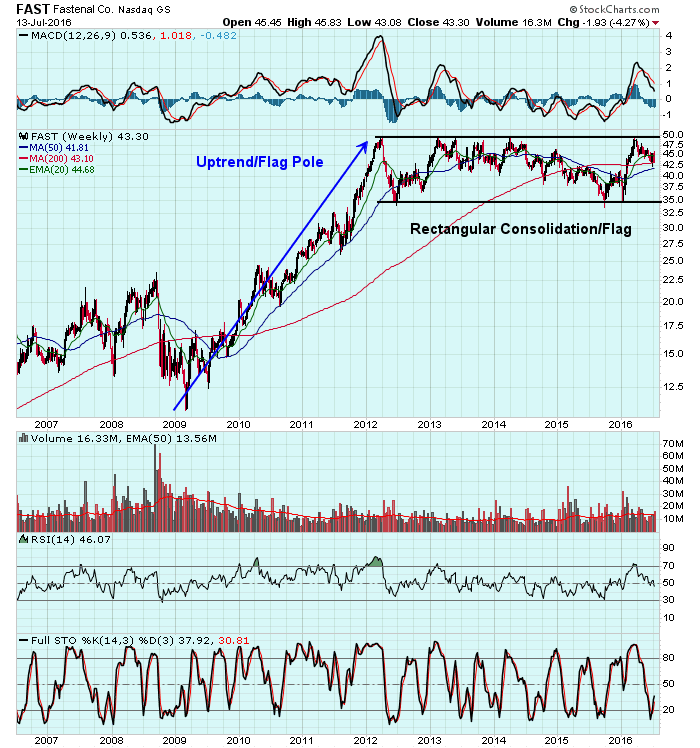
Prior to the opening bell on Tuesday, Fastenal (FAST) confessed to below consensus revenues and EPS, normally a big problem for a stock. Sure enough, FAST fell approximately 4% on the open Tuesday, providing short sellers a quick profit... Read More
Don't Ignore This Chart! July 13, 2016 at 01:26 AM
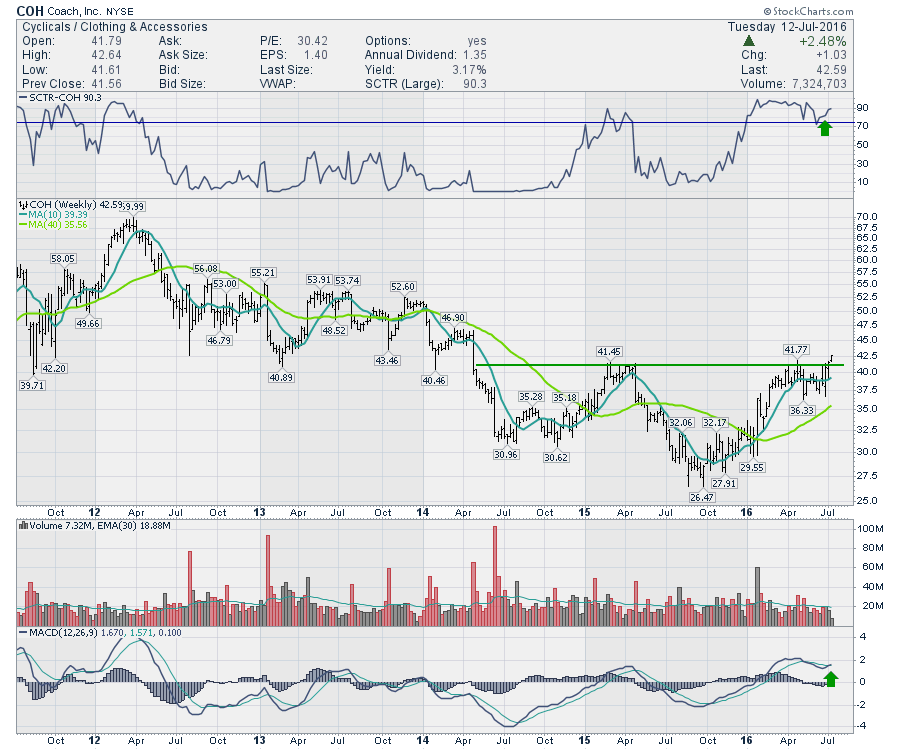
Coach (COH) has been a beaten up premium retailer the last few years. Today marks an interesting change in trend for the retailer. The SCTR has been above 75 all year, but today marks a break in the stock above previous resistance to a new 2-year high. The yield is healthy at 3... Read More
Don't Ignore This Chart! July 11, 2016 at 12:08 PM
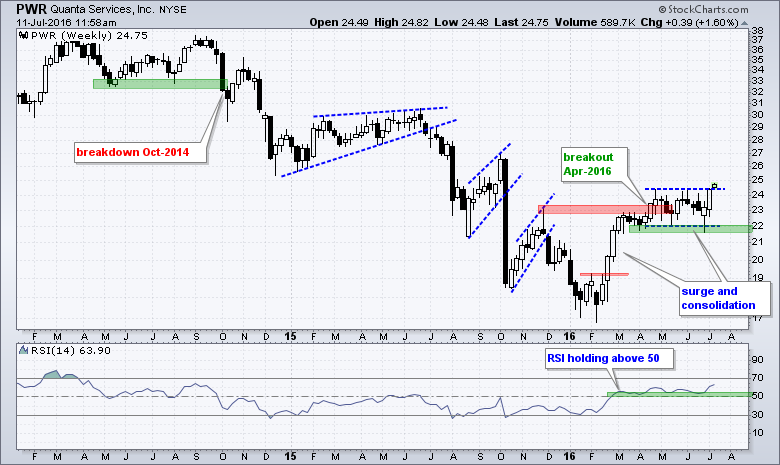
Quanta Services (PWR) is showing signs of a long-term trend reversal with its third resistance break this year. The weekly chart shows PWR breaking down in October 2014 and trending lower until early 2016... Read More
Don't Ignore This Chart! July 10, 2016 at 08:36 PM
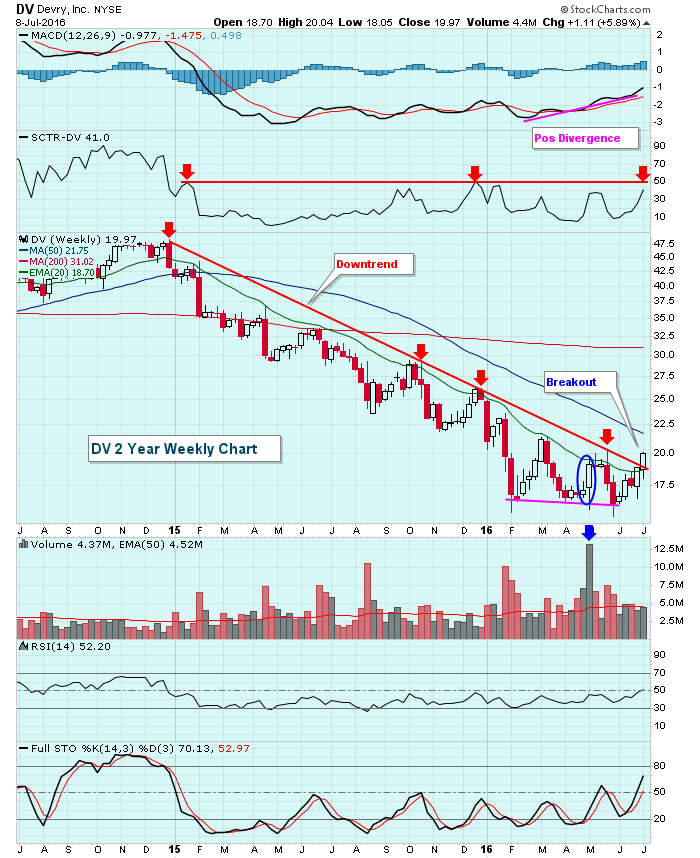
Devry, Inc. (DV) topped at close to 50.00 during the fourth quarter of 2014 and it has spent the last 18 months declining steadily until reaching what now appears to be a bottom just above 15.00... Read More
Don't Ignore This Chart! July 08, 2016 at 01:47 AM
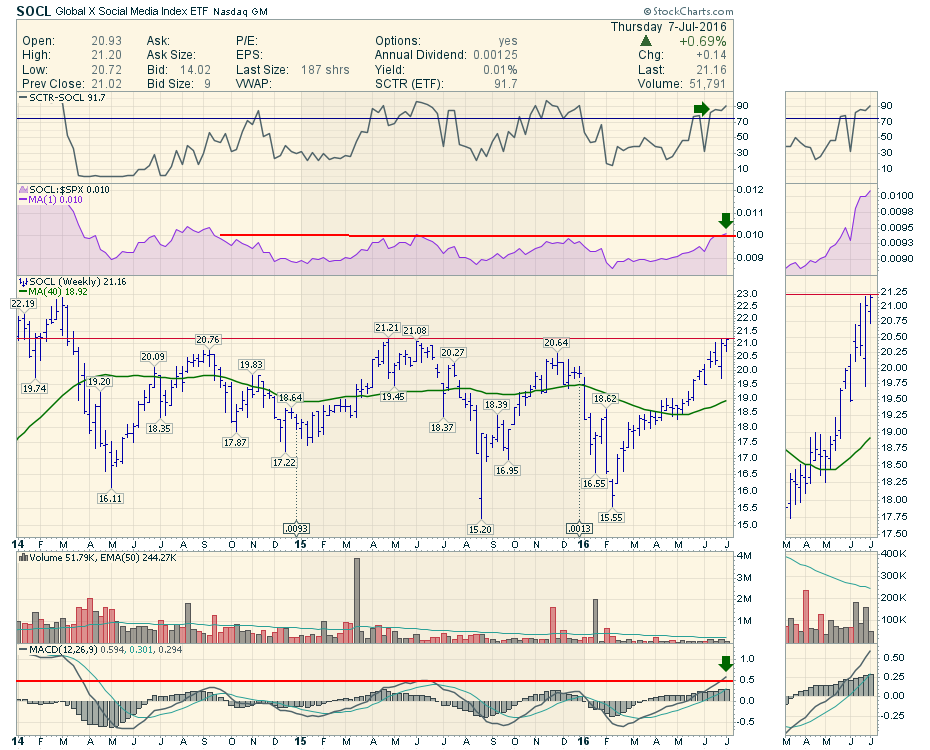
I spent some time on the Commodities Countdown webinar discussing the second half of the year. Currently, there are four growth-related ETF charts that are set up to break out. Should that happen, that would be a significant trend change. One example is the Social ETF (SOCL)... Read More
Don't Ignore This Chart! July 07, 2016 at 03:32 PM
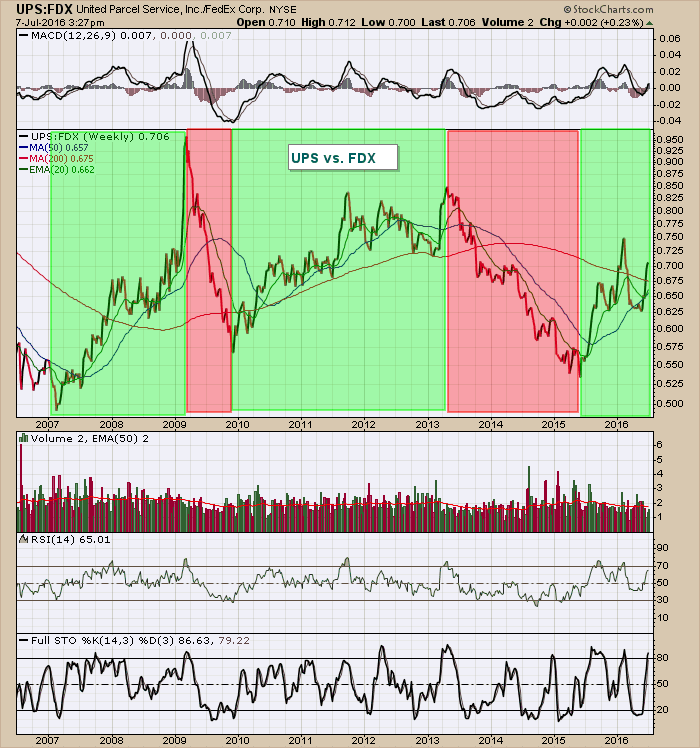
Over the past year, United Parcel Service (UPS) has gained 13.77% while FedEx Corporation (FDX) has lost 9.80%... Read More
Don't Ignore This Chart! July 06, 2016 at 08:50 AM
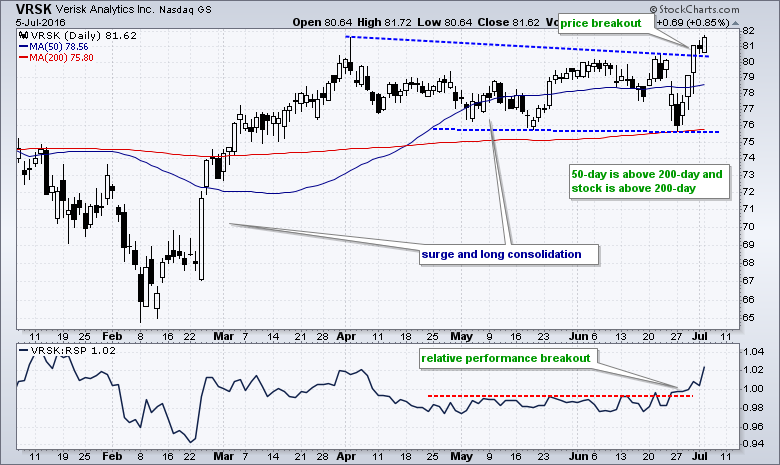
Verisk (VRSK) was not immune to the volatility of the last two weeks, but the stock held up well during the dip and outperformed during the bounce. First, notice that the stock ultimately held the mid May low and 200-day SMA during the late June dip... Read More
Don't Ignore This Chart! July 05, 2016 at 03:54 PM
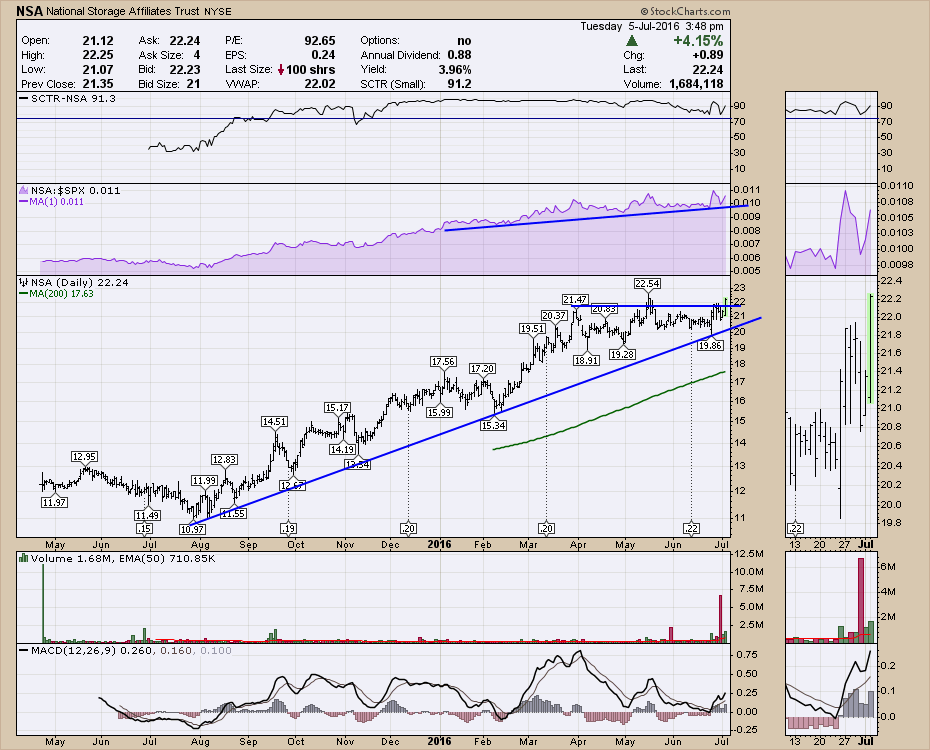
In a yield-seeking world, the story for REIT's and Trusts seems stronger than ever. The stable cash flow in an otherwise turbulent world is attracting the investment dollar... Read More
Don't Ignore This Chart! July 04, 2016 at 03:49 AM
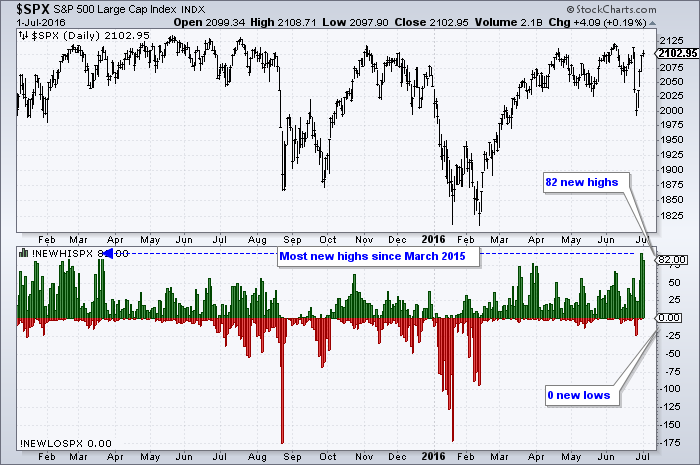
The S&P 500 surged over the last four days and new highs in the S&P 500 expanded to their highest level since March 2015. The chart below shows $SPX surging around 5% in four days and new highs exceeding 80 the last two days... Read More
Don't Ignore This Chart! July 03, 2016 at 10:49 AM
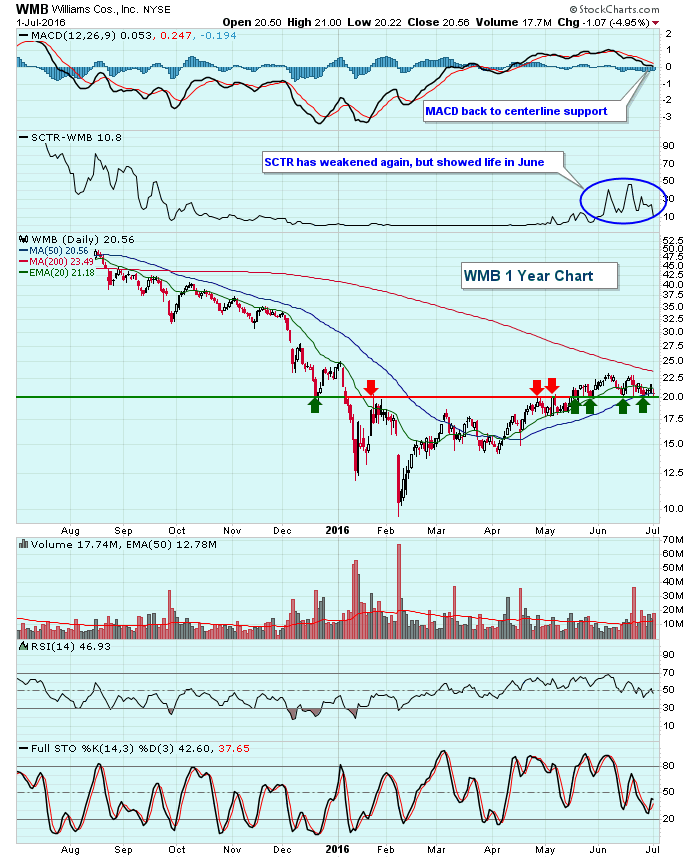
Over the past six months, the Dow Jones U.S. Pipelines Index ($DJUSPL) has gained 25.03% and has been among the best performing industry groups. But it hasn't been favorable for all pipeline stocks as Williams Companies (WMB) can attest... Read More
Don't Ignore This Chart! July 01, 2016 at 02:55 PM
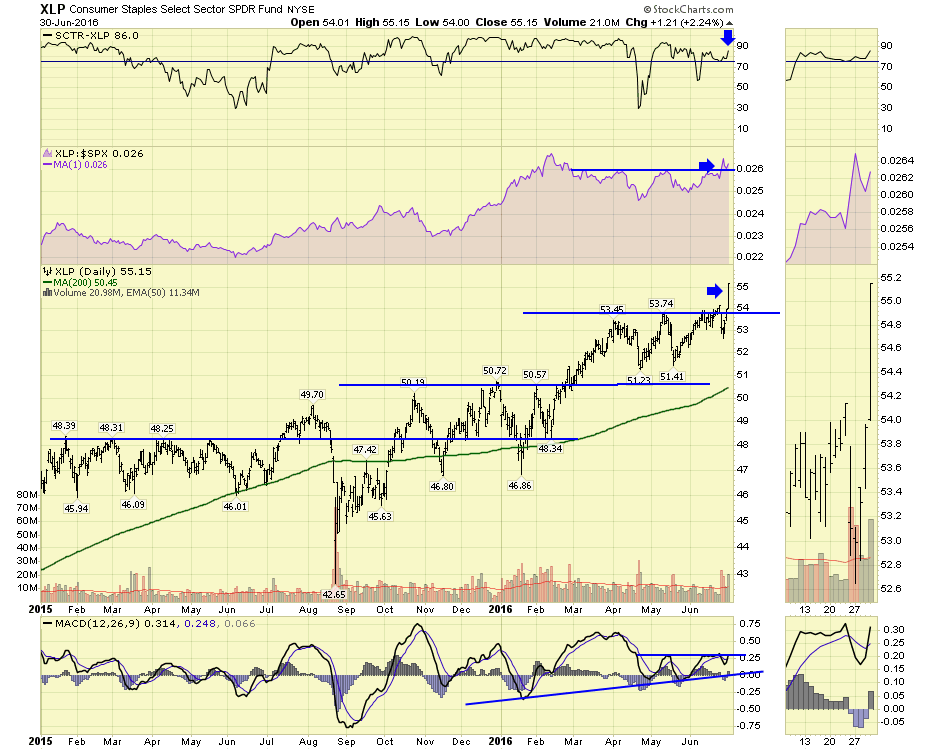
The Brexit vote made large 5% swings in the market both ways this week. What could possibly be next? After a major market event, watching the rotation of money into the various sectors can help us understand where investors are getting positioned... Read More