Don't Ignore This Chart! October 30, 2017 at 12:22 PM
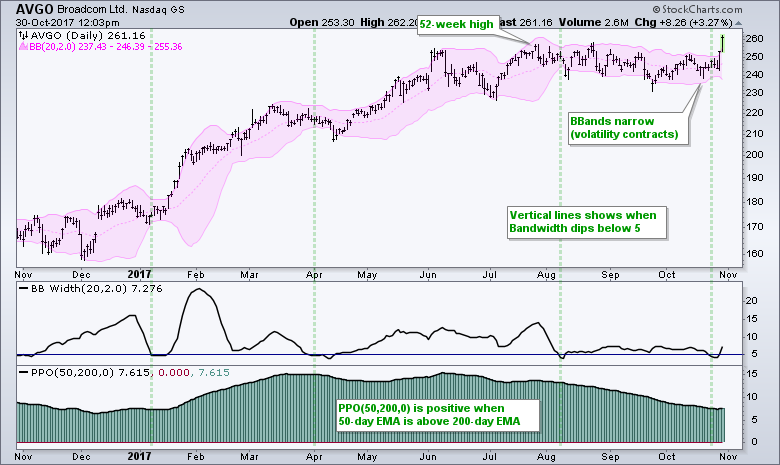
BroadCom looks set to continue its long-term uptrend with a breakout and fresh 52-week high. The chart shows BroadCom (AVGO) with Bollinger Bands, the Bandwidth indicator and the Percentage Price Oscillator (PPO)... Read More
Don't Ignore This Chart! October 29, 2017 at 10:23 AM
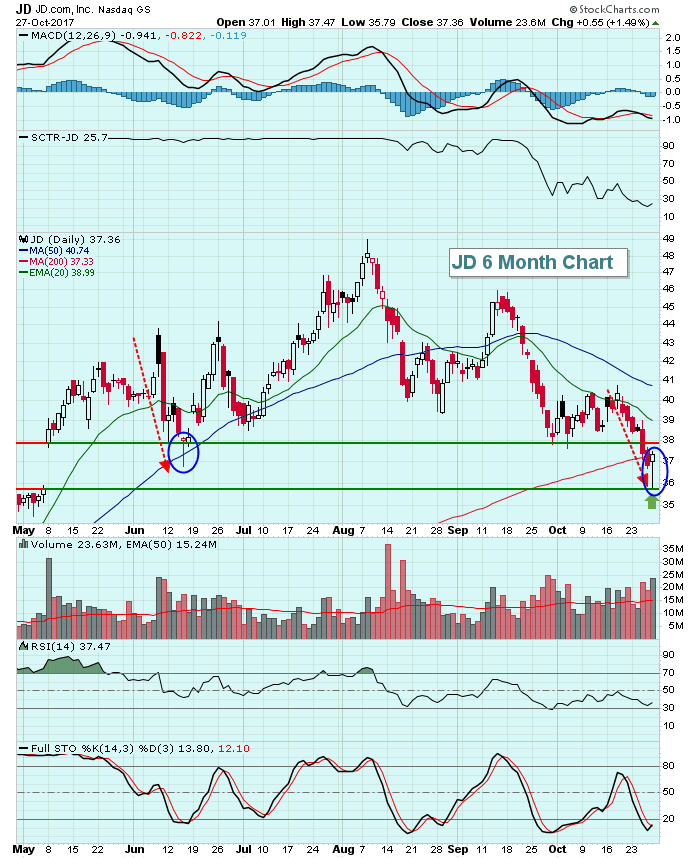
I'm a big fan of candlesticks, particularly reversing candlesticks as they many times signal that a short-term downtrend has ended in an overall uptrending stock. One of my favorite trading strategies is to trade strong stocks off gap support... Read More
Don't Ignore This Chart! October 28, 2017 at 04:58 AM
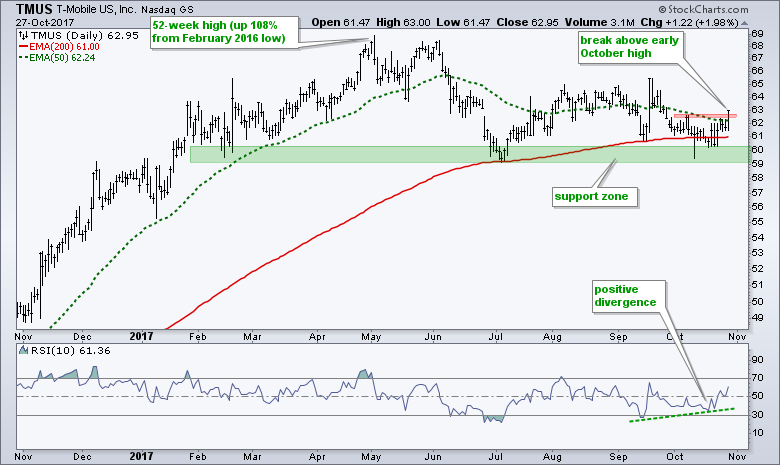
T-Mobile is showing signs of life with an upturn off support and a positive divergence in RSI. As always, lets review the bigger picture before trying to make sense of current conditions. TMUS basically doubled from February 2016 to April 2017 with a 108% advance... Read More
Don't Ignore This Chart! October 26, 2017 at 09:56 PM
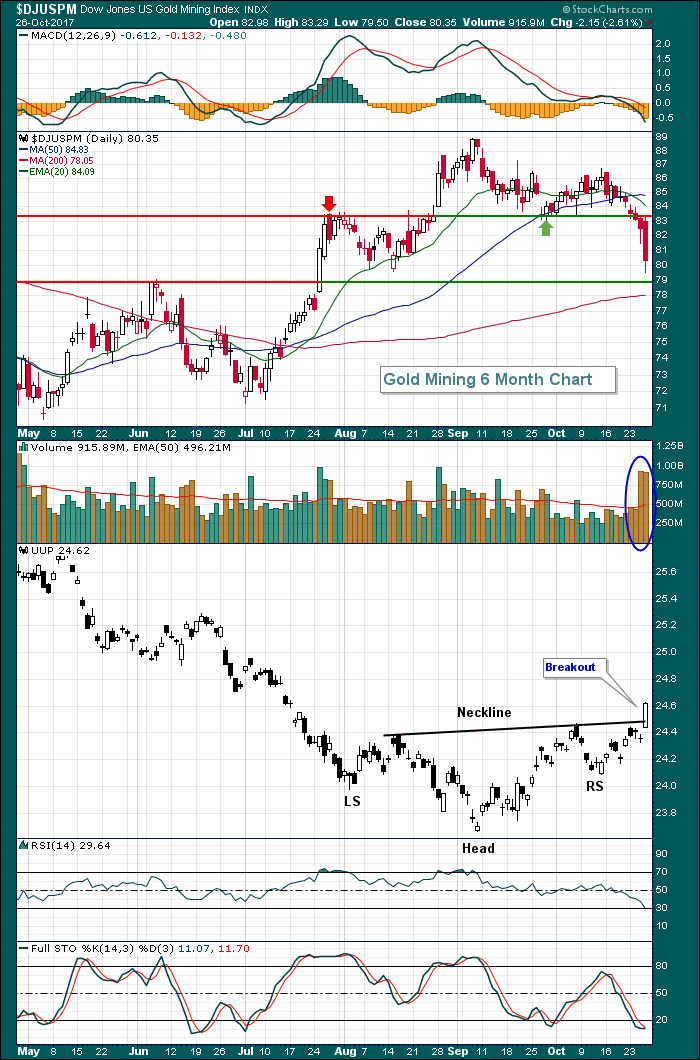
The Dow Jones U.S. Gold Mining Index ($DJUSPM) held price support on its late-September swoon, but that was not the case with the recent selling. The reason? It's probably the reverse head & shoulders breakout on the U.S. Dollar (UUP)... Read More
Don't Ignore This Chart! October 25, 2017 at 11:42 AM
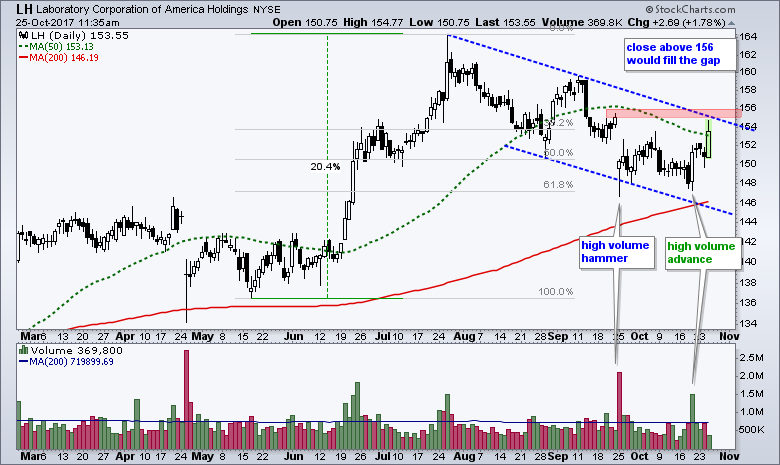
Laboratory Corporation of America (LH) reported earnings today and surged above the 50-day moving average on the results. The trend since late July remains down, but recent price action is constructive and a breakout could be in the offing... Read More
Don't Ignore This Chart! October 24, 2017 at 12:01 PM
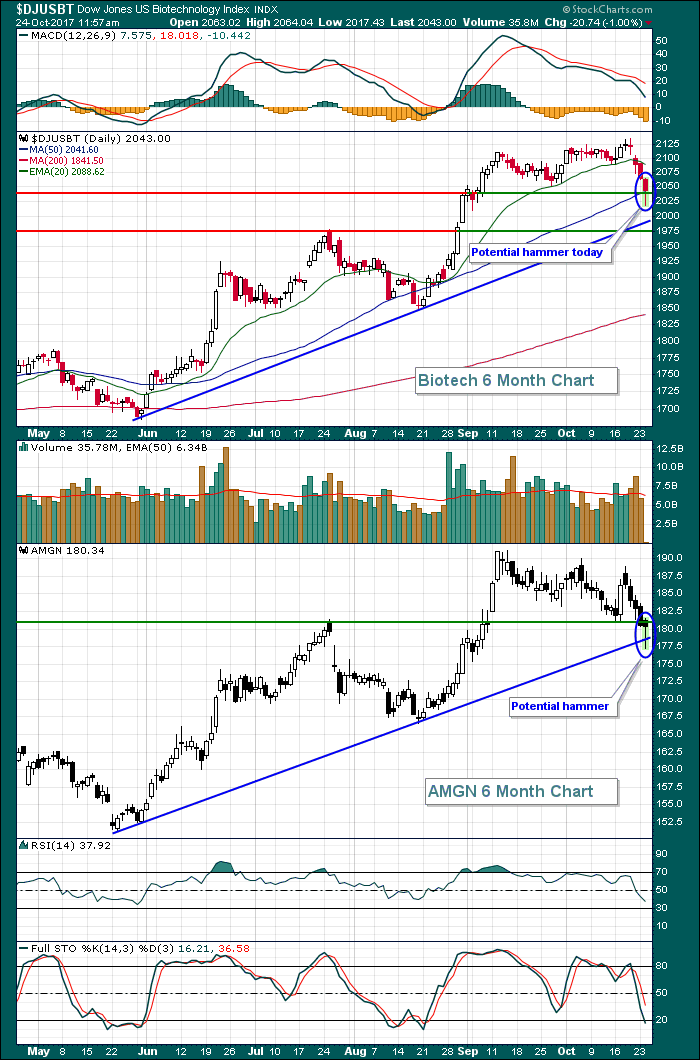
The Dow Jones U.S. Biotechnology Index ($DJUSBK) broke out of serious longer-term consolidation when it cleared 1800 price resistance in mid-June. Since then, we've seen a nice uptrend, characterized by rapid advances and steady pullbacks... Read More
Don't Ignore This Chart! October 23, 2017 at 09:37 AM
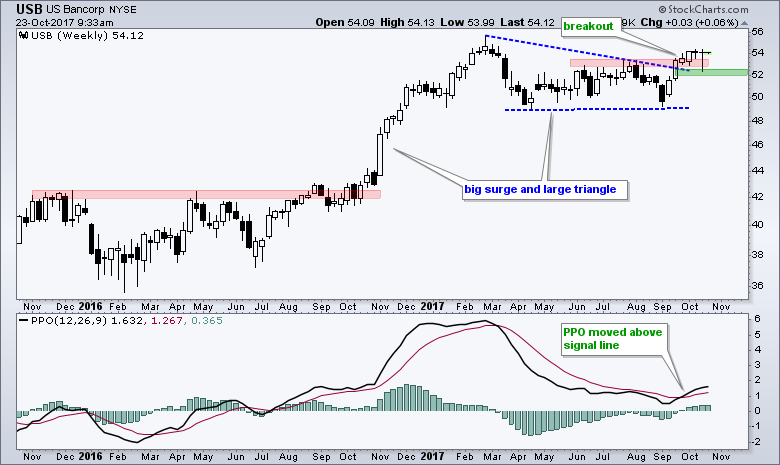
US Bancorp (USB) ended a long corrective period with an upside breakout and this breakout is holding. Note that USB is part of the Financials SPDR (XLF) and the Regional Bank SPDR (KRE)... Read More
Don't Ignore This Chart! October 22, 2017 at 11:25 AM
Let me start by stating that the NASDAQ 100 has earned 61.9% of its gains over the past 20 years during the fourth quarter. Yep, October through December has accounted for nearly two thirds of the gains on the NASDAQ 100... Read More
Don't Ignore This Chart! October 20, 2017 at 06:23 AM
In the top-right corner of the homepage at StockCharts.com, there is a table that holds "Market Movers". It defaults to the top10 "most active" in the S&P 500 but you can change that using the buttons and drop-downs... Read More
Don't Ignore This Chart! October 19, 2017 at 09:17 PM
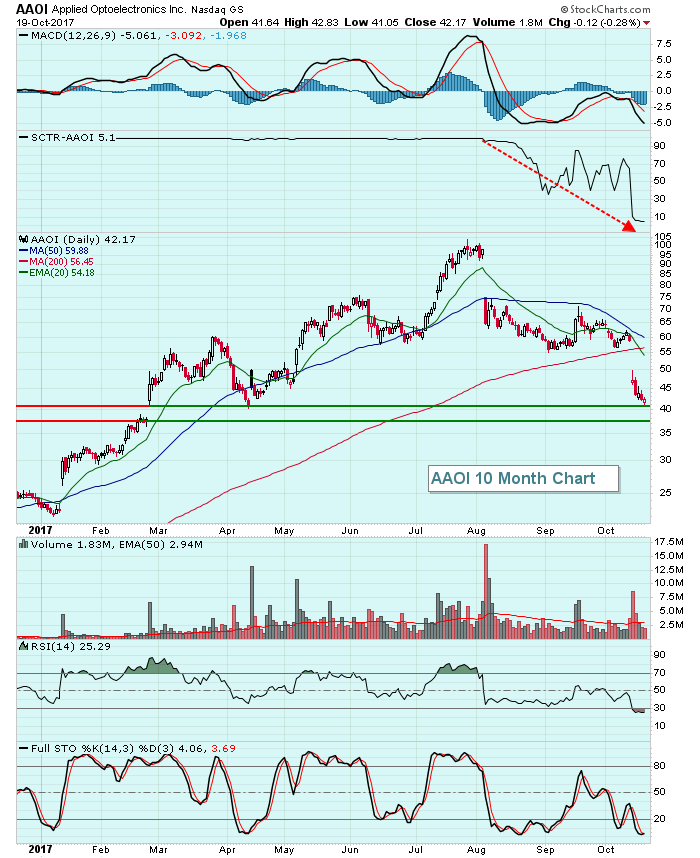
Applied Optoelectronics (AAOI) was one of the darlings of Wall Street in 2017.....until early August. Since that time, AAOI has declined nearly 60% in less than three months and has shown no signs of a reversal... Read More
Don't Ignore This Chart! October 18, 2017 at 08:40 AM
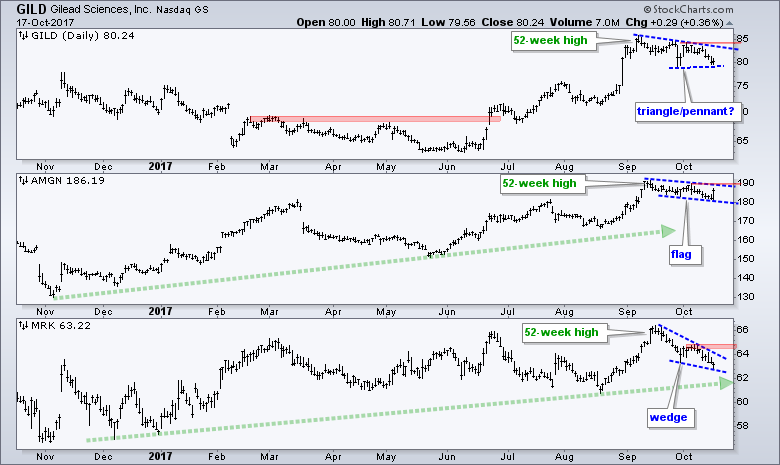
Chartists should watch Gilead (GILD), Amgen (AMGN) and Merck ($MRK) because all three are forming bullish continuation patterns. First and foremost, all three hit new highs in September so it is safe to assume that the long-term trends are up... Read More
Don't Ignore This Chart! October 17, 2017 at 07:57 PM
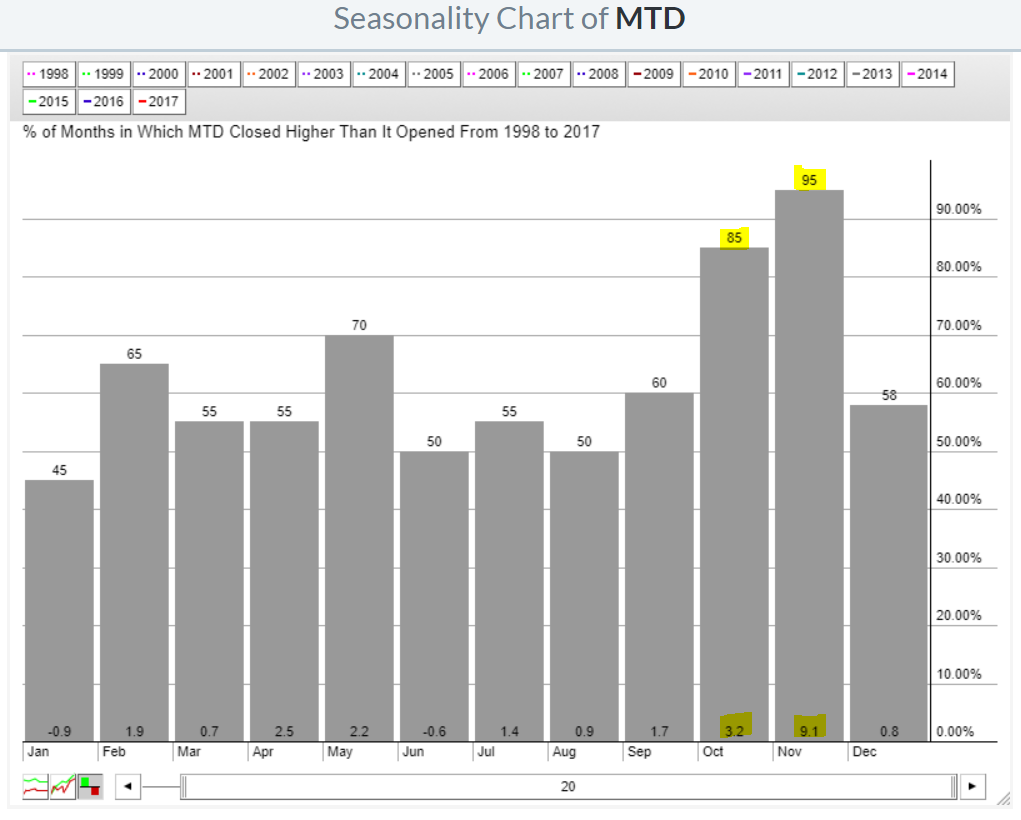
Over the past twenty years, Mettler Toledo Intl (MTD) has averaged gaining 23% per year, but that's not the most impressive performance stat for the company. During the months of October and November, MTD has risen 85% and 95% of the time, gaining an average of 3.3% and 9... Read More
Don't Ignore This Chart! October 16, 2017 at 09:10 AM
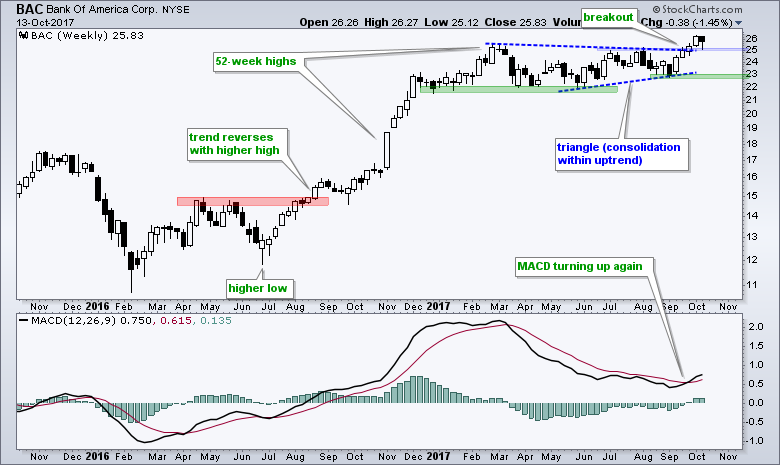
Bank of America (BAC) broke out of a large bullish continuation pattern three weeks' ago and this breakout is holding. Overall, BAC surged from June 2016 to February 2017 and then consolidated with a large triangle pattern... Read More
Don't Ignore This Chart! October 14, 2017 at 02:45 PM
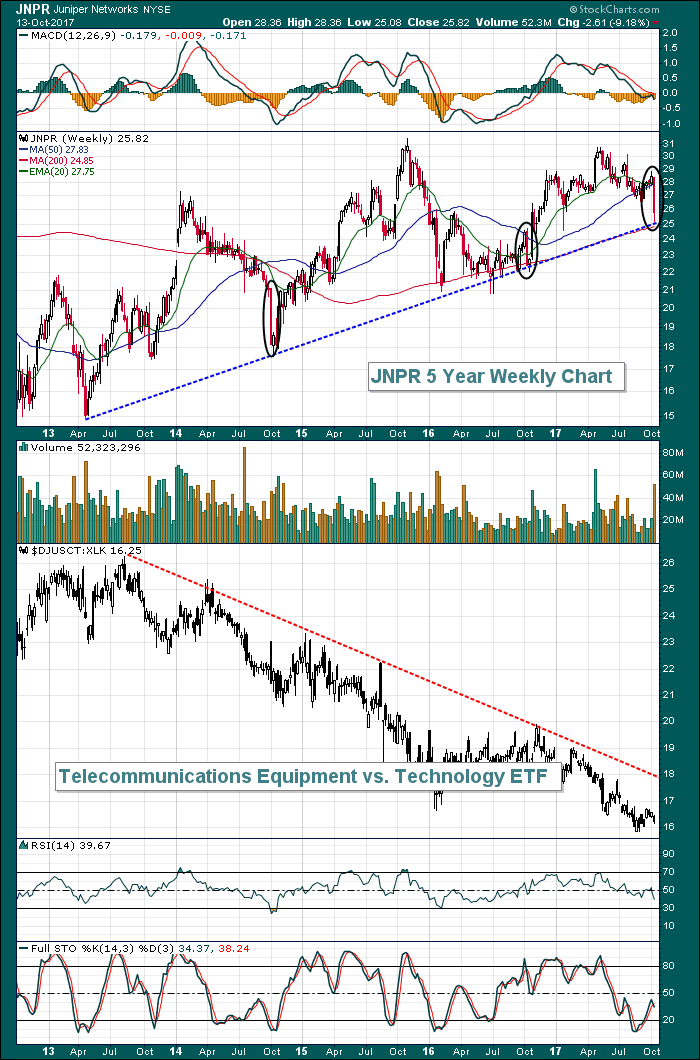
Juniper Networks (JNPR) was under heavy selling pressure last week to open October, a seasonally bullish month for JNPR as the stock has averaged gaining more than 13% each October over the past two decades... Read More
Don't Ignore This Chart! October 13, 2017 at 05:24 PM
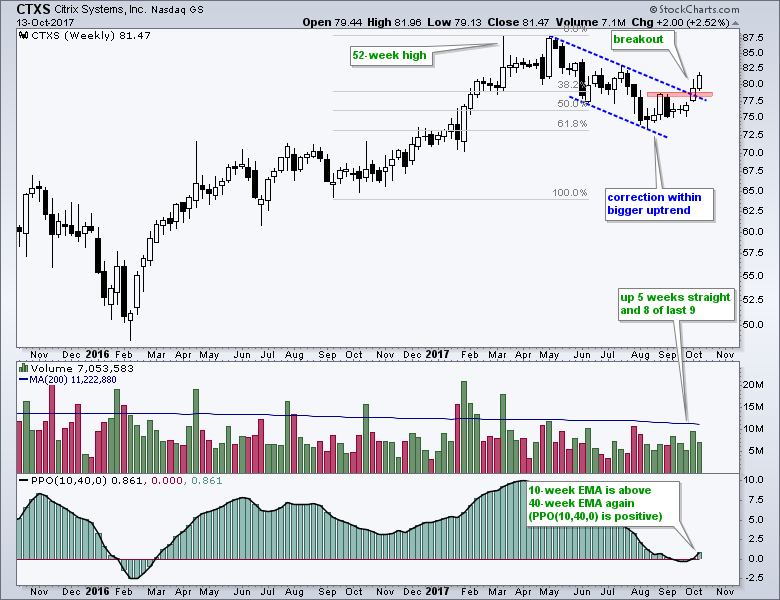
Citrix (CTXS), which is part of the Internet ETF (FDN) and Software iShares (IGV), appears to have ended its correction and resumed its long-term uptrend. The stock hit a 52-week high in early 2017 and then declined from May to August... Read More
Don't Ignore This Chart! October 12, 2017 at 11:42 AM
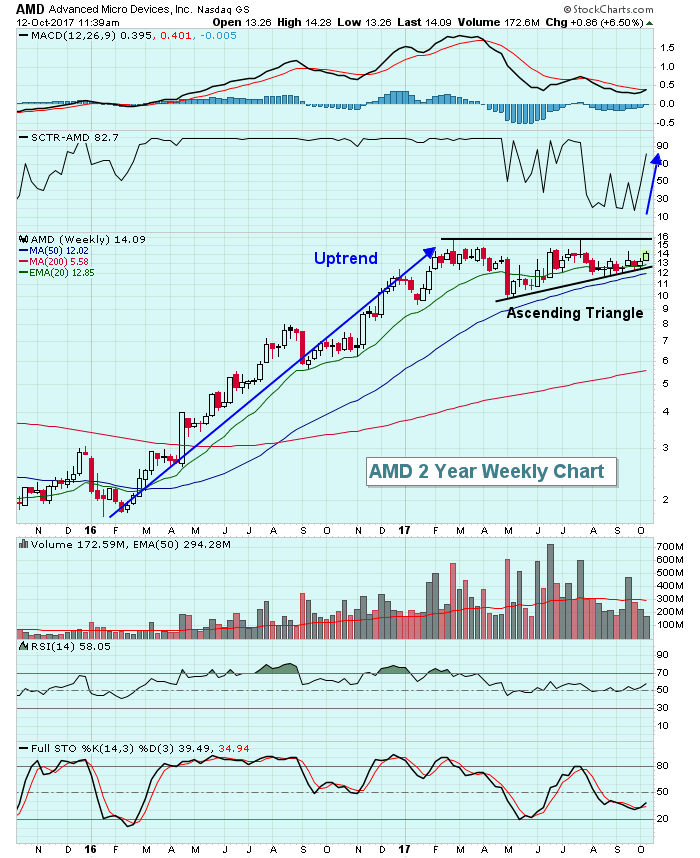
Advanced Micro Devices (AMD) spent over a year with its SCTR among the highest of all individual stocks. It was an impressive rally for sure as its stock price rose from below $2 to above $15 in 13 months... Read More
Don't Ignore This Chart! October 11, 2017 at 10:43 AM
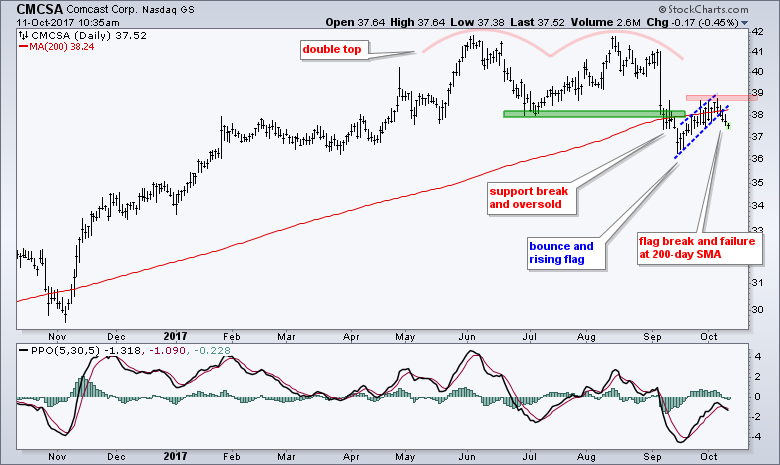
A recent double top and failure at the 200-day SMA point to lower prices for Comcast (CMCSA). The double top formed from May to early September with two highs around 42 and a low around 38. Comcast broke this low with a sharp decline and then became oversold... Read More
Don't Ignore This Chart! October 10, 2017 at 02:24 PM
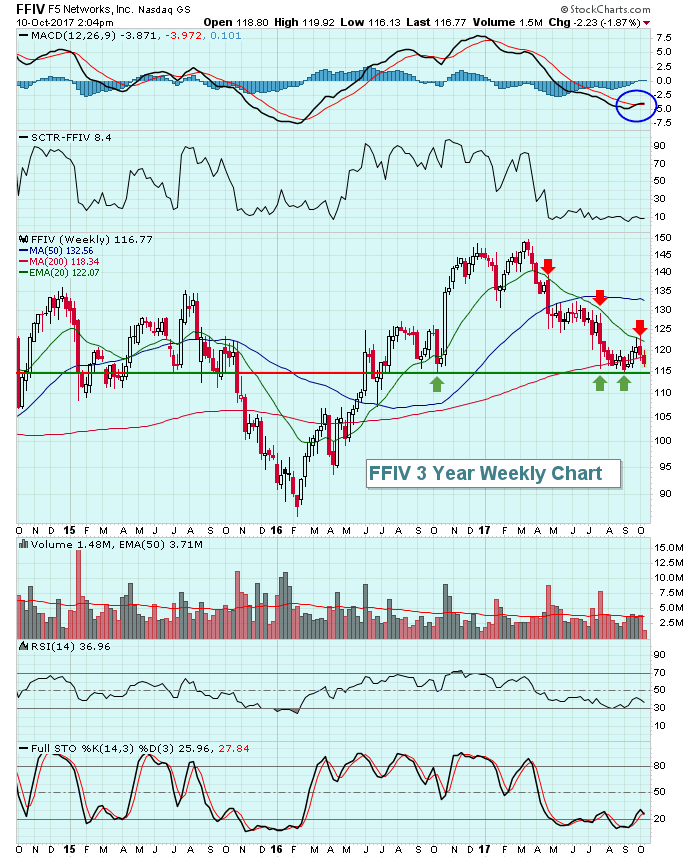
F5 Networks (FFIV) has a seasonal history of performing extremely well in October and November, but technically the stock has been a wreck since topping in March 2017 and the early October returns haven't been very good either... Read More
Don't Ignore This Chart! October 09, 2017 at 05:05 PM
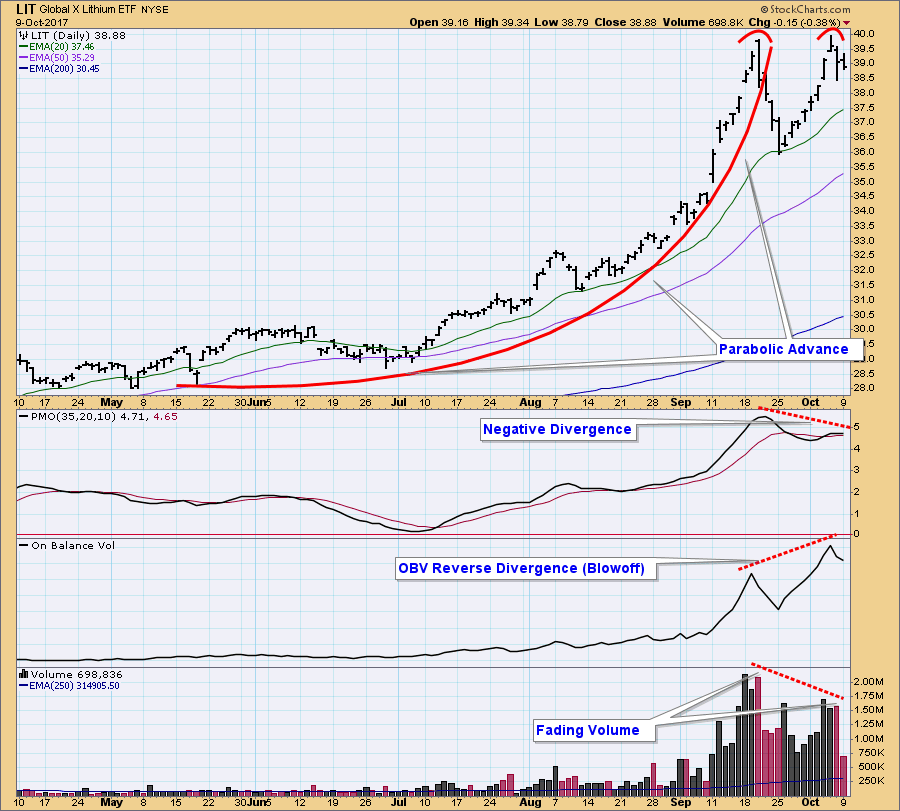
This morning I saw a commercial for the Global X Lithium ETF (LIT), and I thought, "Hmmm, lithium . . . batteries for iPhones, MacBooks, etc." So I pulled up a chart of LIT, and all kinds of things jumped out at me... Read More
Don't Ignore This Chart! October 09, 2017 at 11:53 AM
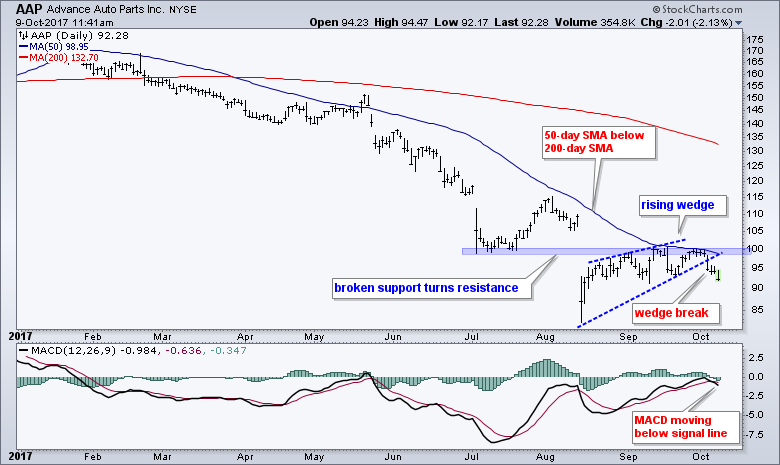
The S&P 500 is near all time highs and we are in a bull market, but Advance Auto Parts (AAP) did not get the memo and recent signals point to new lows... Read More
Don't Ignore This Chart! October 08, 2017 at 10:51 AM
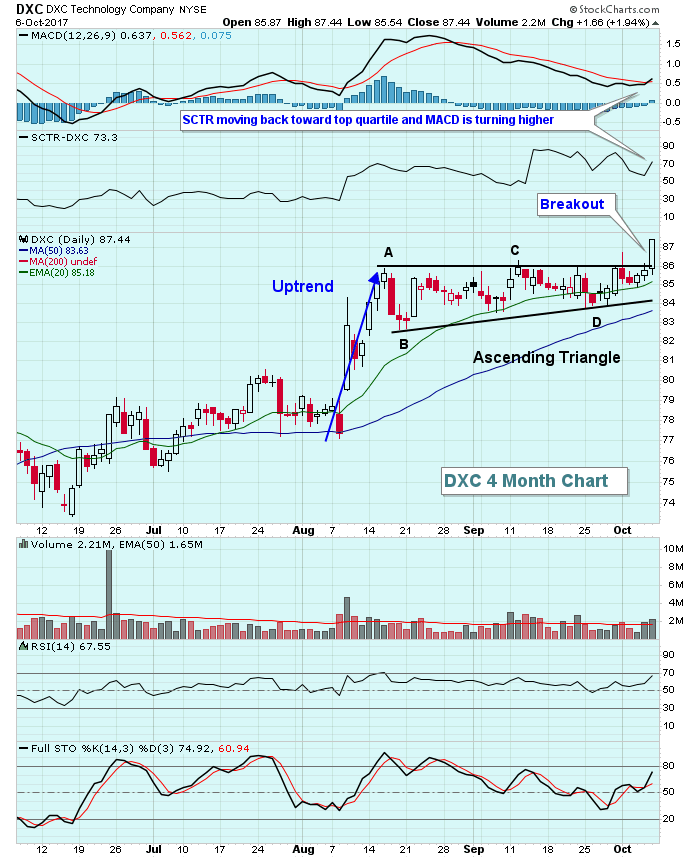
While we've seen many indices, ETFs and individual stocks break out over the past several weeks, there are still many that are consolidating in bullish fashion and those, upon breakout, provide solid trading opportunities. Enter DXC Technology Company (DXC)... Read More
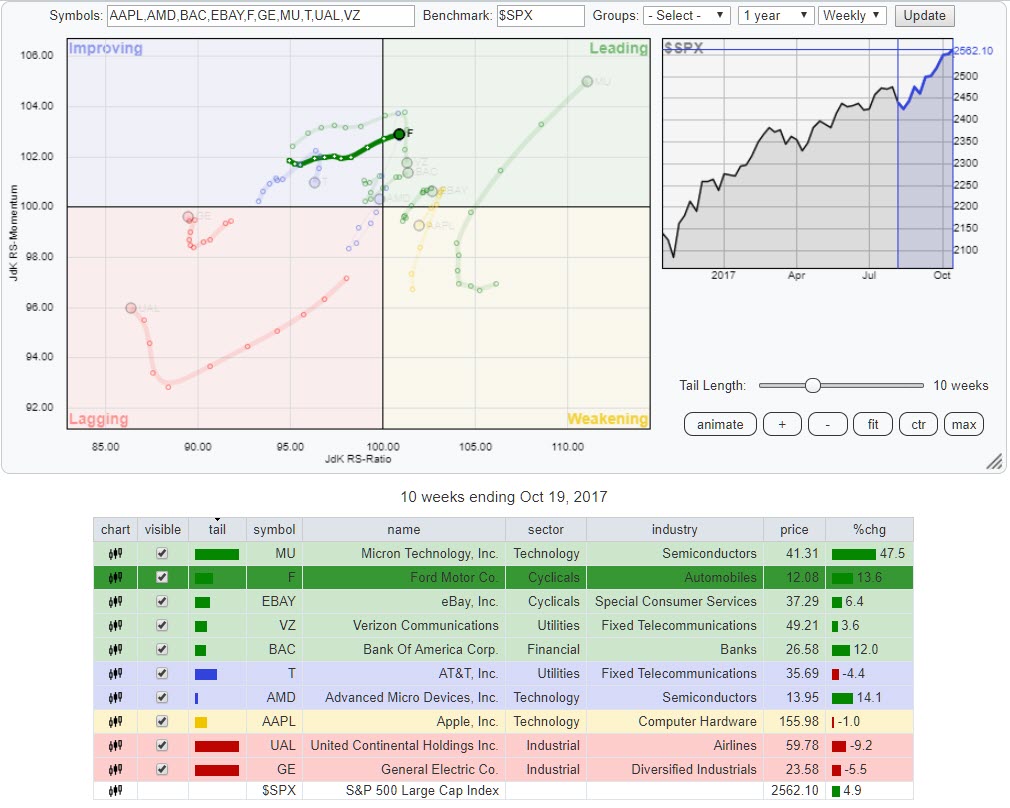
Don't Ignore This Chart! October 07, 2017 at 12:14 PM
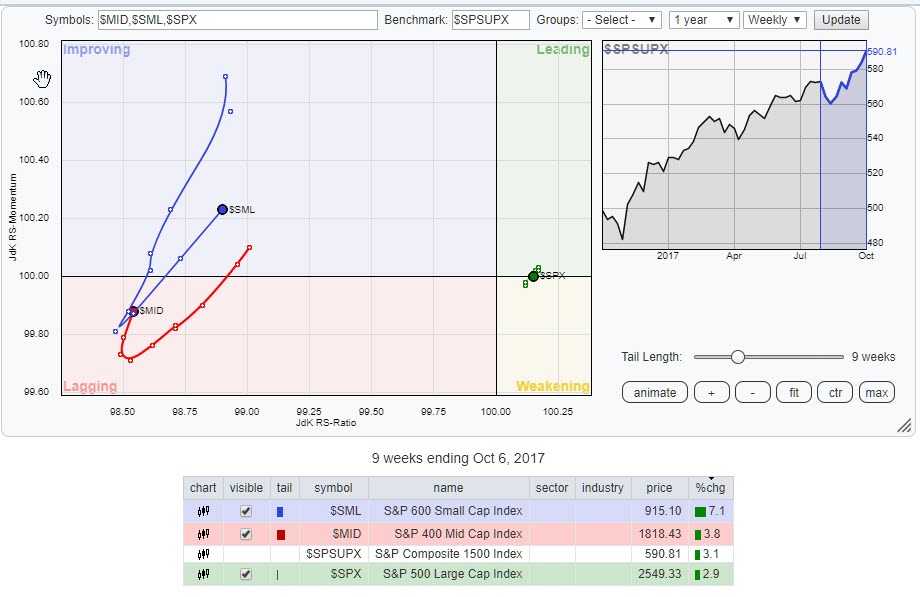
The Relative Rotation Graph above shows the rotation of the three size indices that make up the S&P Composite 1500 index... Read More
Don't Ignore This Chart! October 05, 2017 at 11:17 AM
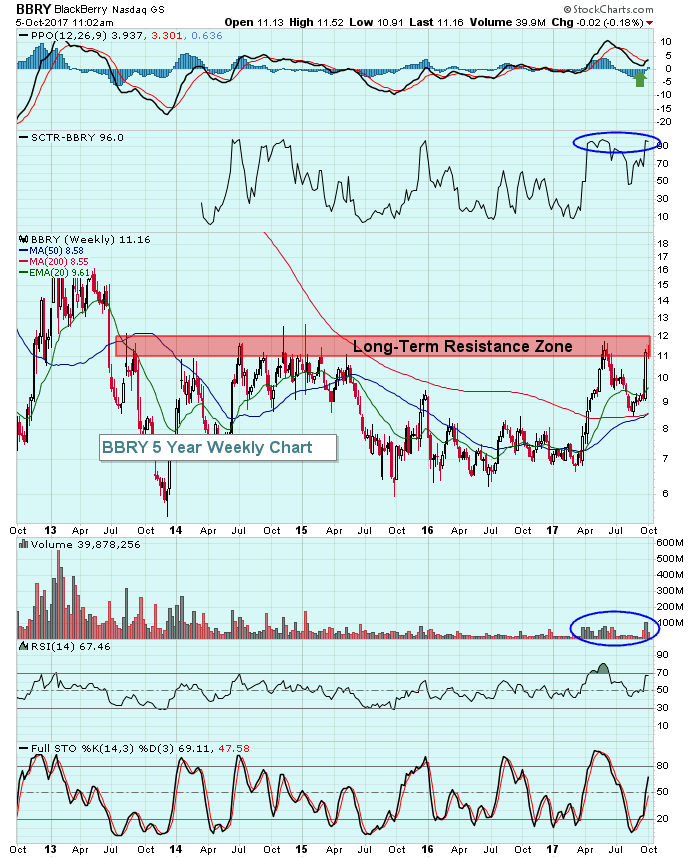
Blackberry's (BBRY) demise from 2008 through 2012 has been well documented and I'm not really interested in dwelling in that past. More recently, however, BBRY has attempted on multiple occasions to clear price resistance in the 11-12 range... Read More
Don't Ignore This Chart! October 04, 2017 at 12:33 PM
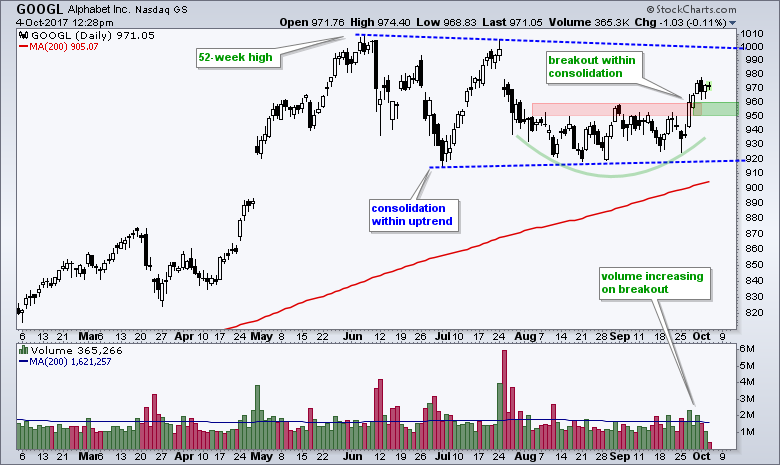
Alphabet, which some of you may know as Google, surged off a support zone with good volume and broke short-term resistance. This breakout could evolve into more because the big picture is also bullish... Read More
Don't Ignore This Chart! October 03, 2017 at 05:55 PM
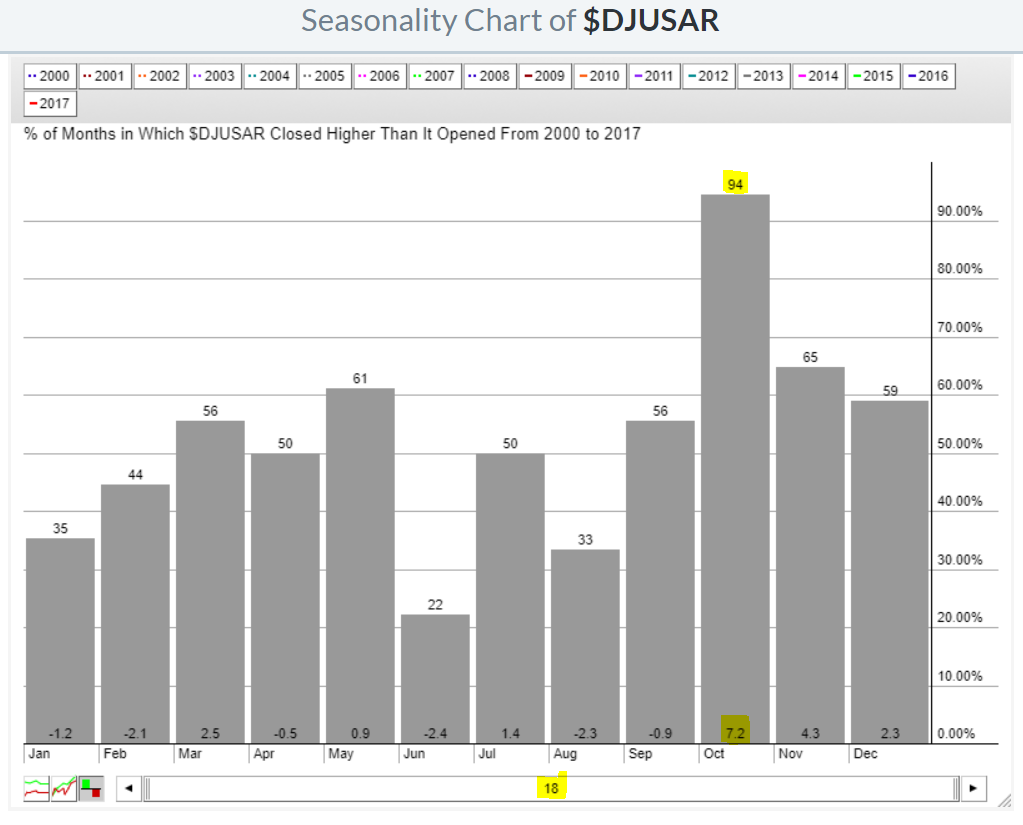
Airlines ($DJUSAR) absolutely "took off" in today's action as buyers emerged to drive nearly every airline higher. Spirit Airlines (SAVE) surged 7.10%. JetBlue Airways (JBLU) popped 7.08%. Delta Air Lines (DAL) jumped 6.62%... Read More
Don't Ignore This Chart! October 02, 2017 at 11:38 AM
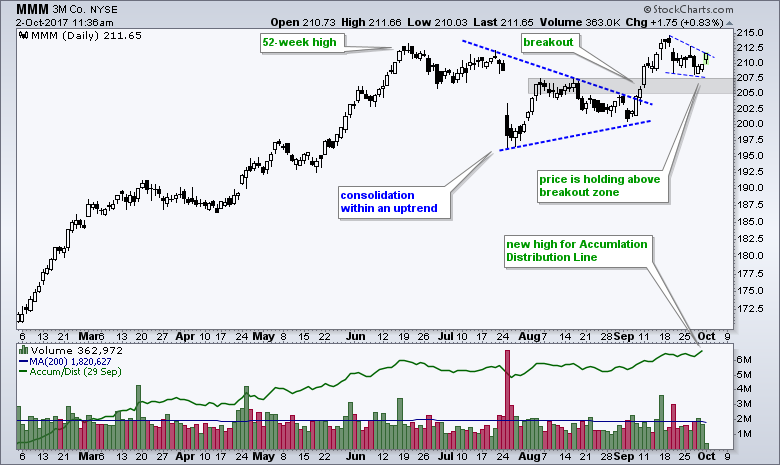
3M (MMM) is helping itself and the Dow Industrials with a breakout in mid September. As a price-weighted average, the stocks with the highest price carry the most weight and MMM, which is the third highest-priced stock, accounts for around 6.5% of the Dow... Read More