Don't Ignore This Chart! February 28, 2019 at 05:35 AM
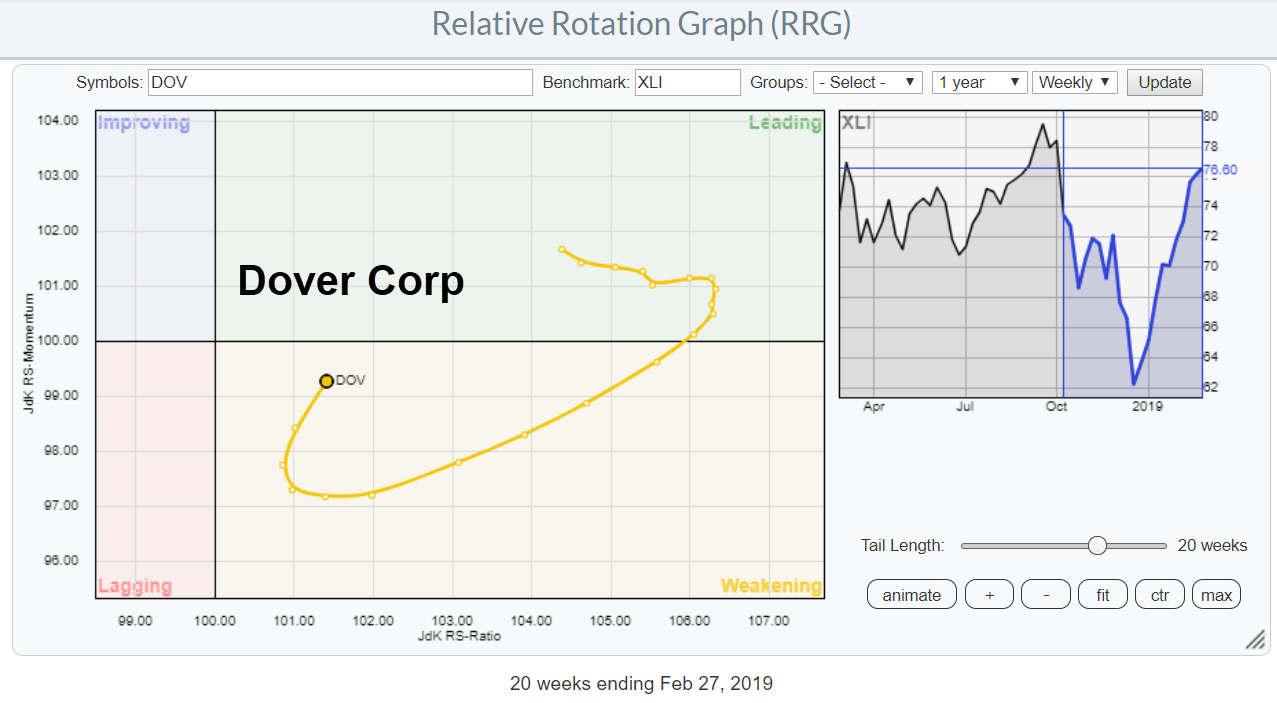
On the weekly Relative Rotation Graph for US sectors, XLI, the Industrials sector is crossing over into the leading quadrant from improving. This indicates further improvement for Industrial stocks compared to other segments of the market... Read More
Don't Ignore This Chart! February 27, 2019 at 06:45 AM
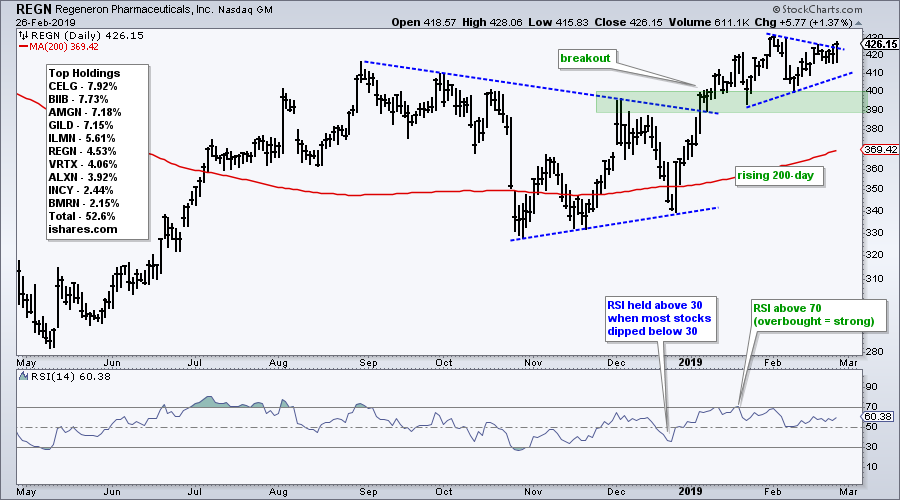
It is a mixed bag for the big biotech stocks this year. Of the top ten stocks in IBB, five are underperforming SPY and five are outperforming. Regeneron is slightly outperforming SPY this year and sports a bullish pattern on the price chart... Read More
Don't Ignore This Chart! February 26, 2019 at 10:36 PM
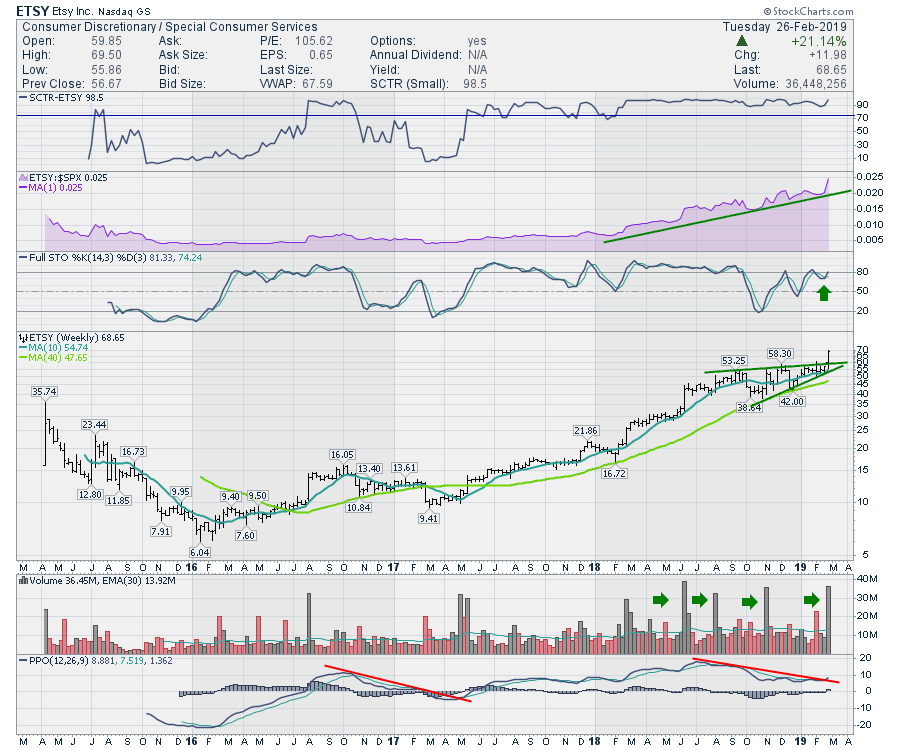
Every day, we continue to see big name stocks join the new 52-week highs. This week, a great chart of ETSY kept finding new buyers at higher prices. The stock has been a top performer since May of 2017... Read More
Don't Ignore This Chart! February 25, 2019 at 12:04 PM
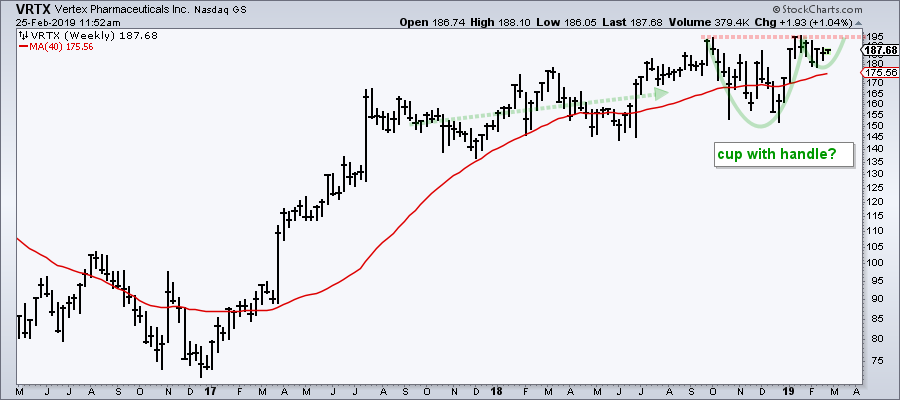
The daily chart for Vertex (VRTX) is quite a mess with several dips under the 200-day SMA over the last ten months, but a short-term bullish pattern is shaping up and the weekly chart also sports a bullish setup... Read More
Don't Ignore This Chart! February 24, 2019 at 11:16 AM
There is a small business in Canada called Vitality Air, which compresses air from Banff National Park and sells it around the world for people to breathe and smell... Read More
Don't Ignore This Chart! February 21, 2019 at 04:38 AM
My last article in the RRG blog looks at sector rotation for US sectors and how there are some disconnects between groups of sectors on both the daily and the weekly time frames... Read More
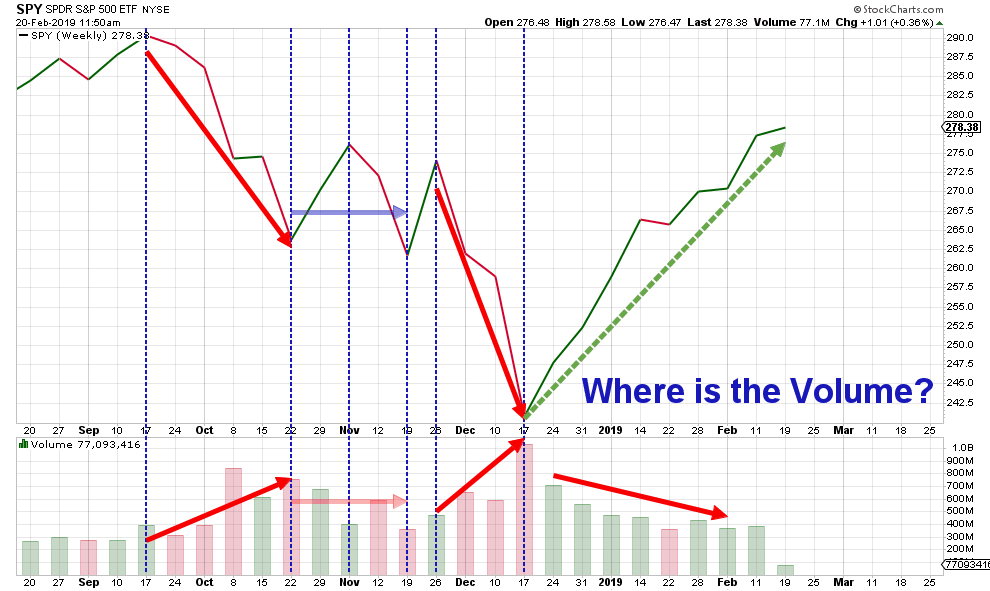
Don't Ignore This Chart! February 20, 2019 at 07:10 AM
When sitting down to a chart, or even standing, establishing the direction of the bigger trend is the first task. The direction of this trend establishes my trading bias and tells me where to focus... Read More
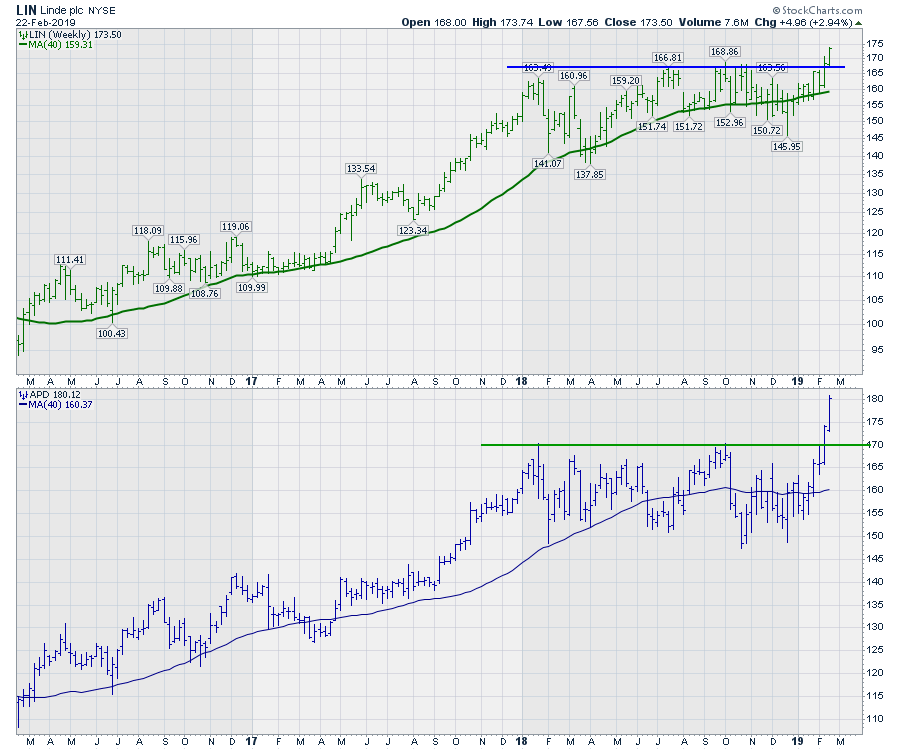
Don't Ignore This Chart! February 19, 2019 at 11:47 PM
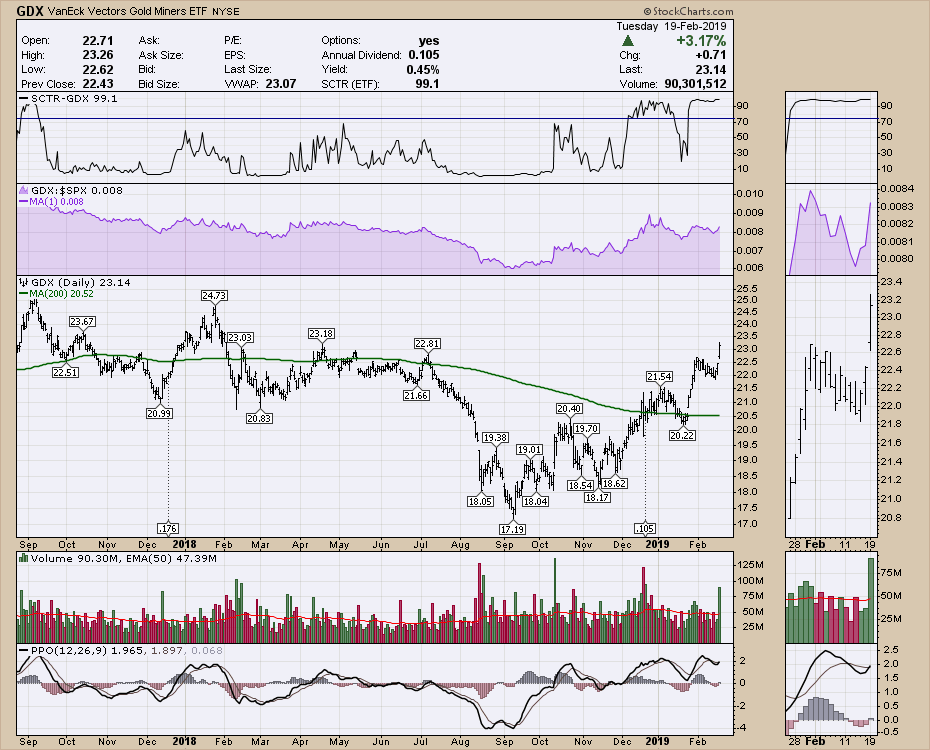
Gold and gold minings stocks surged to start the trading week. What makes this so important is this is the first 52-week high in the gold mining stocks since the 2016 spring surge. Pay attention to the industry group as well as the industrial metals... Read More
Don't Ignore This Chart! February 15, 2019 at 12:38 PM
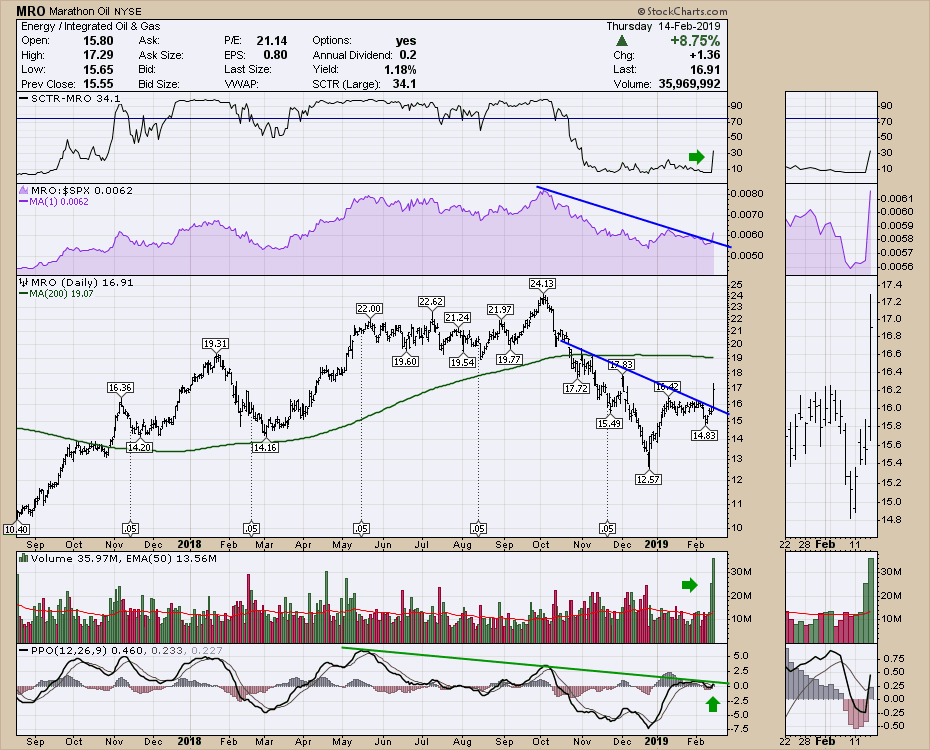
Marathon Oil (MRO) has had two marathon buying days with massive volume. While Day One didn't see any price movement on large volume, Day Two sure did. The price has just moved out of a short 2-month base and looks set to accelerate from there... Read More
Don't Ignore This Chart! February 14, 2019 at 10:03 AM
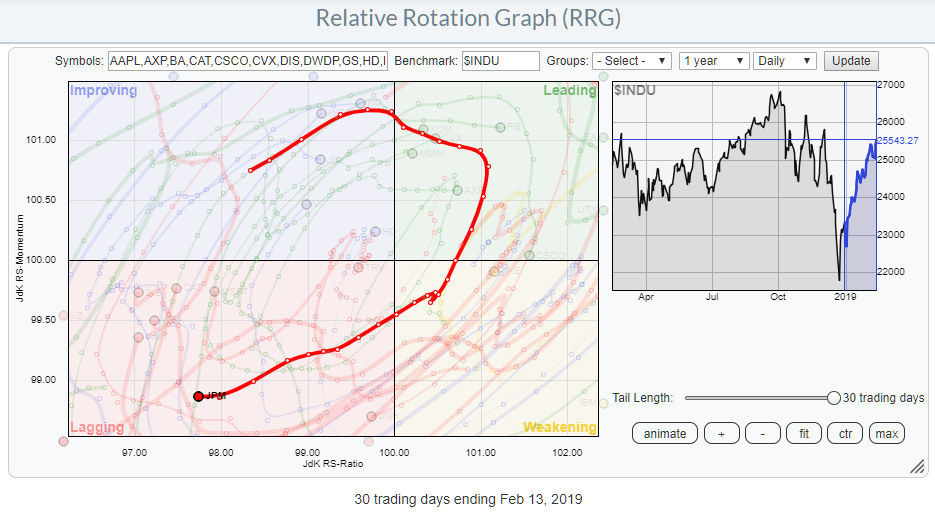
One of the choices in the drop-down selection on the Relative Rotation Graphs page is the DJ-industrials (Dow 30 Industrials). This RRG shows the rotation of all 30 Dow stocks against the $INDU... Read More
Don't Ignore This Chart! February 13, 2019 at 02:06 PM
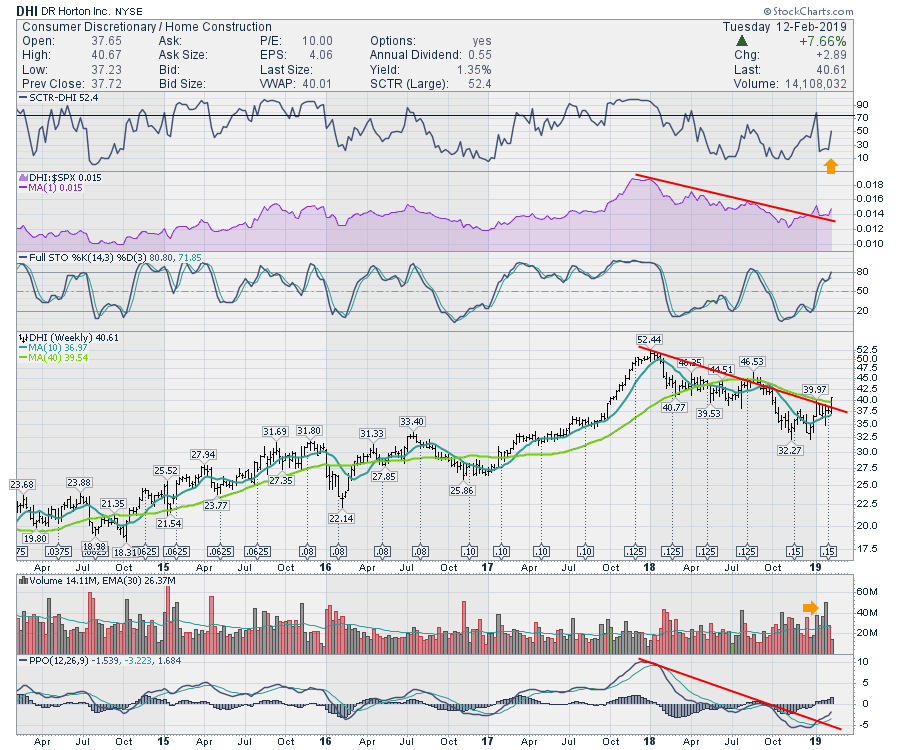
D.R. Horton (DHI) has been in a year-long down trend. Yesterday, on the back of a broad move by the indexes higher, DHI broke above a long downtrend line... Read More
Don't Ignore This Chart! February 13, 2019 at 07:01 AM
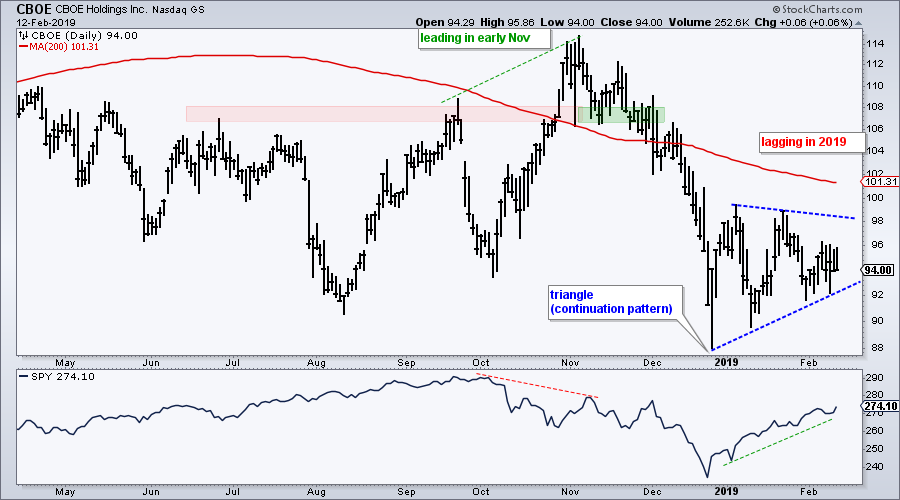
We are 29 trading days into 2019 and the S&P 500 is up a very respectable 9.49%. Furthermore, some 465 stocks in the S&P 500 are up year-to-date, which means 35 are down year-to-date. CBOE Holdings (CBOE) is one of these stocks (-3... Read More
Don't Ignore This Chart! February 11, 2019 at 07:13 AM
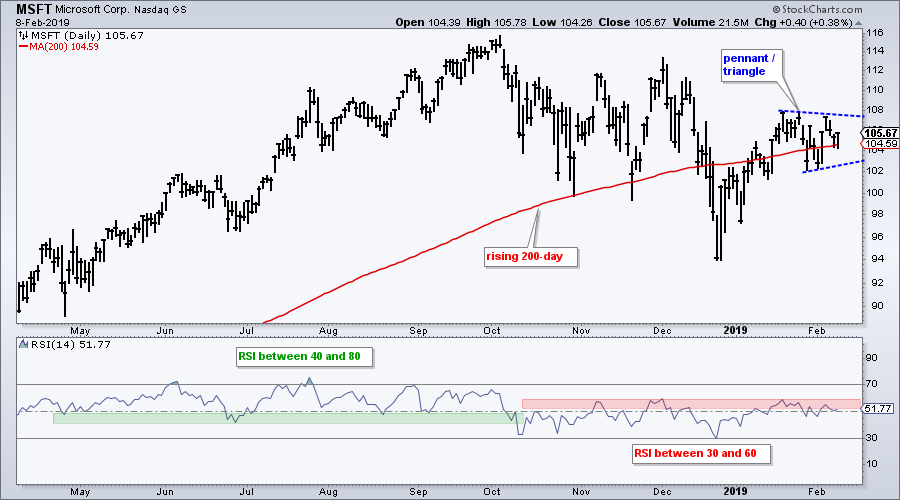
Microsoft is battling the rising 200-day moving average and making a bid to shift momentum back to the bulls. The chart shows MSFT falling along with the market from October to December and then rebounding sharply in January... Read More
Don't Ignore This Chart! February 10, 2019 at 01:16 PM
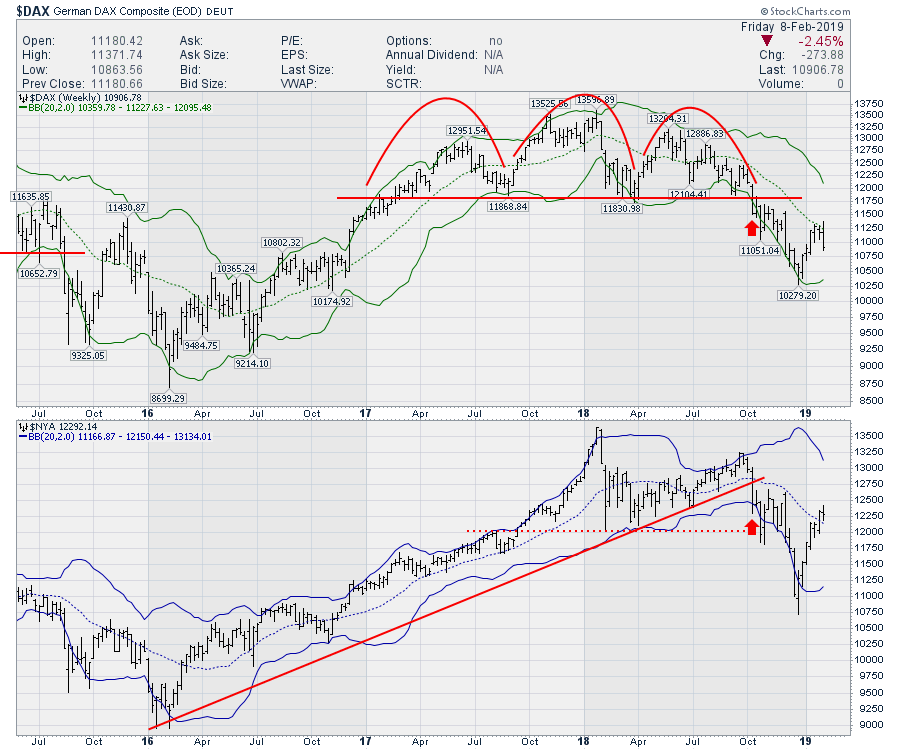
This rally has been great, lifting portfolios around the world. With lots of optimism helping the market here, there are some worldwide charts that I reviewed on the Weekly Market Roundup show. There is a link to the video further down in this article... Read More
Don't Ignore This Chart! February 07, 2019 at 08:47 AM
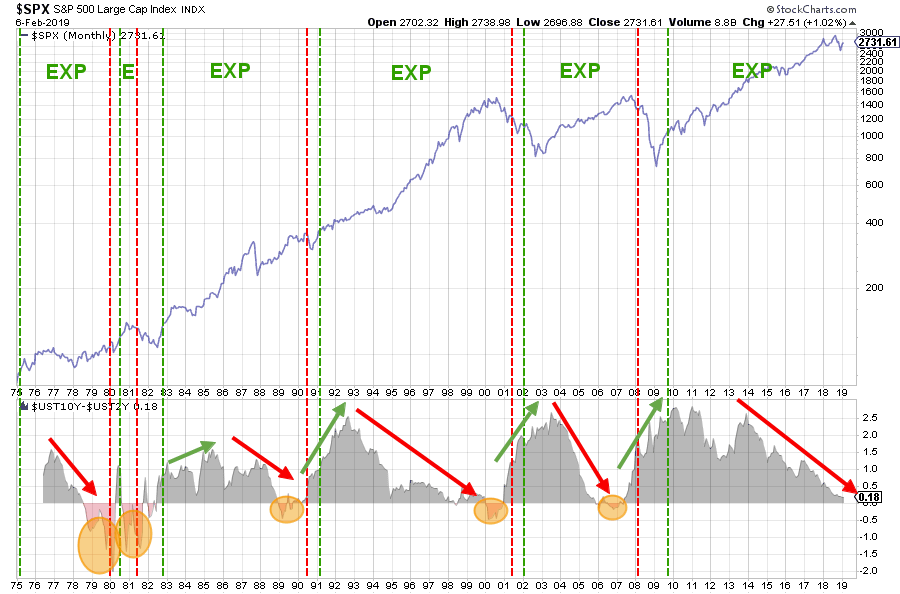
The chart that I want to share with you today is part of a (bigger) research project that I am doing with regard to the various phases in economic cycles and their relation to the (shape of) yield curve. The chart above shows the S&P Index in the main panel... Read More
Don't Ignore This Chart! February 06, 2019 at 05:25 AM
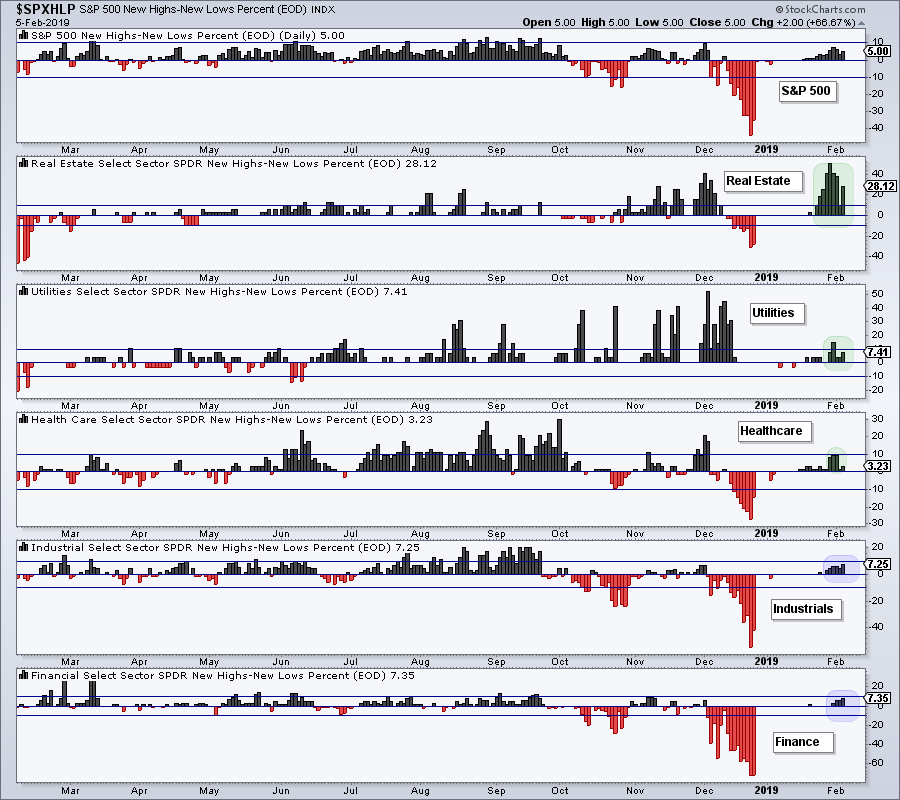
Chartists looking for the sectors with the most stocks in strong uptrends can turn to the High-Low Percent indicators. High-Low Percent equals new 52-week highs less new 52-week lows divided by total issues... Read More
Don't Ignore This Chart! February 05, 2019 at 11:34 PM
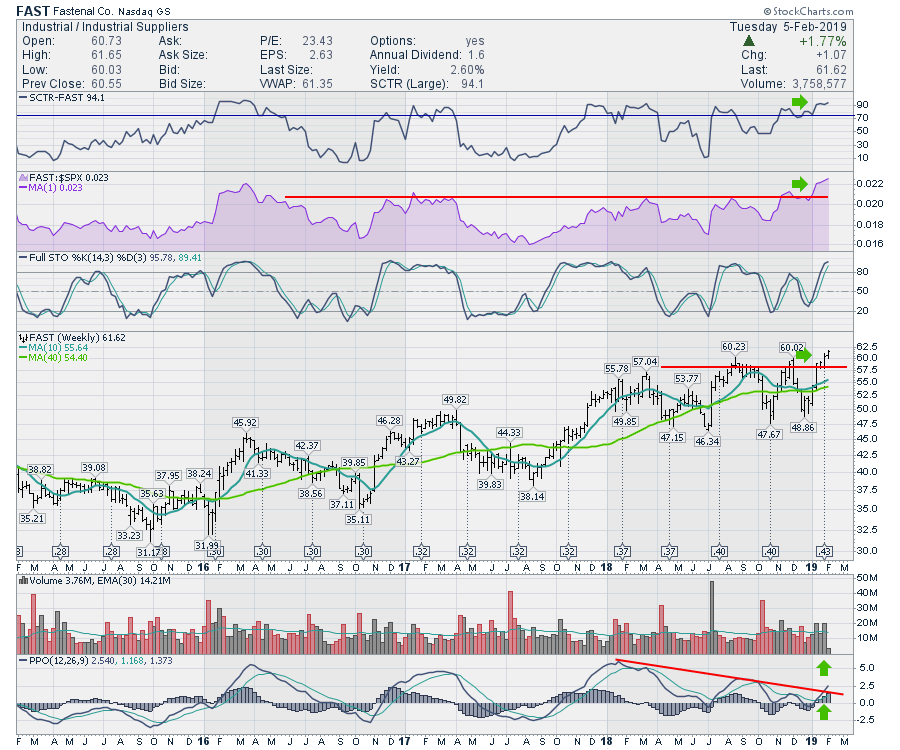
Recently, Fastenal has been building a bias to the upside. Its December low, notably, was higher than its previous low in October, which itself had improved upon the prior June low... Read More
Don't Ignore This Chart! February 04, 2019 at 10:11 AM

The overall trend for Amazon shifted from bullish to bearish in October and RSI caught this shift. Before looking at RSI, let's review price action and the bigger trend at work... Read More
Don't Ignore This Chart! February 01, 2019 at 09:30 AM
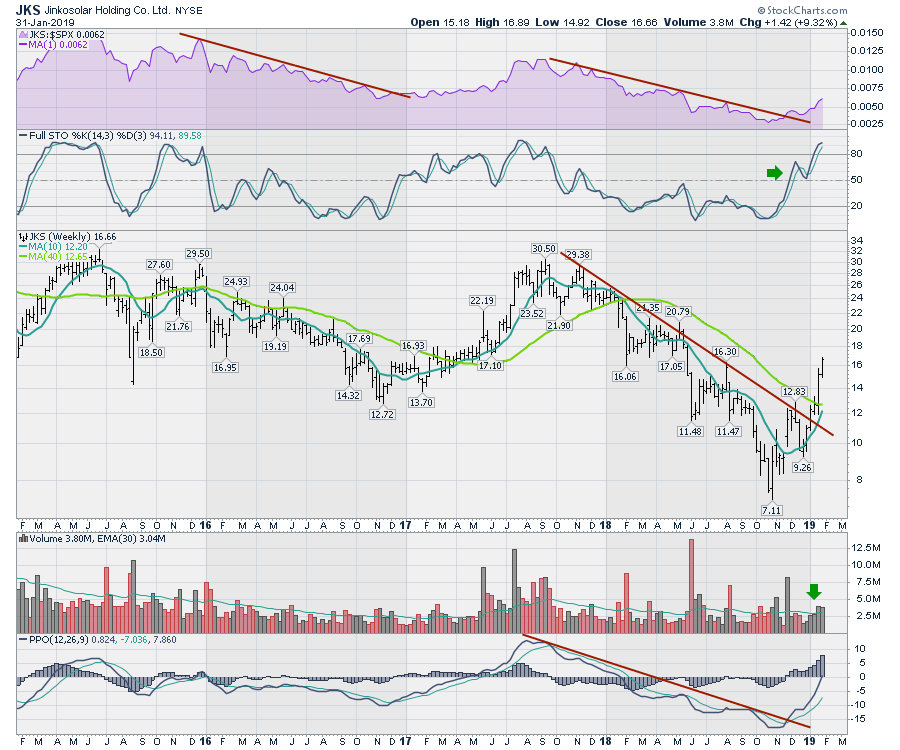
Jinkosolar has been on a big roller coaster loop for the last two years. In recent weeks, the stock has started to break out; this week, the move has been 9% in the first four days... Read More