Don't Ignore This Chart! October 31, 2019 at 03:07 PM
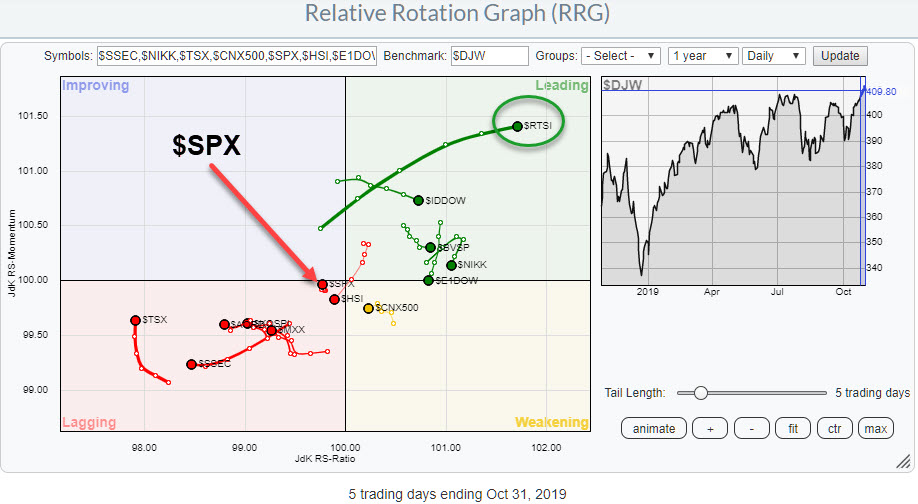
Despite the S&P 500 making new highs and looking strong on the charts, it is definitely not the strongest market in the world at the moment... The RRG above shows the daily rotation for a universe of major stock market indexes around the world... Read More
Don't Ignore This Chart! October 29, 2019 at 07:17 PM
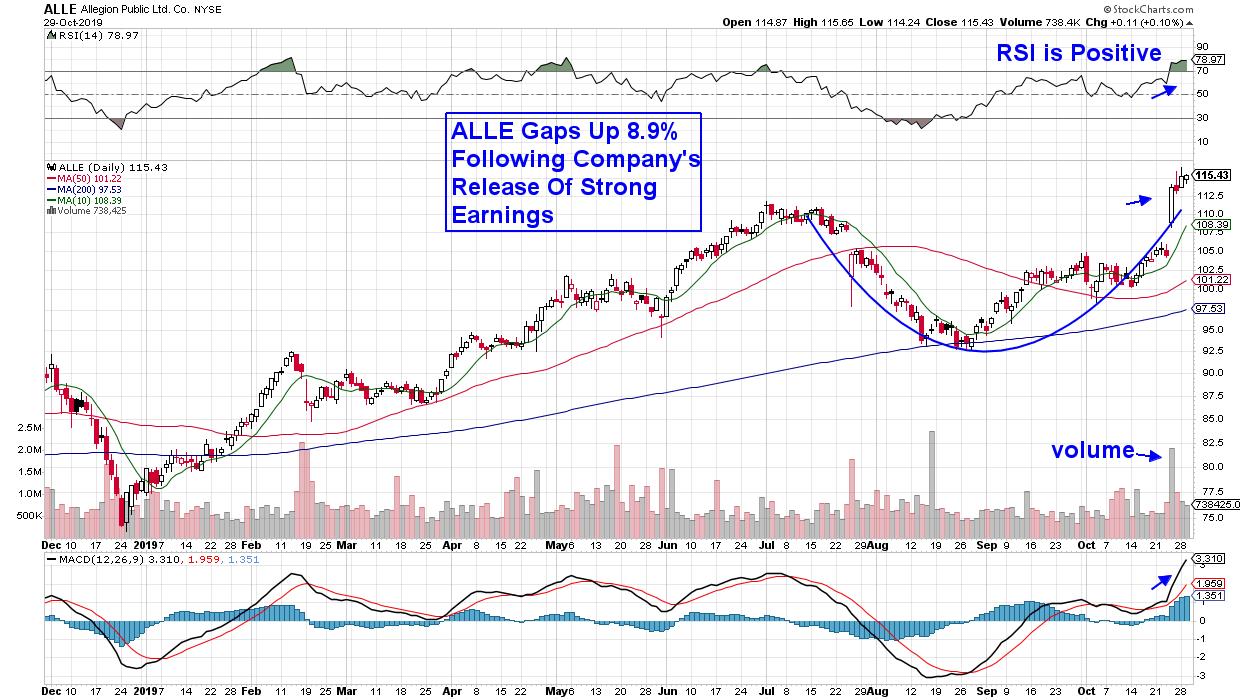
It's been quite an earnings season so far with over 80% of companies that have reported, coming in ahead of analyst's estimates. Even more impressive has been investor's response to these upside surprises with a large number of stocks gapping up in price. Today alone, over 50 U... Read More
Don't Ignore This Chart! October 29, 2019 at 06:03 PM
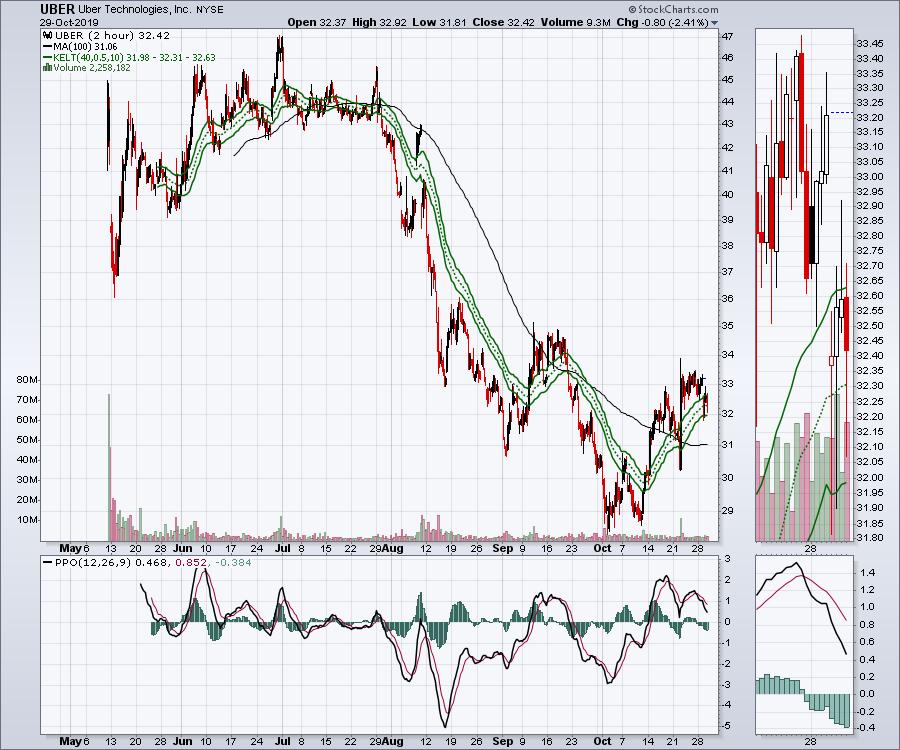
With the market broadly pushing to new highs worldwide, the talking TV heads are onto the "what's-working-lately" narrative... Read More
Don't Ignore This Chart! October 25, 2019 at 01:25 PM
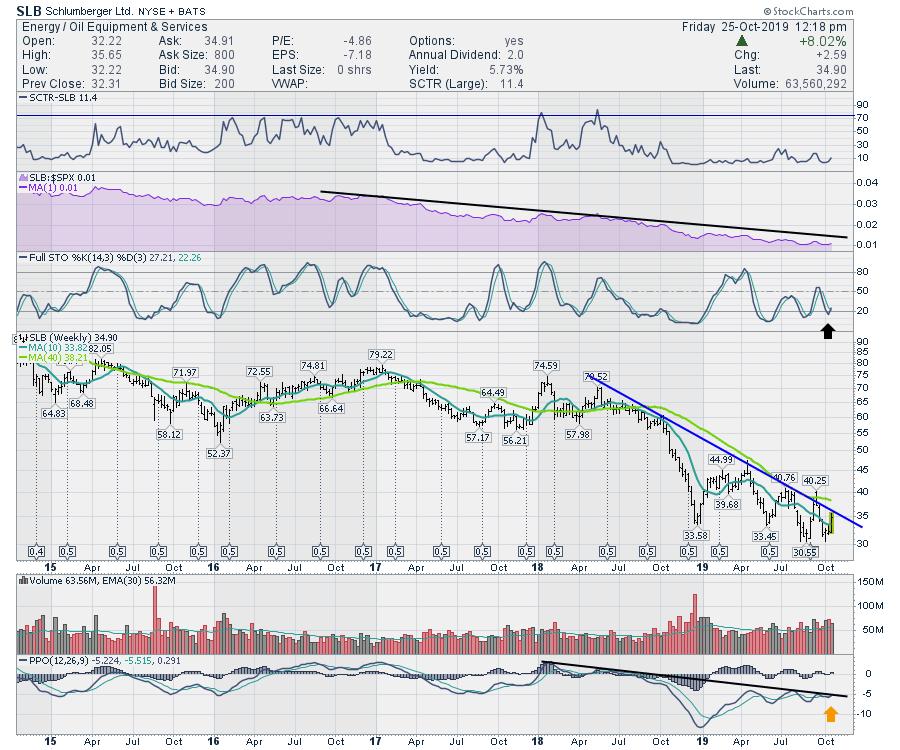
Schlumberger (SLB) has been down and out for a long time. The management team wrote down $12.7B in goodwill and other charges this month. For technicians, the actual science of that write-off is not as important as what investors think of the write-off... Read More
Don't Ignore This Chart! October 24, 2019 at 04:51 AM
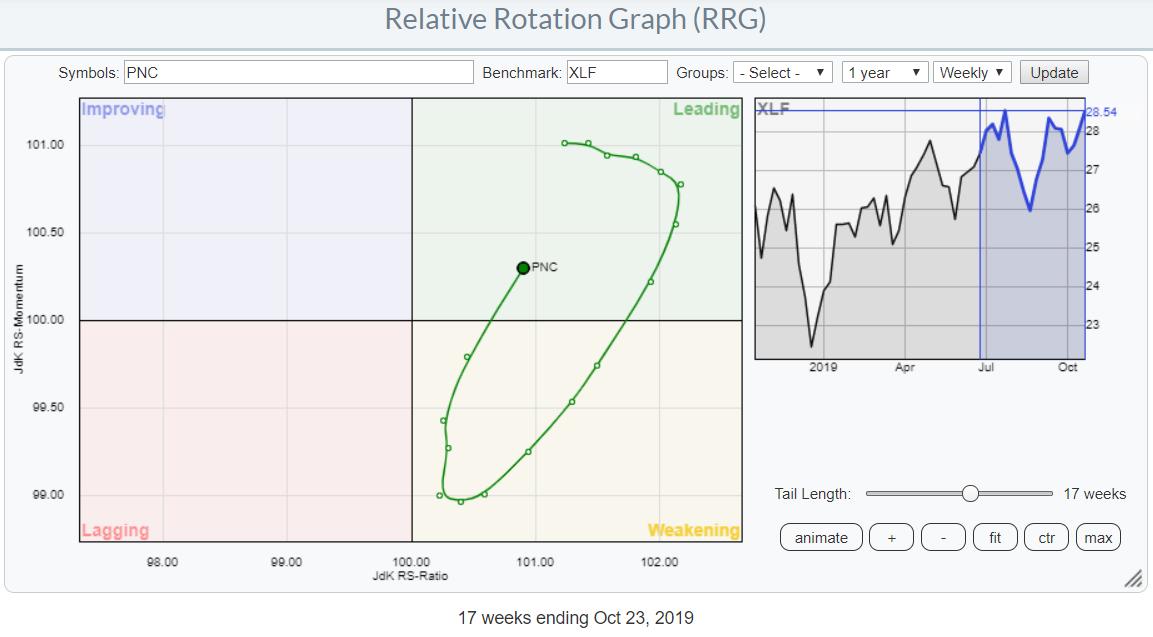
The Financial sector (XLF) continues to pick up relative strength. On the weekly RRG, XLF just moved into the improving quadrant and is positioned very close to the center of the chart. On the daily RRG, a very nice and strong rotation can be seen over the last three weeks... Read More
Don't Ignore This Chart! October 23, 2019 at 03:04 PM
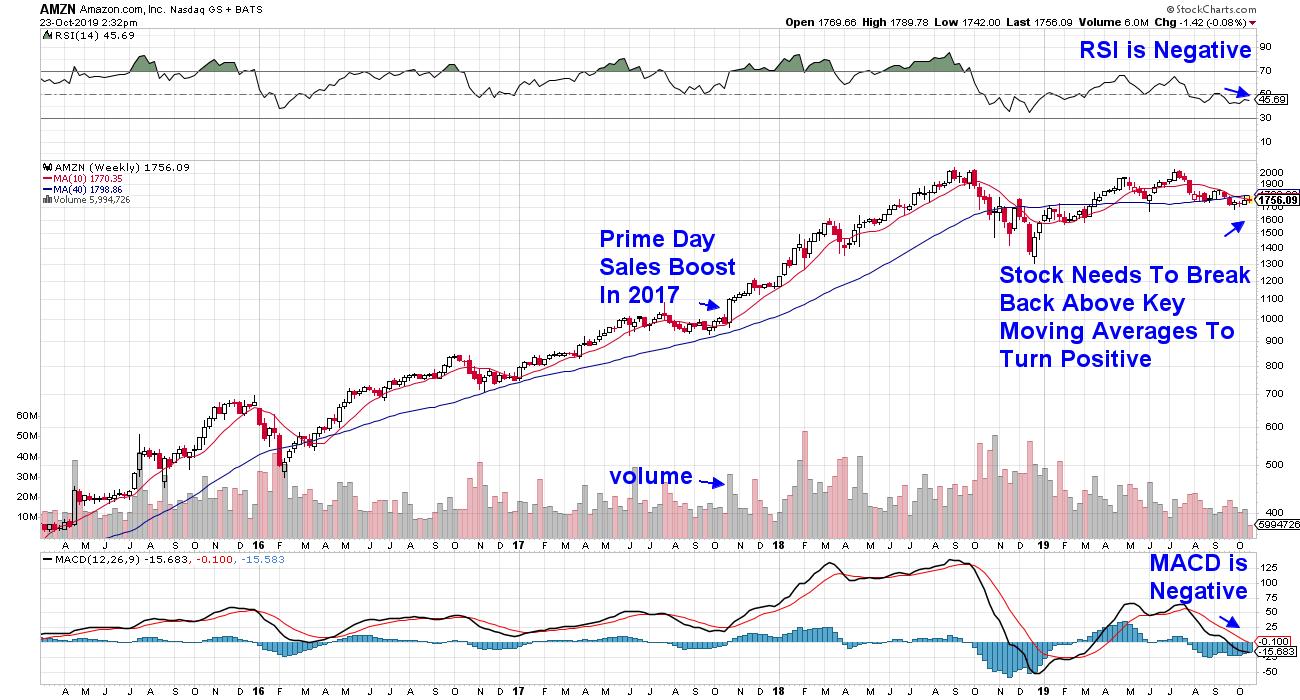
Amazon.com Inc. (AMZN) has been struggling of late following a 12.5% drop from its peak in price during early July. As you can see in the chart below, the stock has been trading below its key 50-day moving average for the past 3 months... Read More
Don't Ignore This Chart! October 22, 2019 at 03:42 PM
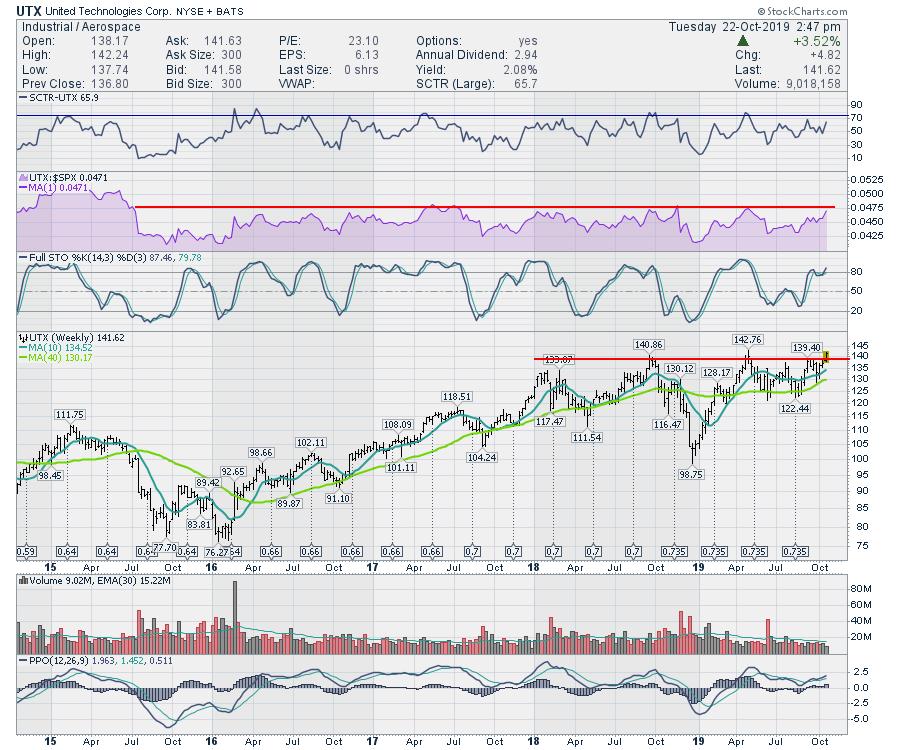
As the major indexes continue to test the highs, we are watching to see if breadth widens out. Financials are moving up this week following JPM's earnings last week... Read More
Don't Ignore This Chart! October 17, 2019 at 11:47 PM
Earnings season began this week with over 95 companies reporting their most recent earnings reports. By all accounts, it's been quite a positive season so far, with most companies coming in ahead of estimates and the markets responding warmly... Read More
Don't Ignore This Chart! October 17, 2019 at 10:13 AM
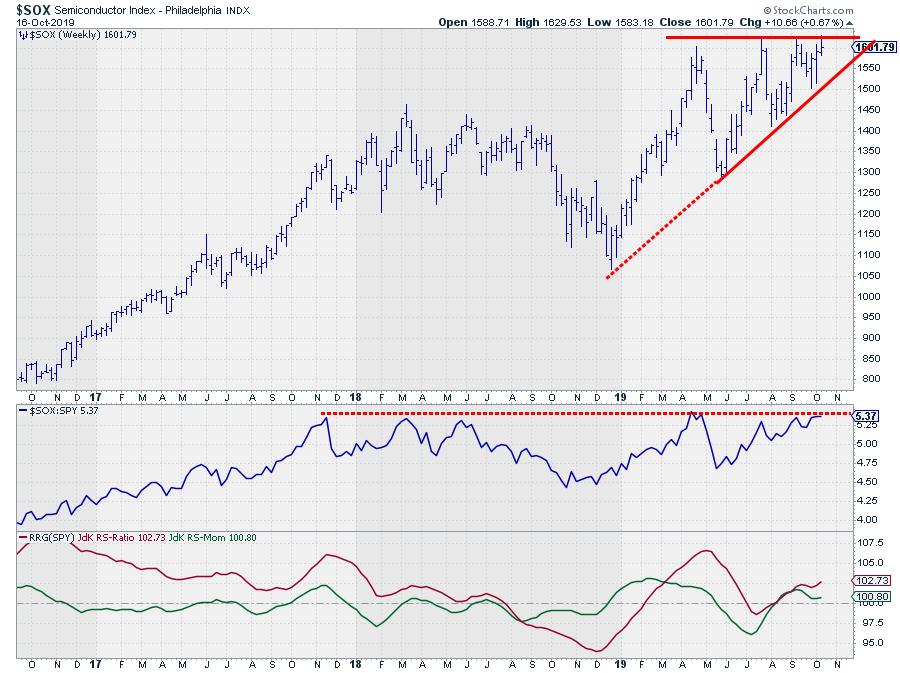
In the past week or so, I've seen a few headlines flying by mentioning the semiconductor index ($SOX) and an alleged breakout. In response, I checked out the chart of $SOX, as printed above, in combination with relative strength versus SPY... Read More
Don't Ignore This Chart! October 15, 2019 at 05:15 PM
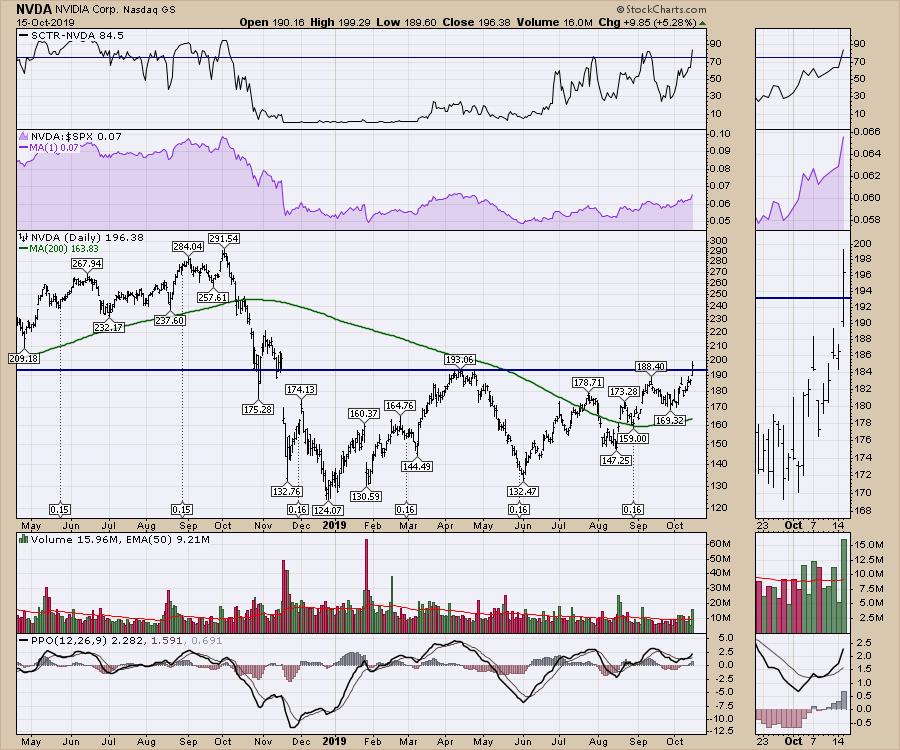
Semiconductors as a group have been performing well. I recently heard some analyst coverage suggesting that companies were ordering stockpiles of chips before the tariffs kicked in, which is driving up the "sales levels" before the tariff dates... Read More
Don't Ignore This Chart! October 13, 2019 at 09:03 PM
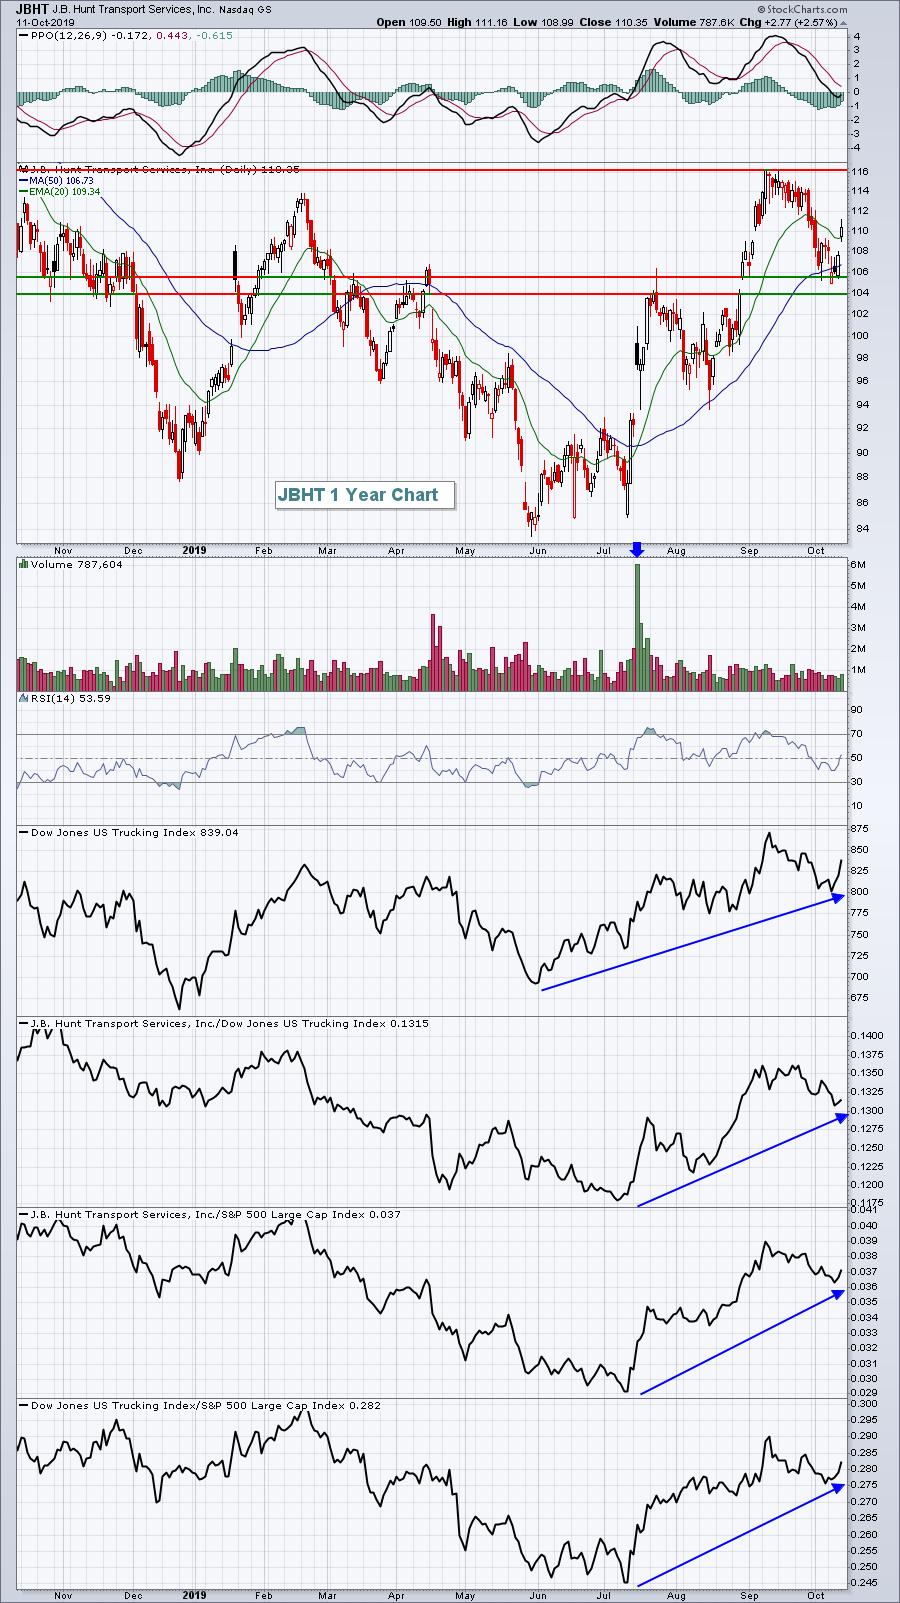
Every earnings season, there are a few key reports that I focus on. It could be that an industry group is beginning to show strength and a key component is reporting that could influence the direction of the group for the entire upcoming quarter... Read More
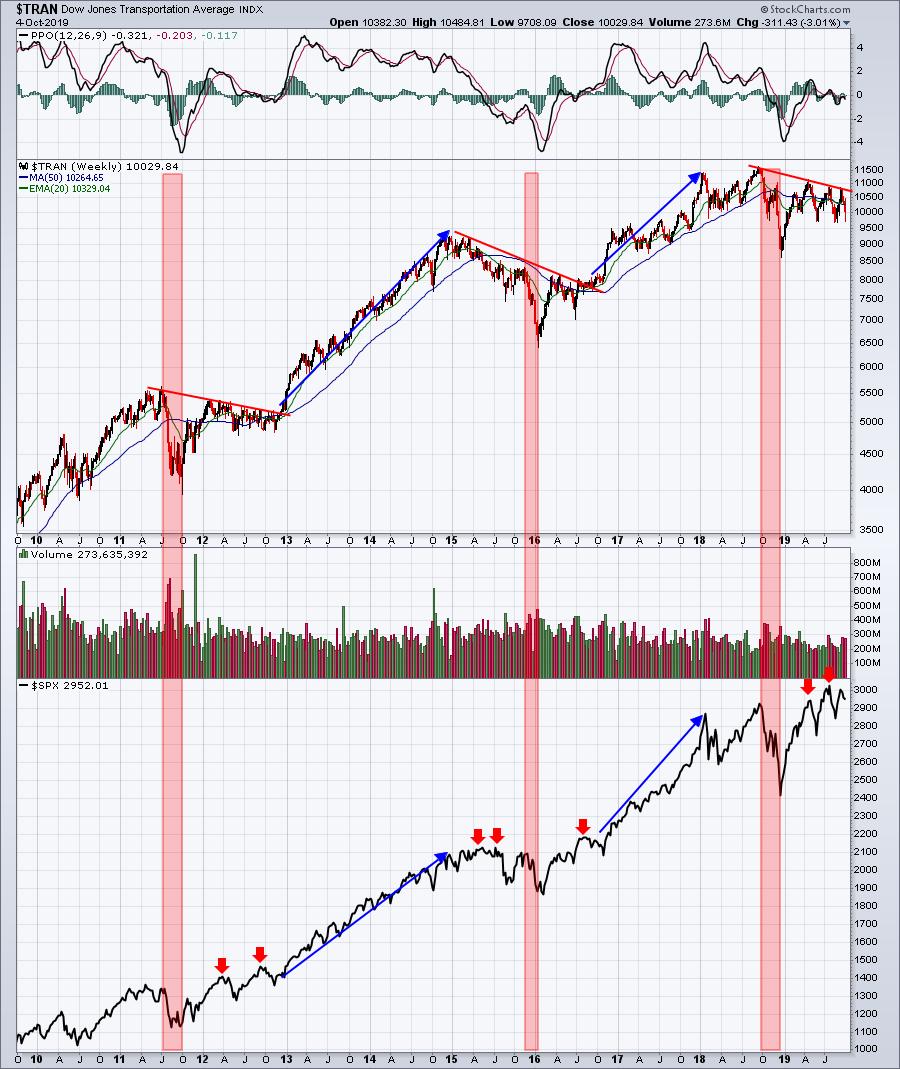
Don't Ignore This Chart! October 10, 2019 at 10:58 AM
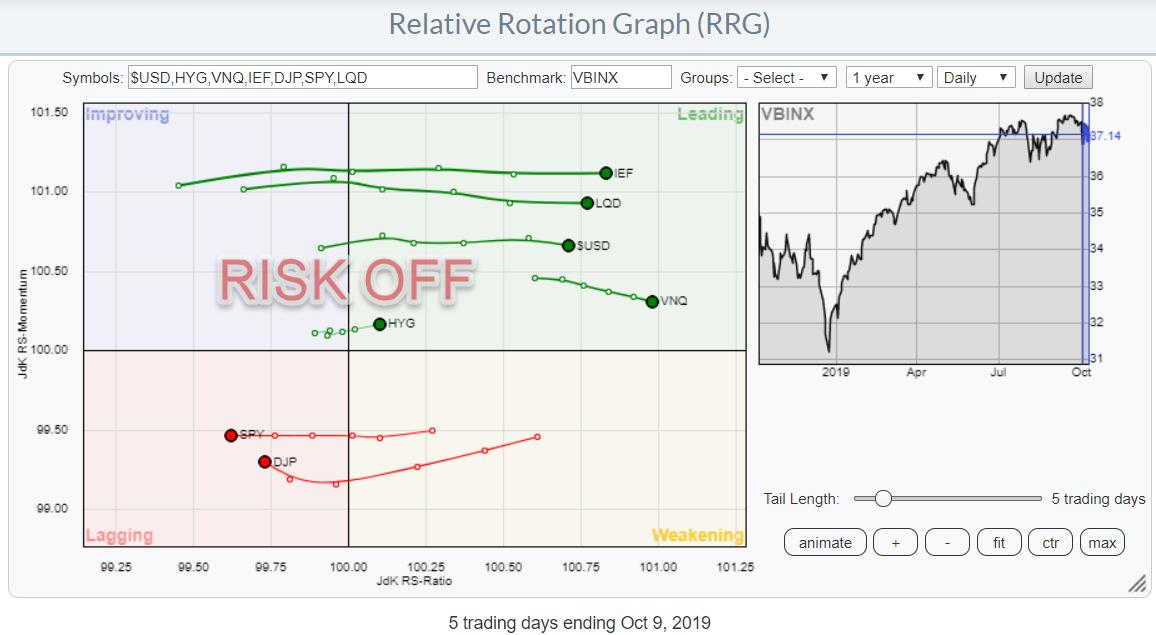
The monthly charts for major markets like the S&P 500 Index are still in clear uptrends - that has not changed. But, in shorter timeframes, things have started to shift with regard to preference for asset classes... Read More
Don't Ignore This Chart! October 08, 2019 at 06:14 PM
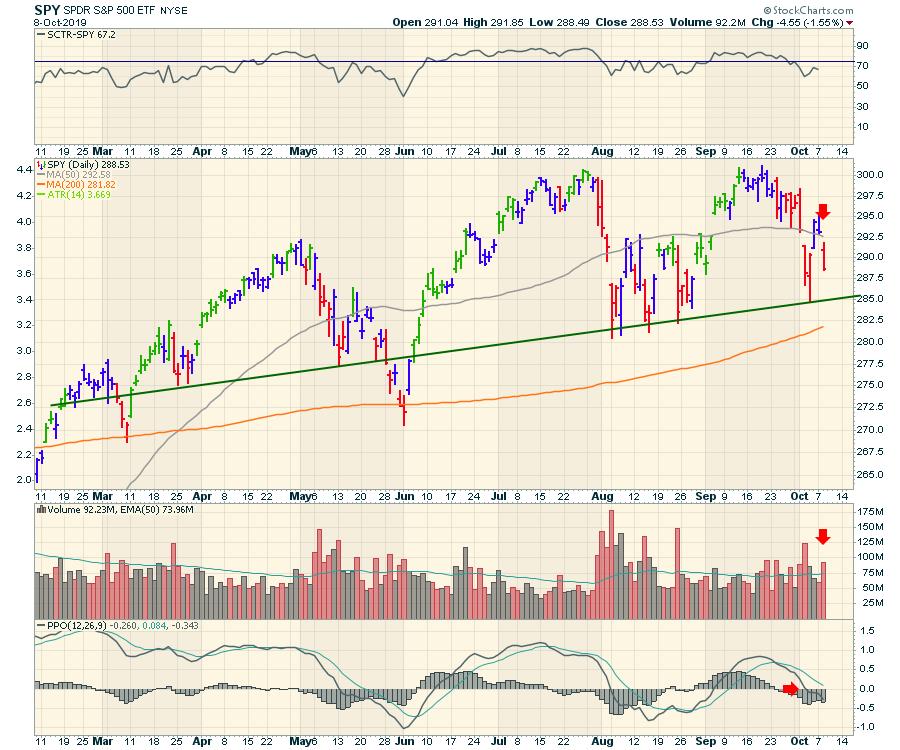
The SPY ETF is having another rough start in October. We all know what happened last year, and it seems improbable to expect the same market behavior two years in a row. Having said all of that, the setup is similar and the ETF continues to cycle down in enthusiasm... Read More
Don't Ignore This Chart! October 06, 2019 at 08:51 AM
Ok, I'm being somewhat dramatic. I'm looking for several things. First of all, I'm quite bullish. It's hard to tell exactly how long this consolidation lasts, but I'm definitely nowhere near the camp that believes we're heading for a recession or bear market... Read More
Don't Ignore This Chart! October 06, 2019 at 07:19 AM
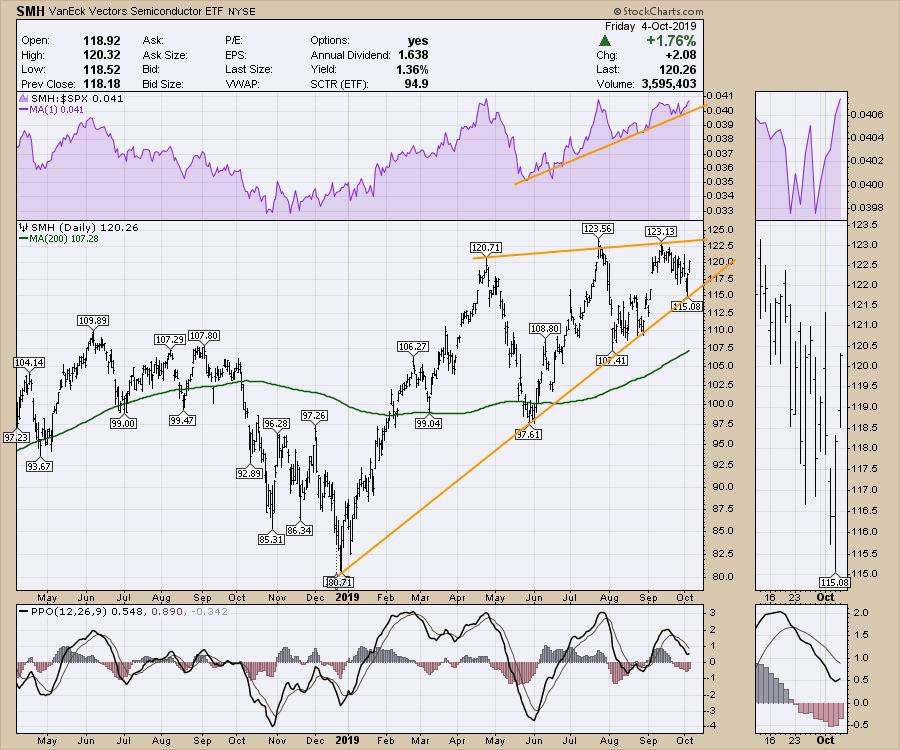
One area that showed strength this week is the Semiconductor space, which closed the week up 2% while the indexes were broadly down. There are so many positives on the chart! First of all, the relative strength (in purple) is close to hitting fresh new highs... Read More
Don't Ignore This Chart! October 03, 2019 at 12:43 PM
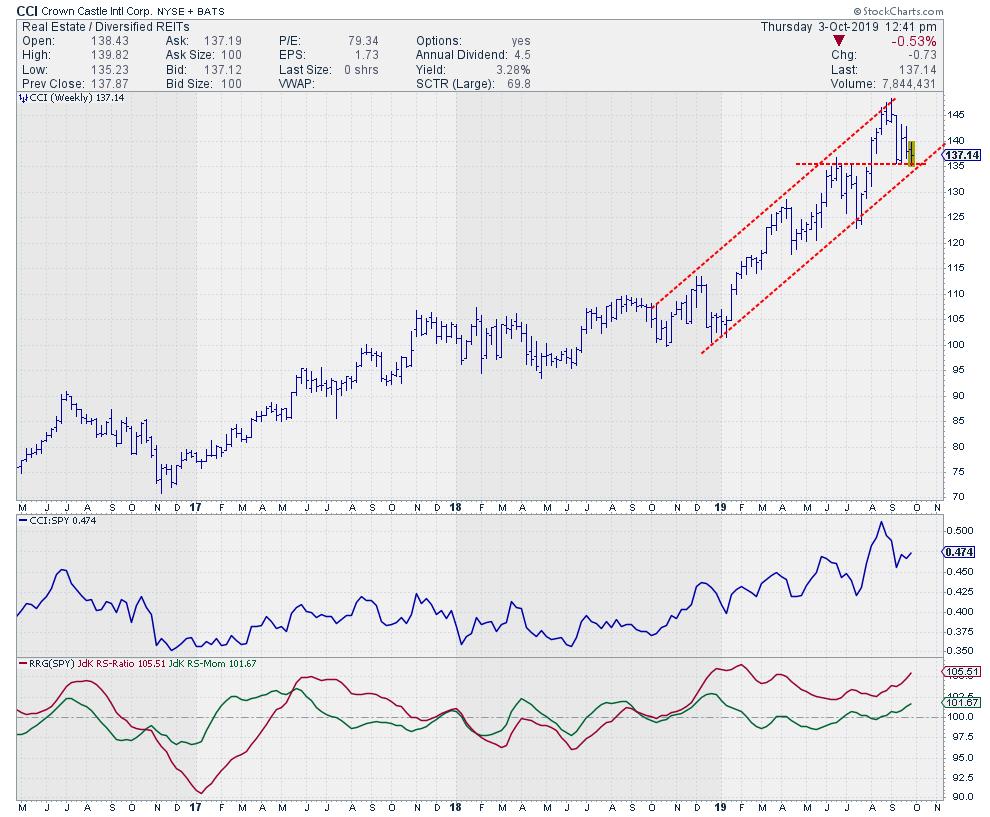
This week is characterized by sinking stocks, at least in the first half of the week, as well as a stabilizing market (so far) on this Thursday... Read More
Don't Ignore This Chart! October 01, 2019 at 07:37 PM
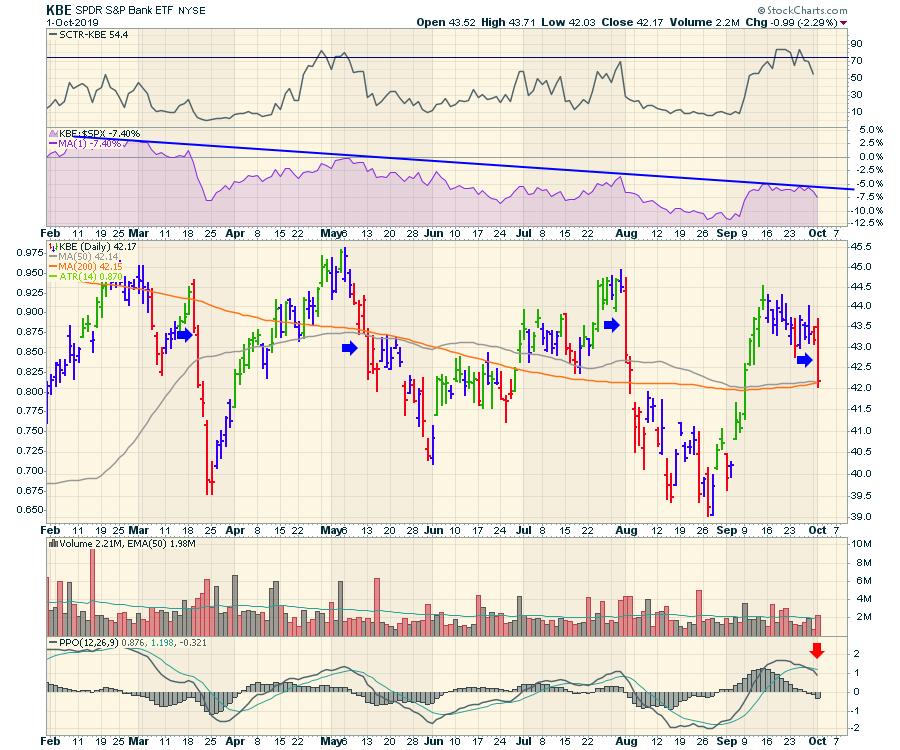
This market continues to pull investors both ways. After JPM broke out to fresh highs, it looked like everything was moving along nicely. The price bar on today's KBE chart looks remarkably similar to the price bars showing up in the last three rollovers... Read More
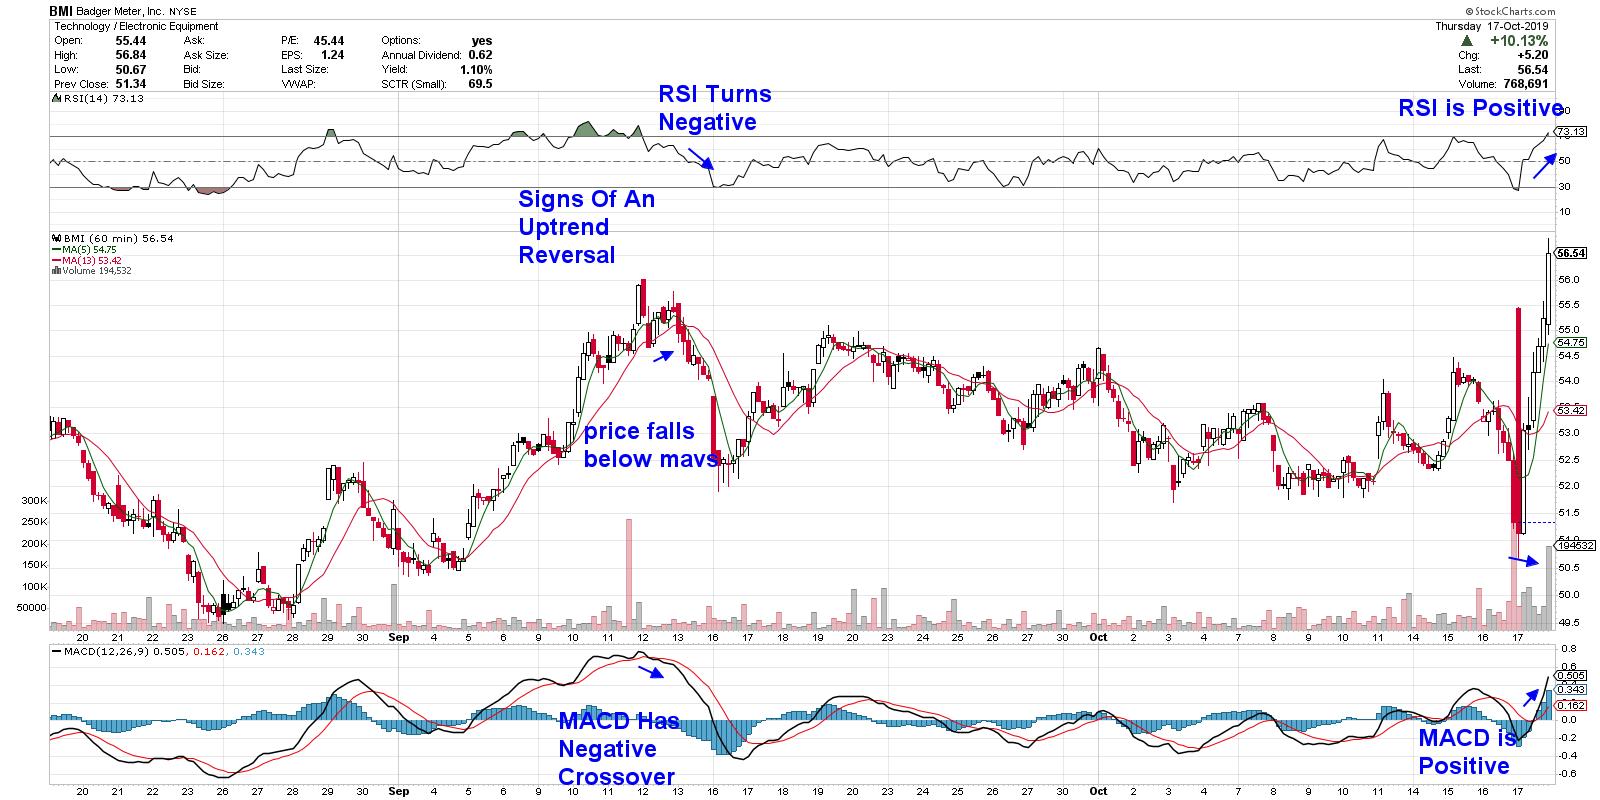
Don't Ignore This Chart! October 01, 2019 at 09:03 AM
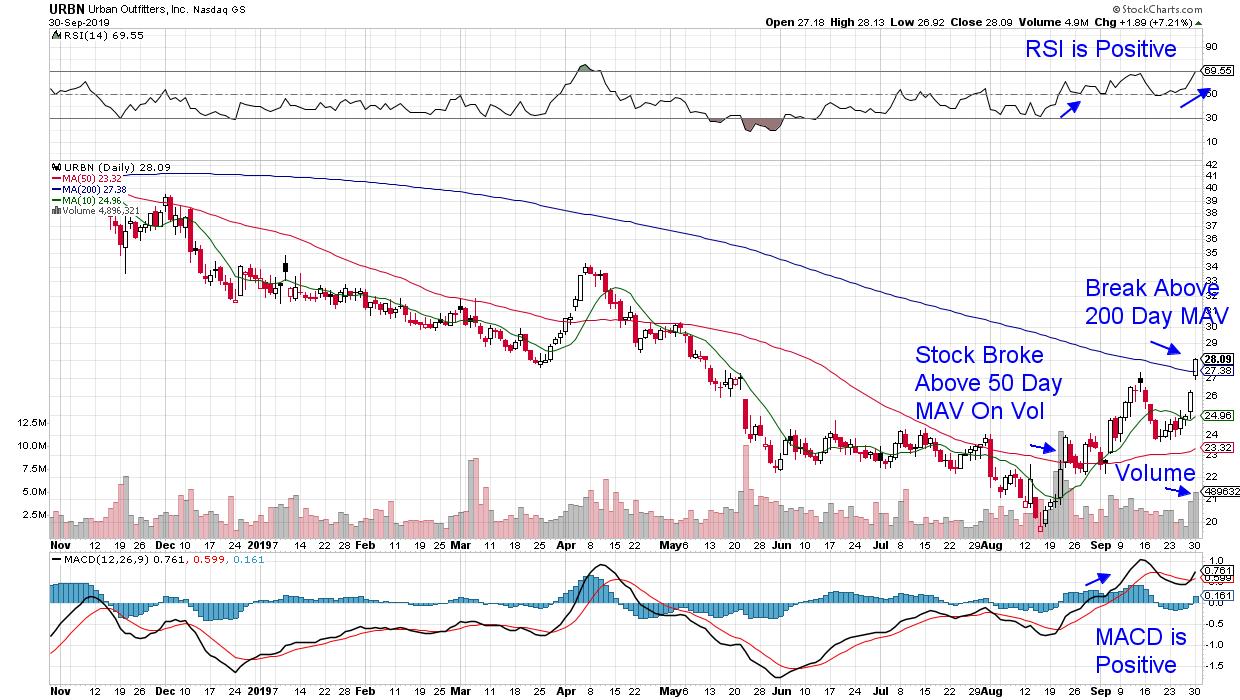
When searching for downtrend reversal candidates, it's important to make sure that the stock's exhibiting bullish technical signals that point to an ability to sustain its new uptrend... Read More