Don't Ignore This Chart! June 30, 2020 at 11:27 AM
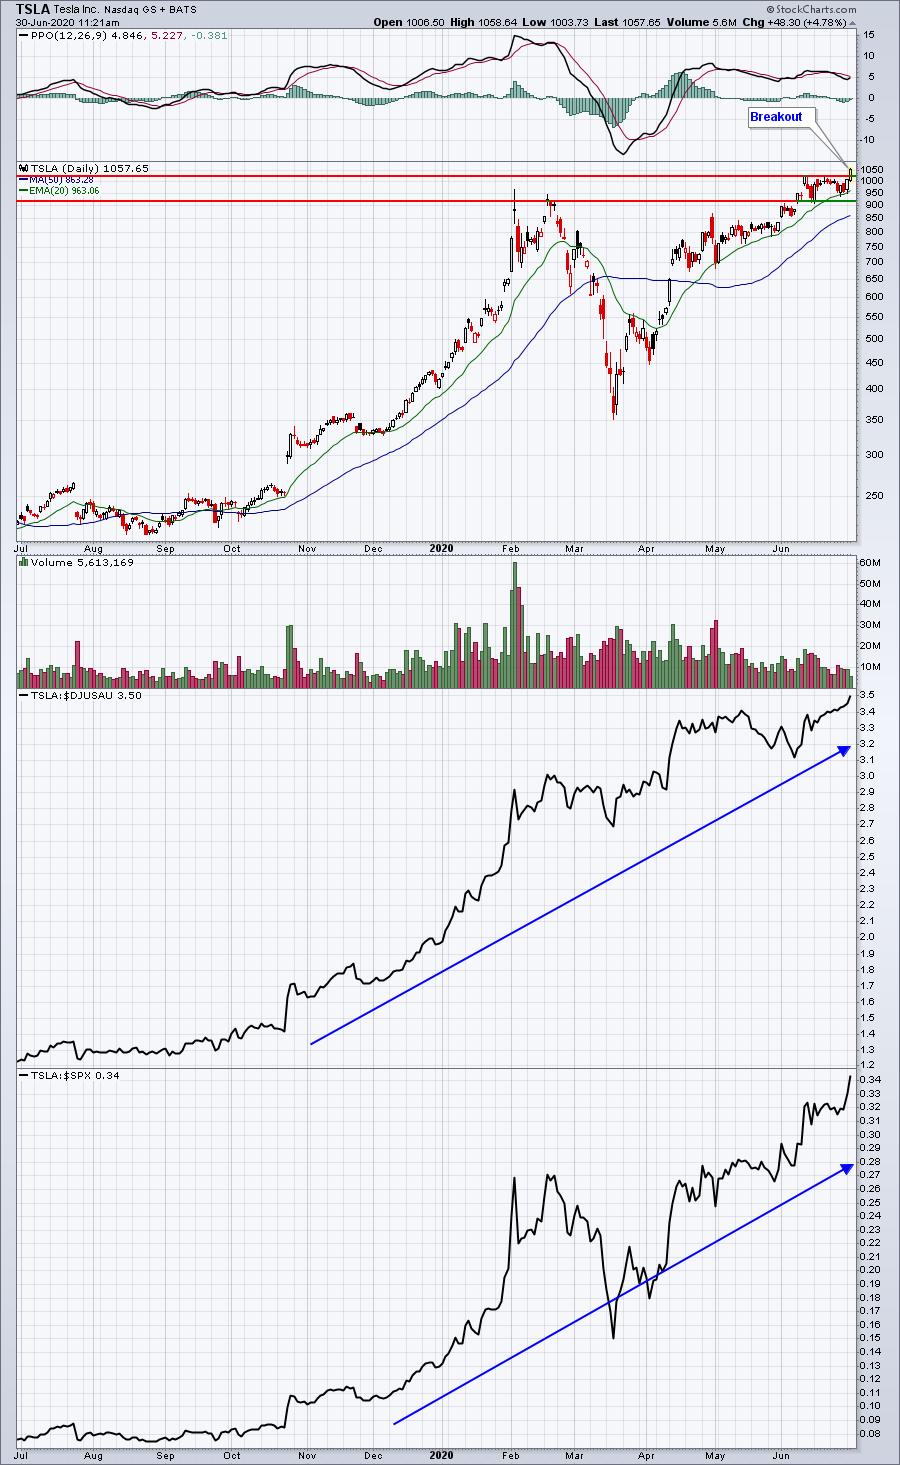
Tesla has been a leading auto stock ($DJUSAU) since it bottomed at 176.99 on June 3, 2019, but few traders expected the stock to clear the $1,000 barrier in just over a year... Read More
Don't Ignore This Chart! June 25, 2020 at 09:42 PM
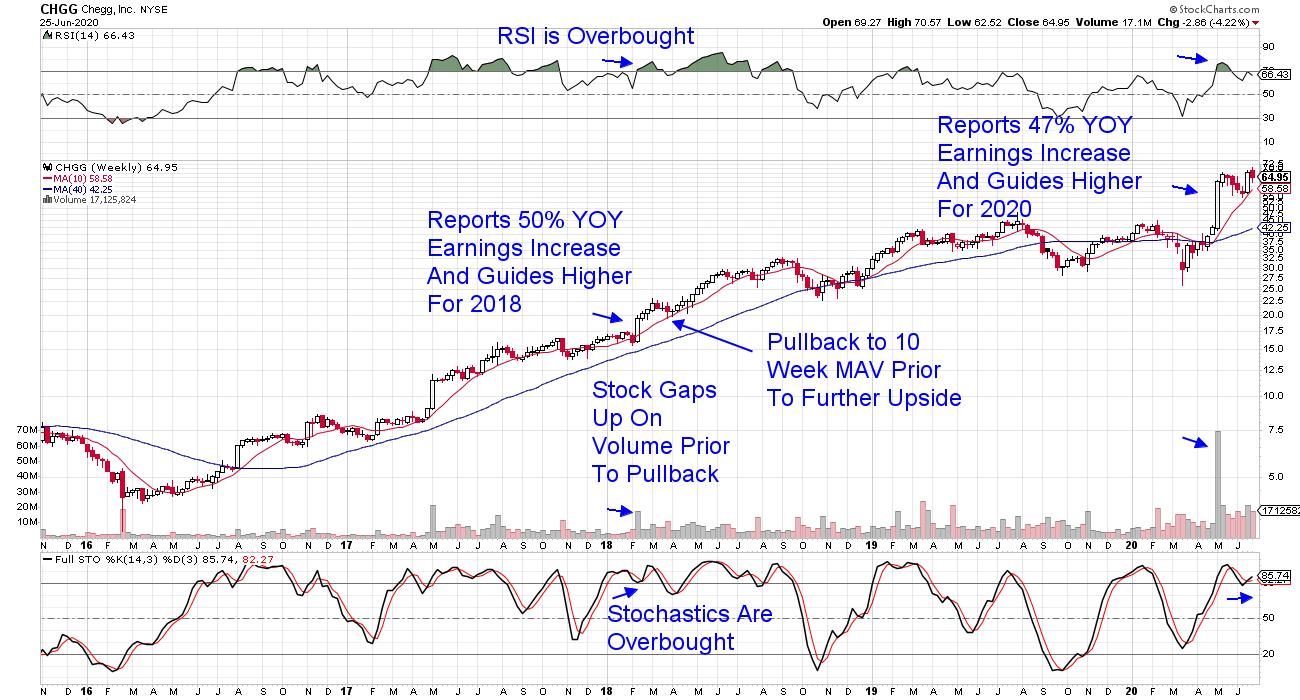
Looking at historical precedence with stocks is the best way to create a foundation from which to build your trading plan going forward... Read More
Don't Ignore This Chart! June 25, 2020 at 01:35 PM
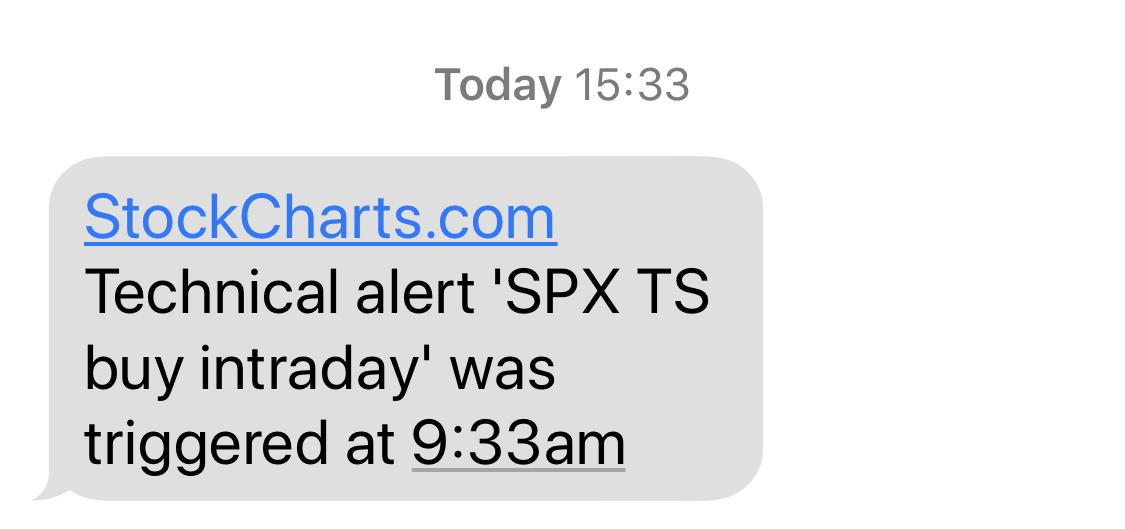
One of the scans that I run on a daily basis is my scan for "Turtle Soup" Buy signals. Actually, I have two versions of that scan - one that runs at last day's close and one that runs on last intraday update... Read More
Don't Ignore This Chart! June 18, 2020 at 10:50 AM
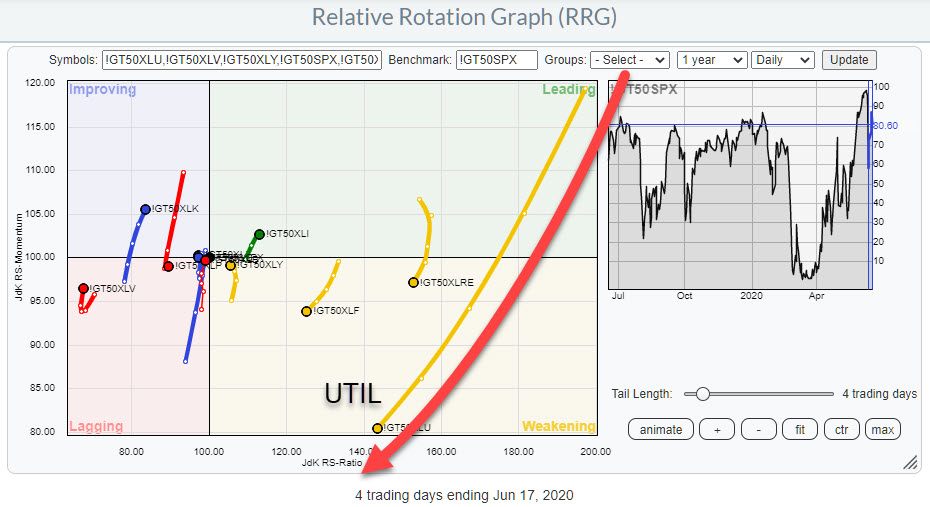
Relative Rotation Graphs are not just good for showing you the relative rotation based on price, but can also help you to see the relative development (rotation) of breadth on a sector level. There are many measures for breadth available in the StockCharts... Read More
Don't Ignore This Chart! June 11, 2020 at 02:24 PM
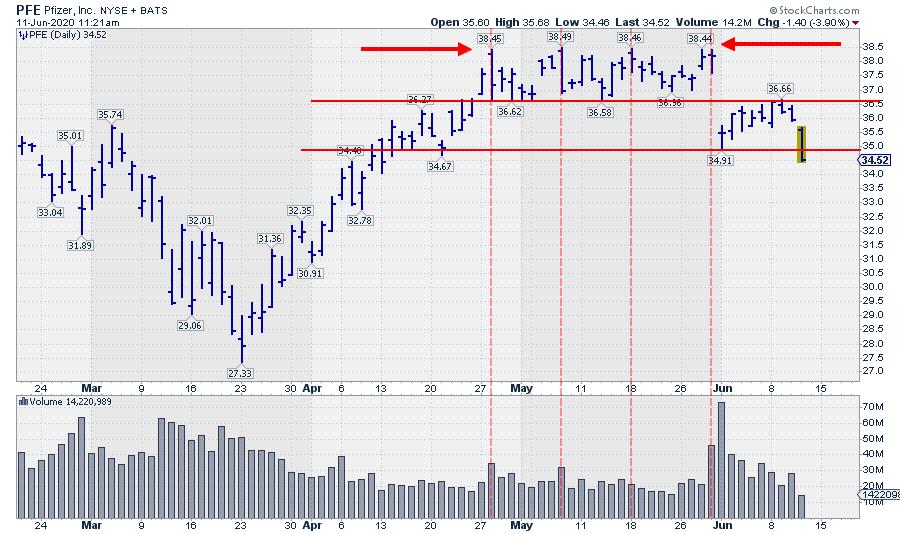
A lot of (very educated) people want us to believe that the market is a random walk. And you know... Maybe sometimes it is, but not always. This morning, I ran into the chart of Pfizer (PFE) again... Read More
Don't Ignore This Chart! June 04, 2020 at 03:36 PM
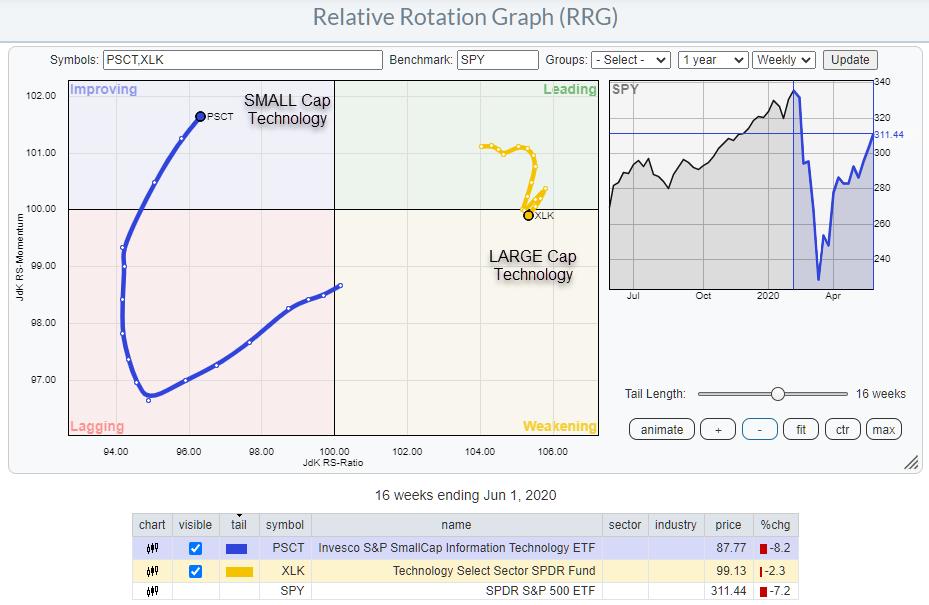
The recovery of the Technology sector out of the March low has been in line with the S&P 500, only 1.5% better... Read More