In the previous articles, I have explained the individual studies or patterns that form the suite of methods and support structures for making trading decisions. Taking this one step further (and exclusive to StockCharts), I have created one study that connects the core (True Measures of Multiple Timeframe Support and Resistance), with the variety of patterns and timing points to create possible entry days to invest. Once that has happened, 4th Dimension monitors market behaviour in order to post multiple exit strategies for taking profits as (and when) they occur. In addition, there is a dynamic stop loss point linked to the previous price action, volatility and range and, once a trade develops, a trailing stop. The final Money Management tool is a user defined Break Even Exit once price has reached a certain profit threshold.
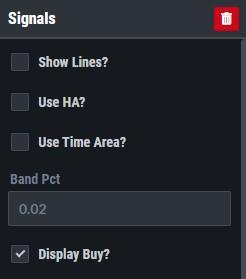
Applicable to Daily charts alone, the first criteria for any possible action point is that the Daily close must be within a certain percentage of a major Weekly or Monthly Peak Expansion or Peak Energy support level. The default is 2%; it can be raised if you wish to be more aggressive and receive more potential opportunities by raising the number in the Band window within the 4th Dimension set-up variables.
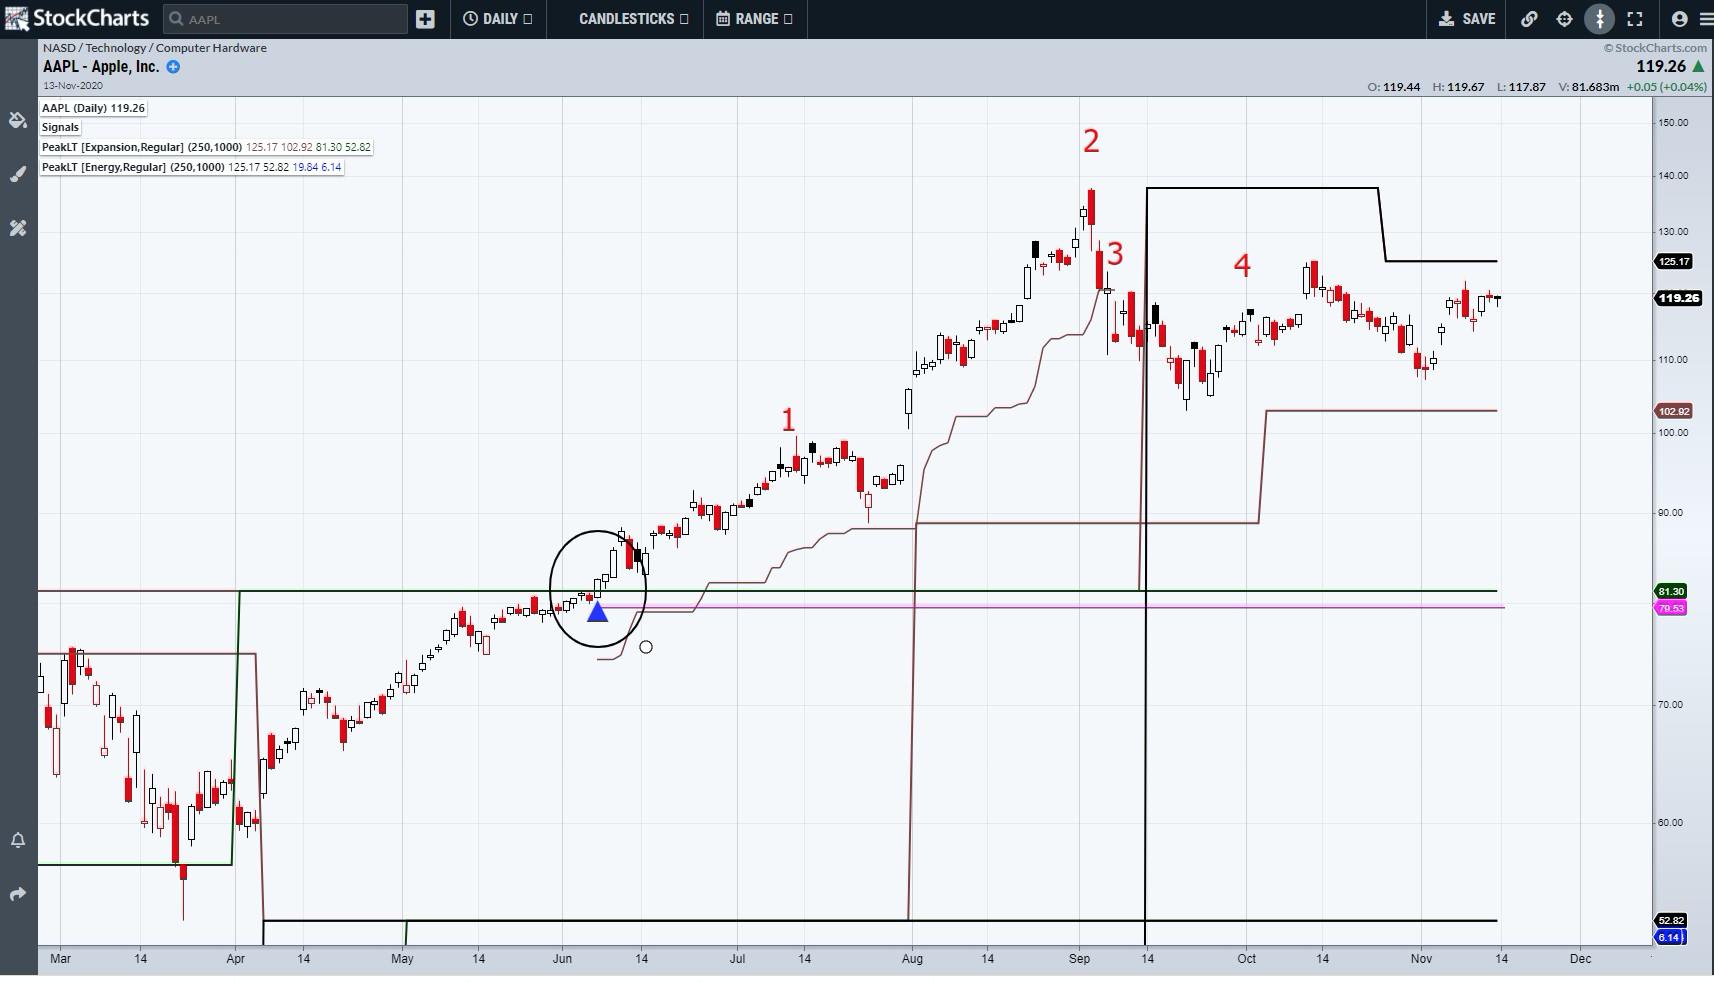
There are 11 separate potential exit criteria, the first 3 being the money management tools mentioned earlier, followed by a variety patterns and code that mark bars when they are true if placed individually on a chart, but in the 4th Dimension, simply place a sequential number above the relevant day. Entry points are flagged by a Blue Triangle. The Apple (AAPL) chart below shows a Breakout buy signal, followed by 4 exit points. Each one represents a potential partial profit-taking decision.
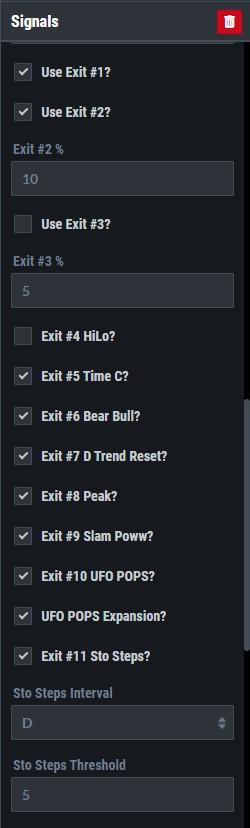
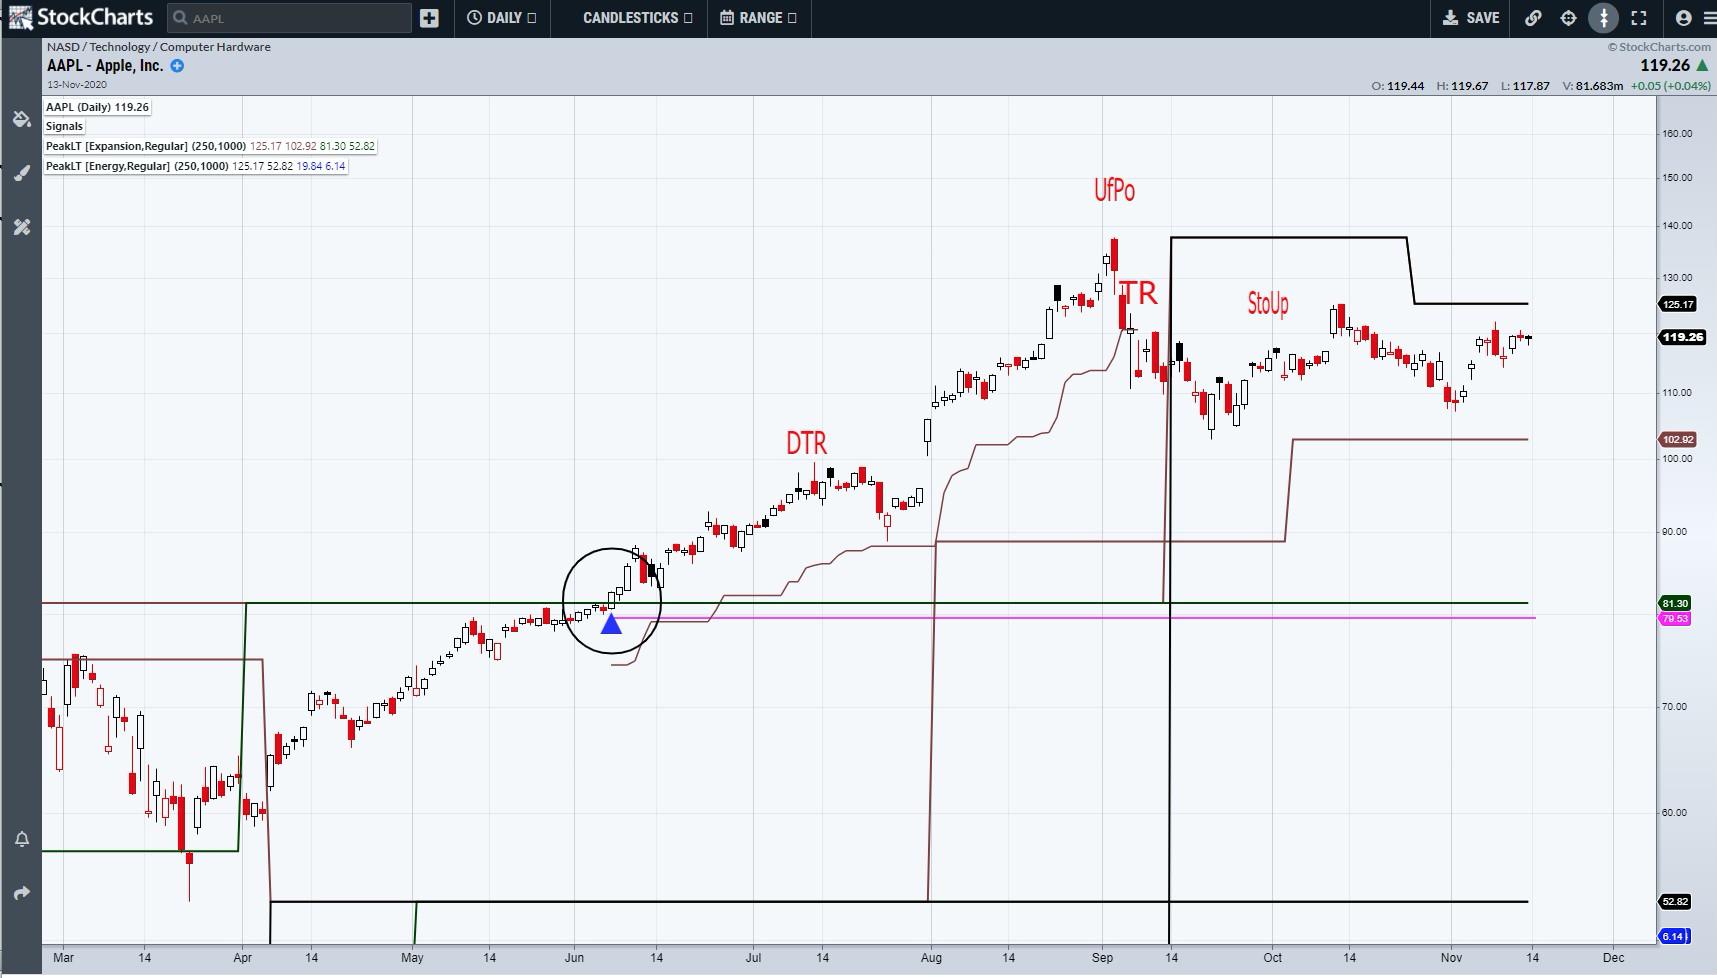
It is possible to change how exits are displayed by switching off Sequential Exits. This will then provide the name of the pattern that actually created the potential exit point. In this case the first exit was Trend Reset, the second was UFO, the third was a close below the Trailing Stop (Brown Line) and the fourth was Stochastic Steps. The latter can have the timeframe it is monitoring altered or the threshold for what constitutes the Stochastic Steps resetting to zero and, therefore, the trend ending. The default is Daily Steps, which must have reached at least 5 steps up. The Pink Line represents the initial stop loss point and will signal that the trade is over if price closes below the that value. This can also be adjusted from the default of 3 Range Deviations under the SD Multiplier window.
In the next article, we will look at how you can modify and manipulate the 4th Dimension to fine tune your investment criteria.
I can be contacted at shaun.downey@aol.com to answer any questions.
Shaun Downey