 Welcome to the recap of Friday's MarketWatchers LIVE show, your antidote for the CNBC lunchtime talking heads. Listen and watch a show devoted to technical analysis of the stock market with live market updates and symbols that are hot.
Information abounds in our Monday/Wednesday/Friday 12:00p - 1:30p shows, but we will give you a quick recap. Be sure and check out the MarketWatchers LIVE ChartList for many of today's charts. Your comments, questions and suggestions are welcome. Our Twitter handle is @MktWatchersLIVE (#mktwatchers), Email is marketwatchers@stockcharts.com and our Facebook page is up and running so "like" it at MarketWatchers LIVE.
What Happened Today?
Talking Technically:
Everyday, Tom and Erin start the show off with important earnings announcements, economic news and developing news in the major markets. Tom enlightened the audience on a few key economic reports that came out today. The economy grew at an annual rate of 1.2 percent in the first quarter, an improvement from the first reading on economic growth. Durable goods orders for April fell less than expected. The consumer sentiment index hit 97.1 for the final May reading vs. estimate of 97.5.
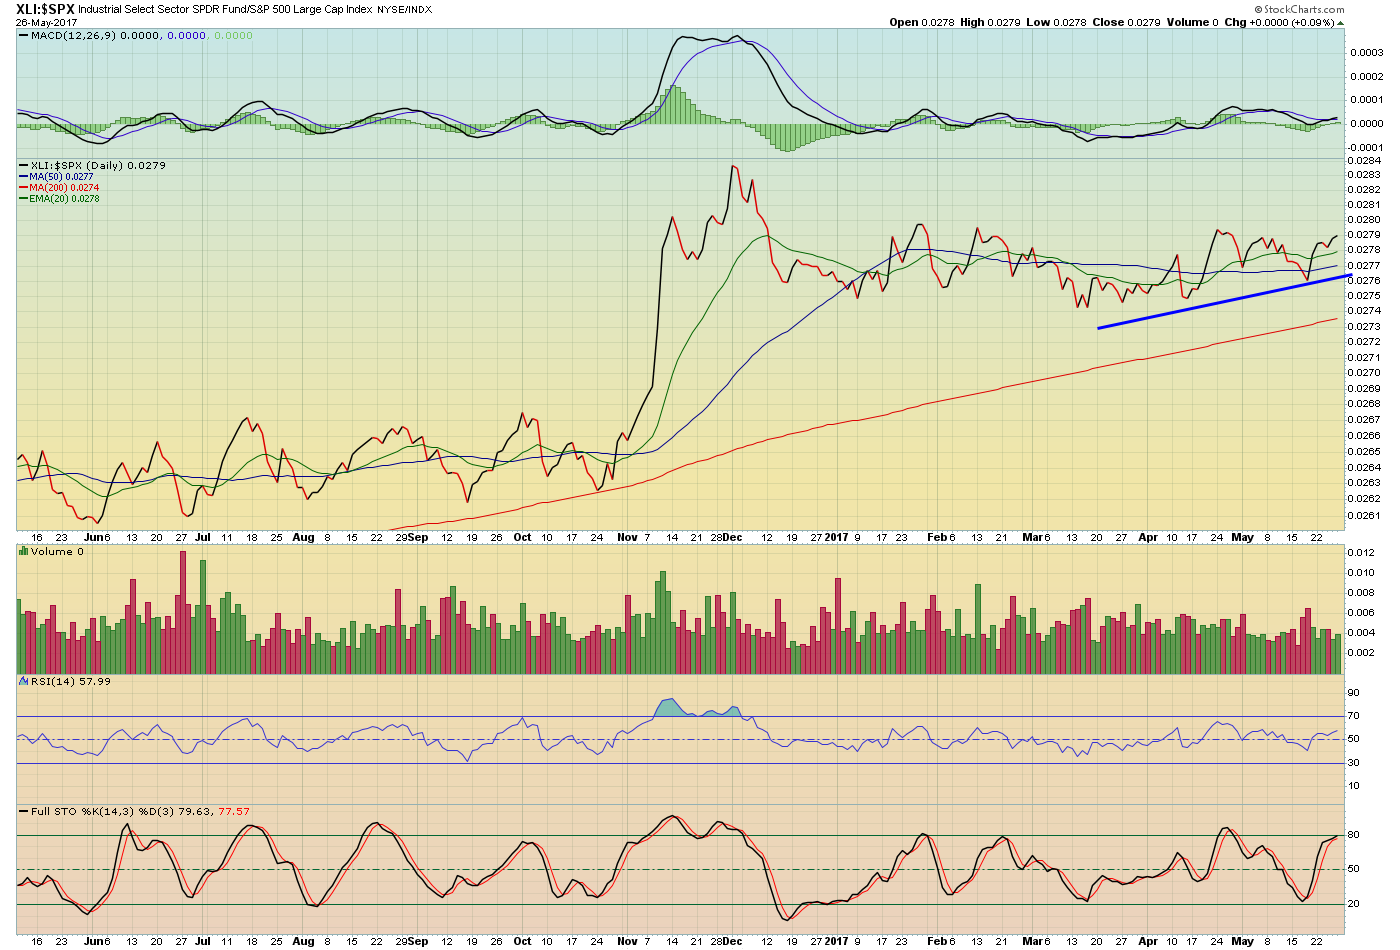
Anatomy of a Trading Strategy: Tom starts by looking at the Sector Summary to see which ones are leading and does a price relative study vs. SPX. Tom determined that the Industrials looked promising based on the price relative chart below:
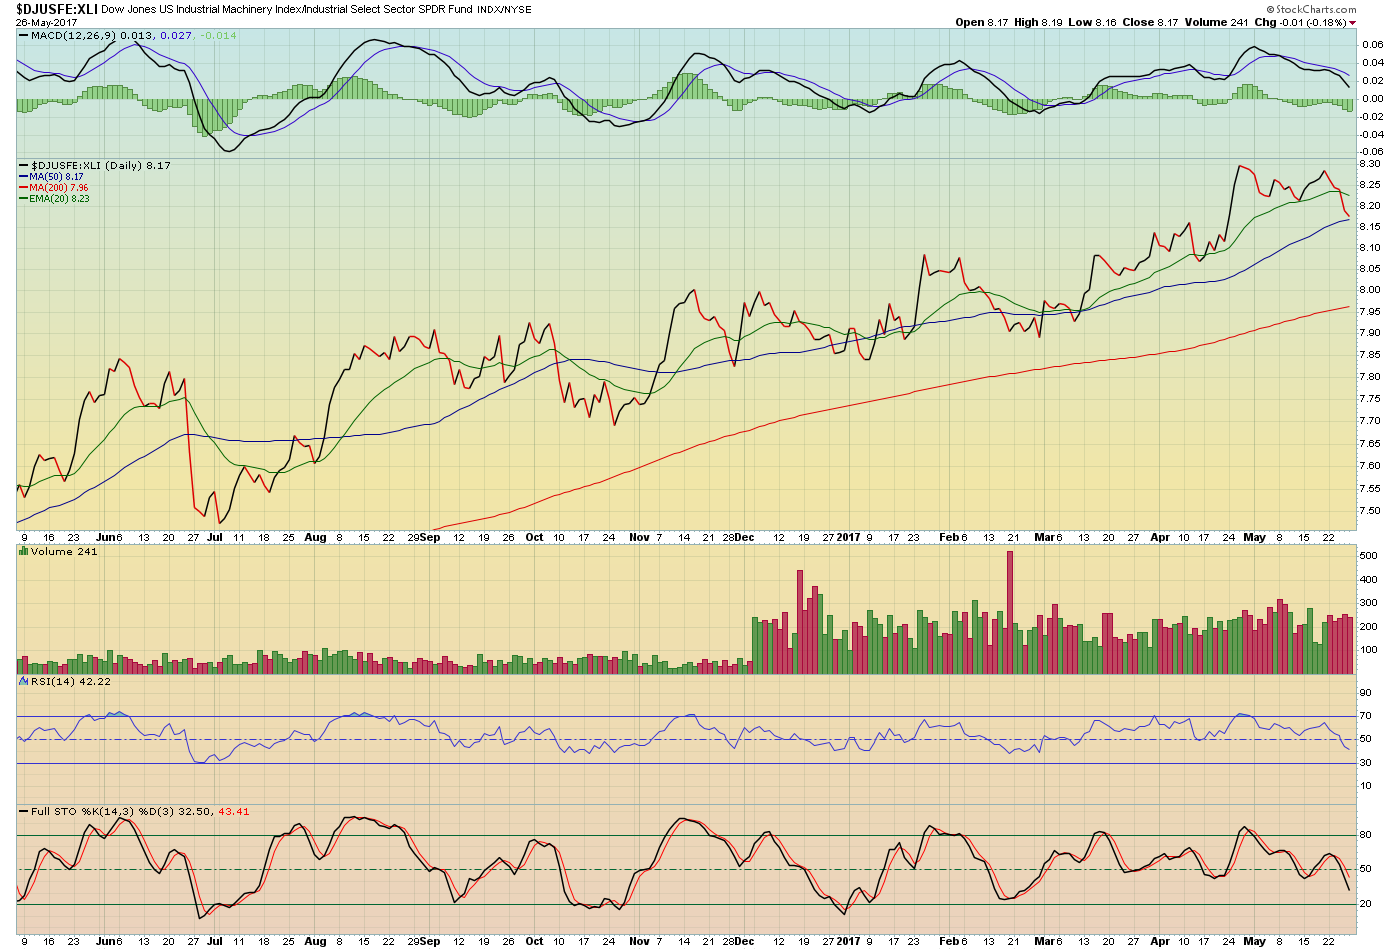
Since Industrials were interesting, Tom then compared XLI to the various industry groups available. The $DJUSFE:XLI was one he liked with an uptrend and pullback.
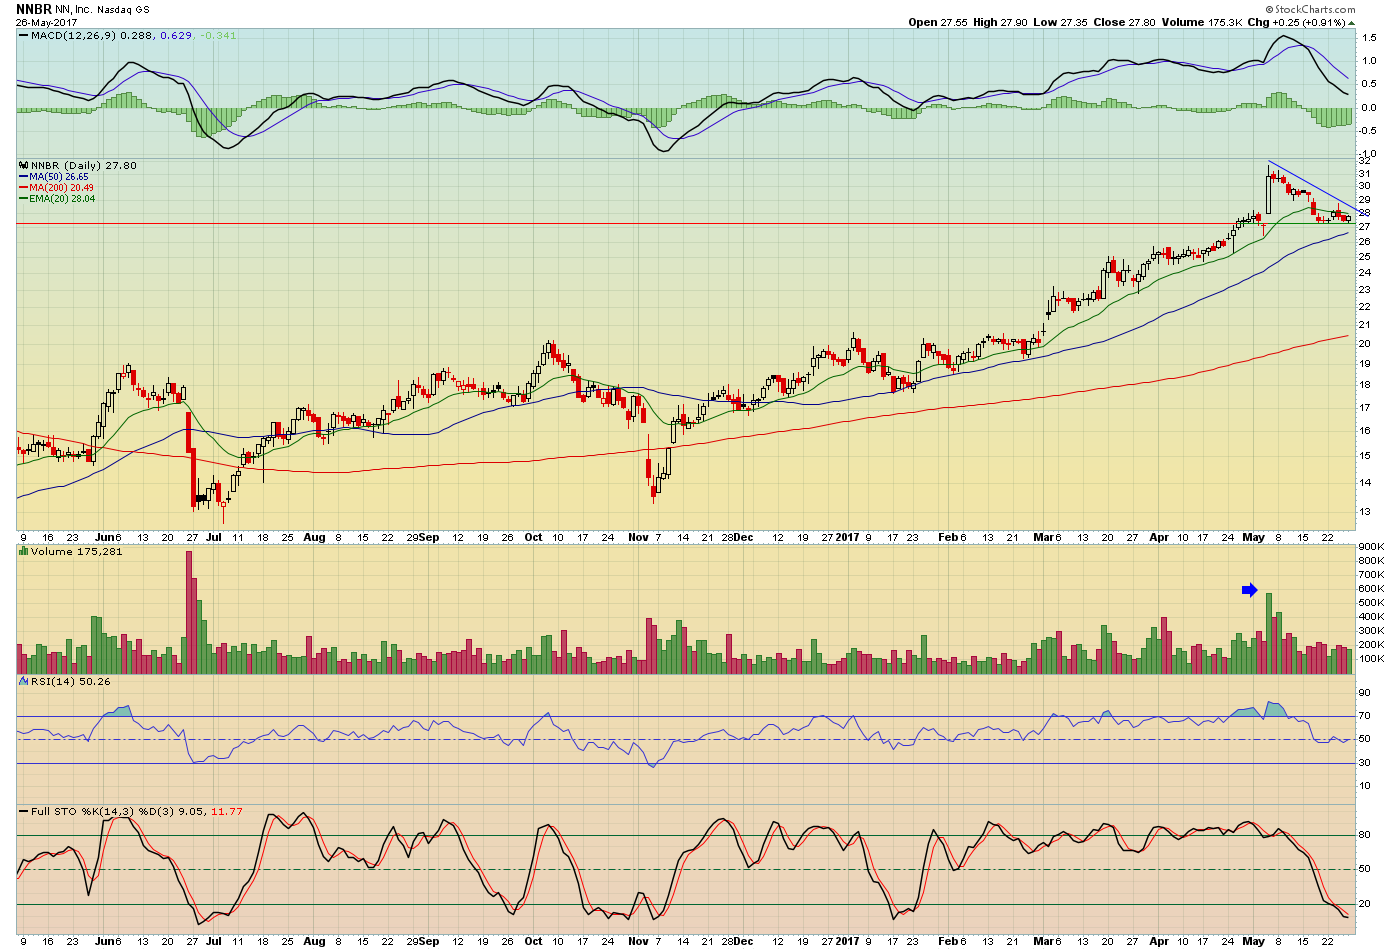
Now that he has an industry group (industrial machinery) that is showing promise, he drills down into it to find possible investments. One way to sort which are the strongest stocks in that industry group is to sort by SCTR ranking. Based on today's SCTR rankings in that industry group, NN, Inc. (NNBR) had the highest rank. He pulled up the chart and noticed support holding. The breakout on high volume was impressive. Tom is looking for a MACD reset and/or a successful test of the 50-MA.
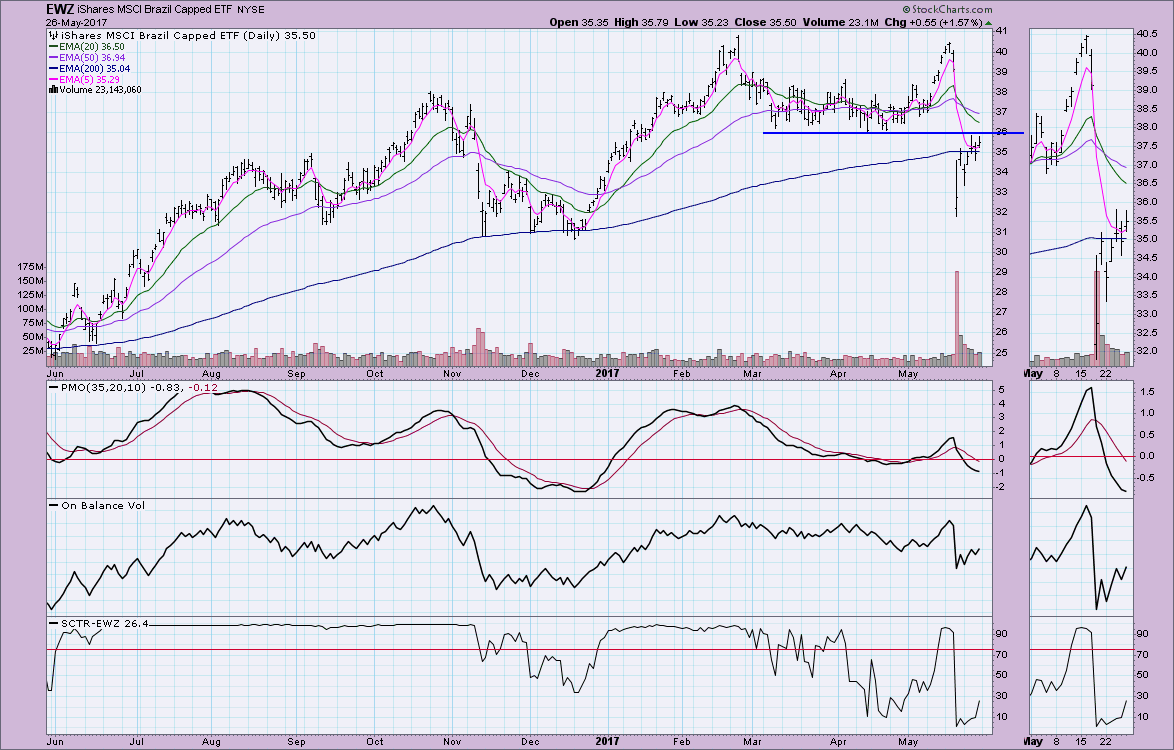
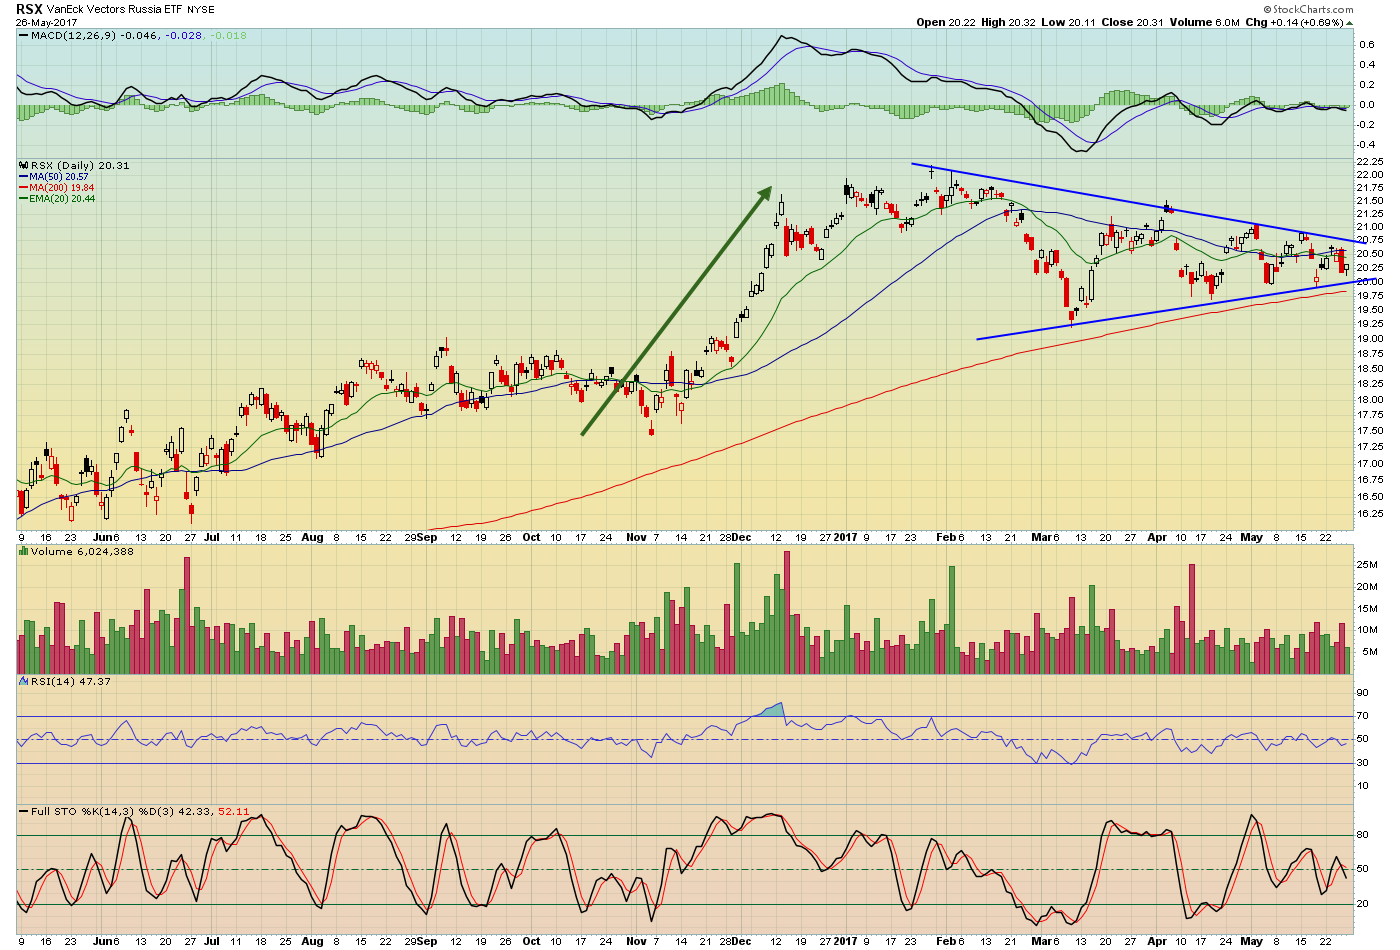
International ETFs: Tom and Erin reviewed some of the major international ETFs, among them was Brazil and Russia below. Both Tom and Erin agreed that Brazil is ready for an important resistance test, but Tom isn't expecting a breakout. Erin sees possibilities with the PMO decelerating and SCTR trying to come back to life, but resistance is key right now.
As far as Russia, the symmetrical triangle is getting a bit long in the tooth, but ultimately, the expectation is a break to the upside. Symmetrical triangles are continuation patterns, so you should expect the previous trend to "continue".
Ten in Ten to One: In this regular segment, Tom reviews ten charts in ten minutes with Erin's comments and comments from the Twitter "peanut gallery" peppered in there. Send in your symbol requests via Twitter (@mktwatcherslive) before the show and we'll try and add them. If we missed them this show, we have many of them in the queue for Wednesday. You'll find all Ten in Ten to One charts in the MarketWatchers LIVE shared ChartList.
DecisionPoint Report: Erin expressed concern over the decline in positive breadth and how overbought her short-term indicators currently are. With the VIX at record lows, she's expecting a pullback You'll find a complete DecisionPoint Report in the DecisionPoint blog article here. Don't miss Saturday morning's DecisionPoint blog "DP Weekly Wrap" where Carl Swenlin publishes his outlook on the current markets.
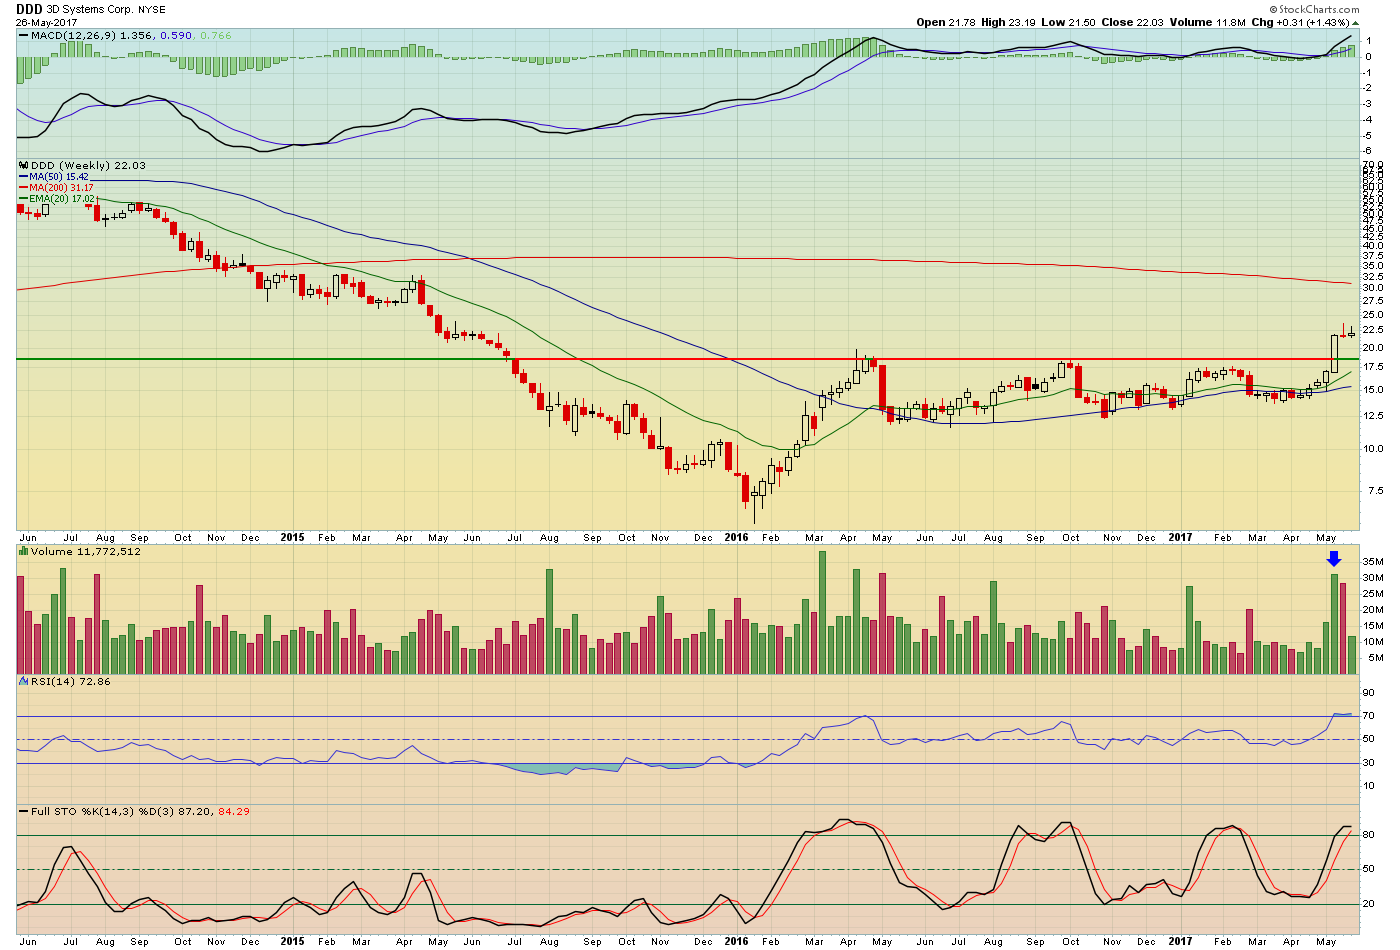
Mailbag Segment: Each show Erin and Tom answer questions received via Twitter, Facebook and Email. Tom was asked to explain how volume comes into play when he trades. Simply put, Tom looks for high volume on breakouts. You can see on the chart below that the high volume breakout suggests follow-through on the rally.
Erin was asked what sectors to watch at a market top. John Murphy has done some excellent work on sector rotation and we recommend you read his book, Trading With Intermarket Analysis. Erin wrote an article about how she follows sector rotation using RRG charts. Mainly, she watches how Consumer Staples, Utilities, Healthcare and Gold react in the market. These sectors and Gold typically lead the market near a market top. Look for Technology, Consumer Discretionary, and Financials to start doing well at market bottoms. Here's a ChartSchool article that covers Sector Rotation.
It's a Wrap! In closing Erin is neutral to bearish on the market next week, while Tom is bullish. What do you think? Our viewer poll will be open on Twitter until showtime on Wednesday at noon EST. Look for our weekly sentiment polls at @mktwatcherslive
Looking Forward:
Tune in on Monday at 12:00p - 1:30p EST on XX/XX for Monday Set-Ups. Tom and Erin will discuss which charts look hot or not for the upcoming week.
The regular segments, Ten in Ten to One and Mailbag are also on tap for Monday, where we look at your recent questions and symbol requests.
Don't miss it!!
