 Welcome to the recap of Friday's MarketWatchers LIVE show, your antidote for the CNBC lunchtime talking heads. Listen and watch a show devoted to technical analysis of the stock market with live market updates and symbols that are hot.
Information abounds in our Monday/Wednesday/Friday 12:00p - 1:30p shows, but we will give you a quick recap. Be sure and check out the MarketWatchers LIVE ChartList for many of today's charts. Your comments, questions and suggestions are welcome. Our Twitter handle is @MktWatchersLIVE (#mktwatchers), Email is marketwatchers@stockcharts.com and our Facebook page is up and running so "like" it at MarketWatchers LIVE.
What Happened Today?
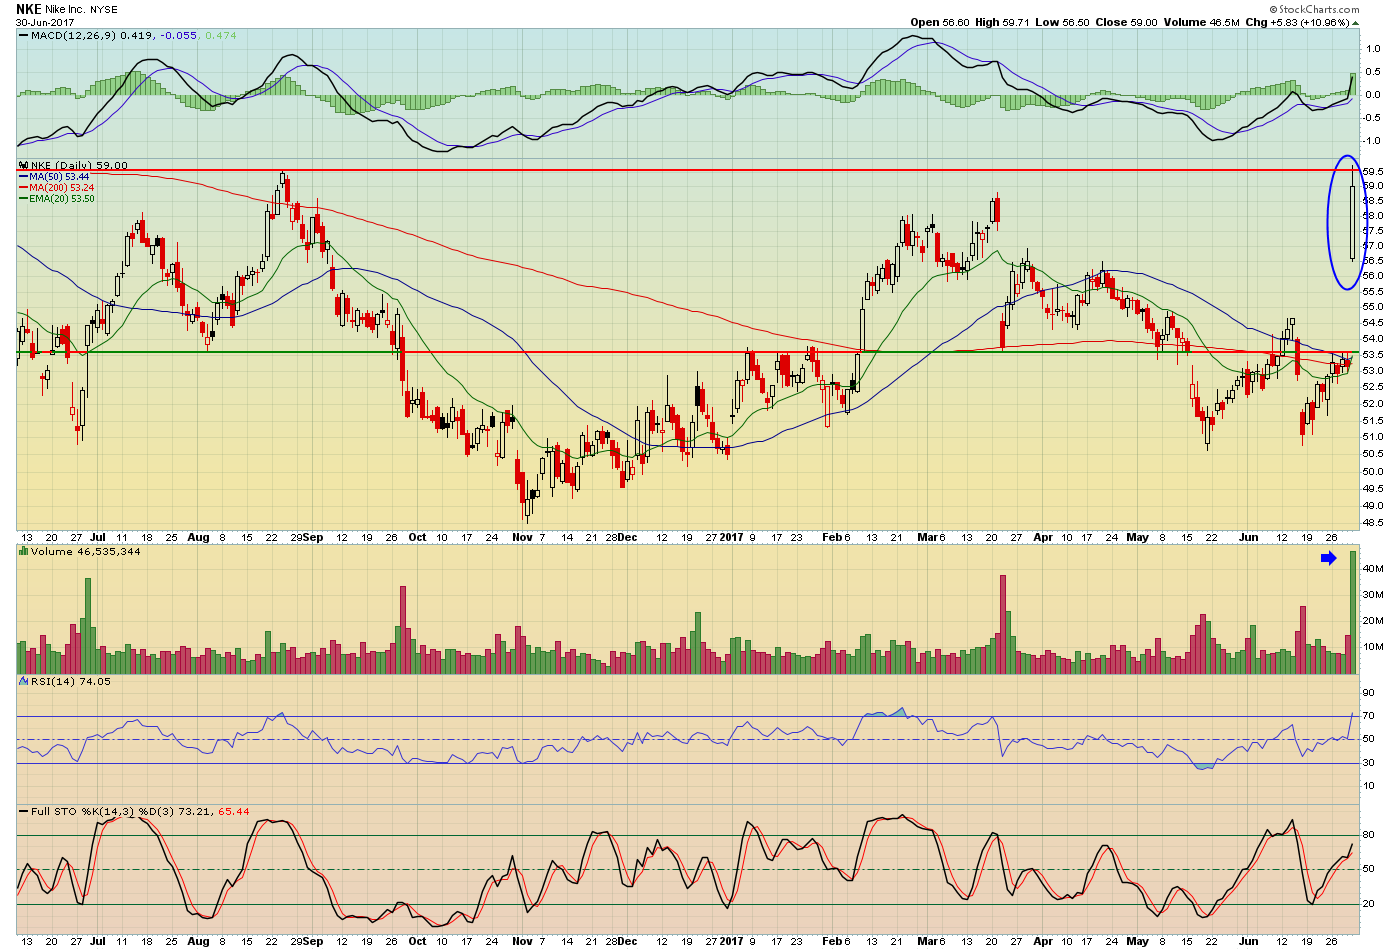
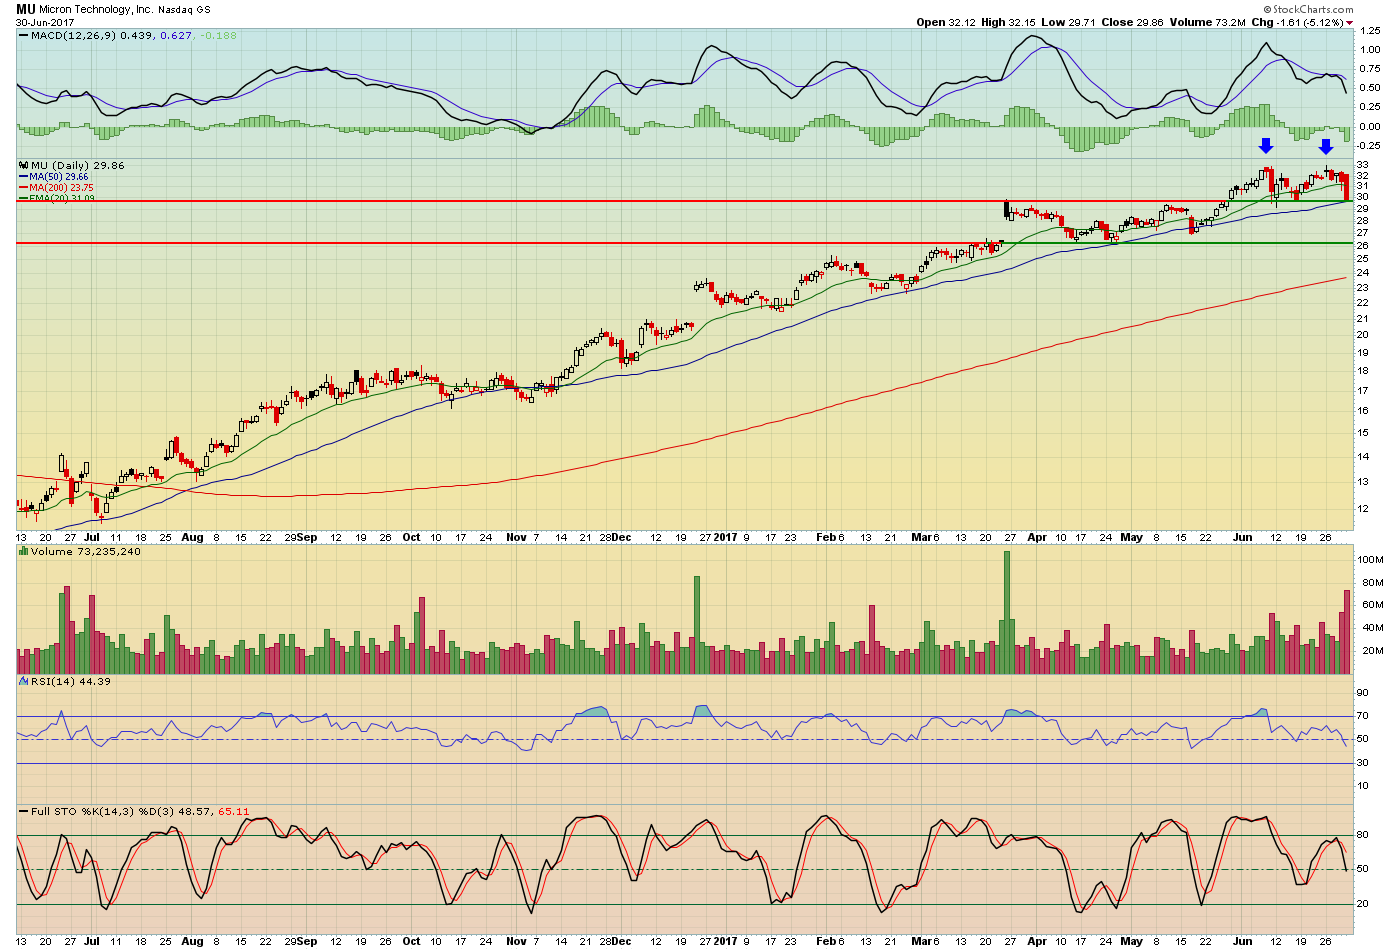
Talking Technically: Tom and Erin discussed various earnings reports, but the hot and not so hot properties turned out to be Nike (NKE) and Micron (MU) respectively. Nike blew away expectations and that showed on today's chart. Additionally it held the top spot on the SCTR movers and Most Actives all day long.
Micron also reported good earnings, but it didn't seem to matter as they are sitting in the out of favor technology sector.
Be sure to check out Tom's latest blog article to see some of the other material covered in this segment.
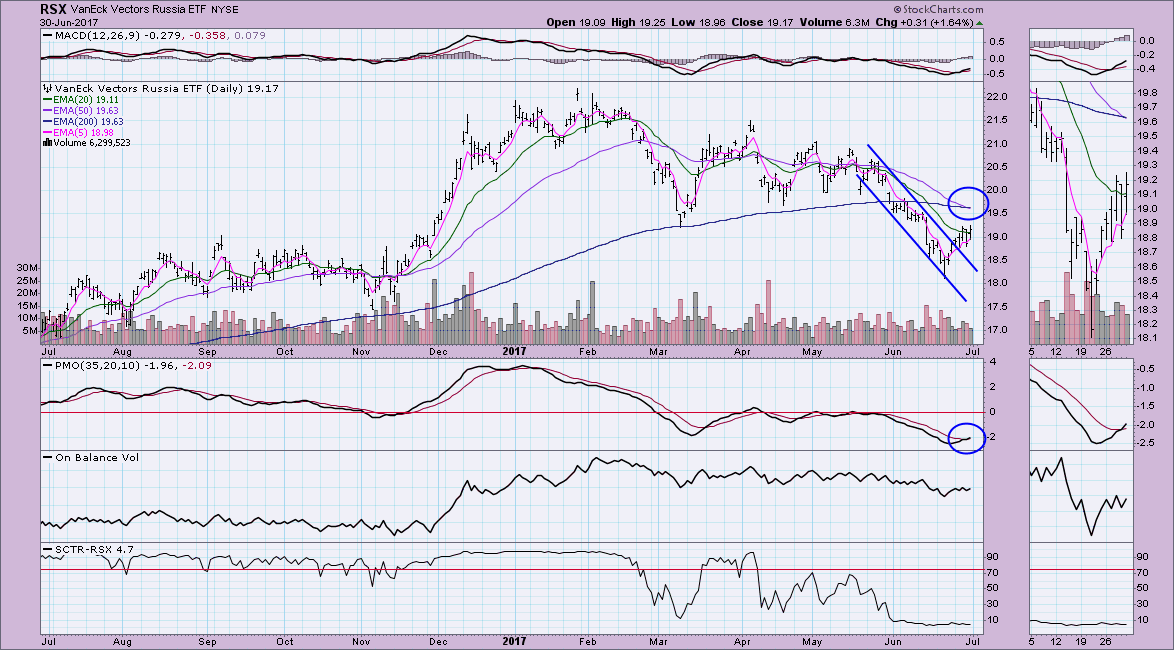
ETF Watch: After the second Market Update, Tom and Erin discussed the Russia ETF (RSX) which was leading today. They had differing views on the bullishness v. bearishness of the chart. There are definitely mixed signals here. While Erin did like the breakout and PMO BUY signal, the negative 50/200-EMA crossover initiated a Long-Term Trend Model SELL signal. When a stock or ETF is on a LTTM SELL signal, DecisionPoint analysis tells us it is in a "bear market" and should expect bearish outcomes over bullish ones. She was bearish. Tom liked the MACD reset and pop above the 20-EMA. He did warn of overhead resistance in the $19.50 range.
Ten in Ten Before One: In this regular segment, Tom reviews ten charts in ten minutes with Erin's comments and comments from the Twitter "peanut gallery" peppered in there. Send in your symbol requests via Twitter (@mktwatcherslive) before the show and we'll try and add them. Tom annotated MMM, XOP, FCEL, CA, GNTX, AAOI, HCG.TO, EDU, APC and VRAY. To see all of the annotations, go to the MarketWatchers LIVE ChartList. The link is at the top of the MarketWatchers LIVE blog.
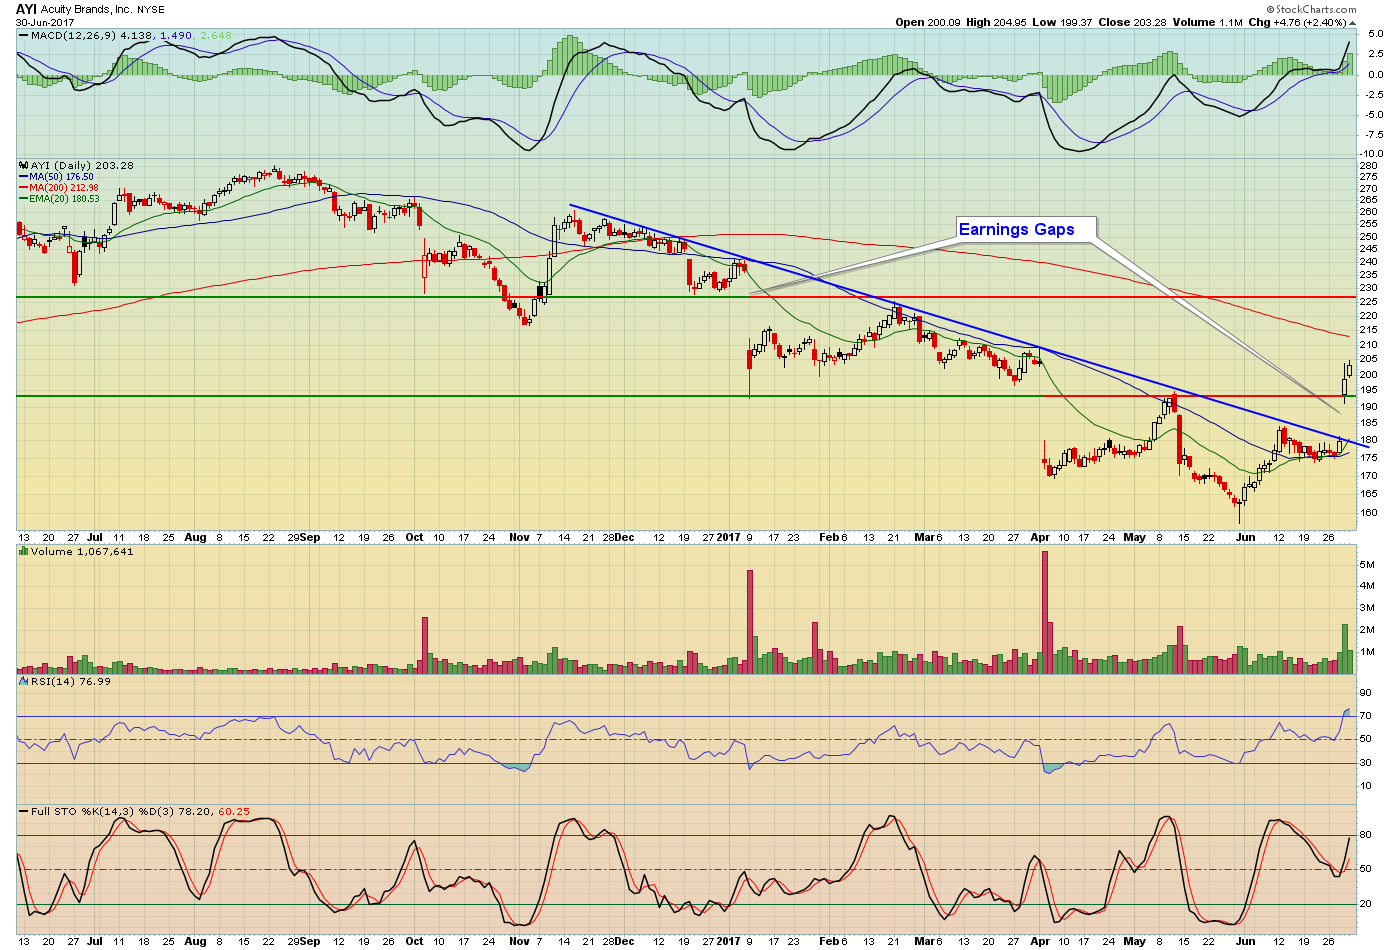
Earnings Spotlight: Today Tom spotlighted Acuity Brands (AYI) which reported yesterday. He liked the breakout and gap, but price is holding support.
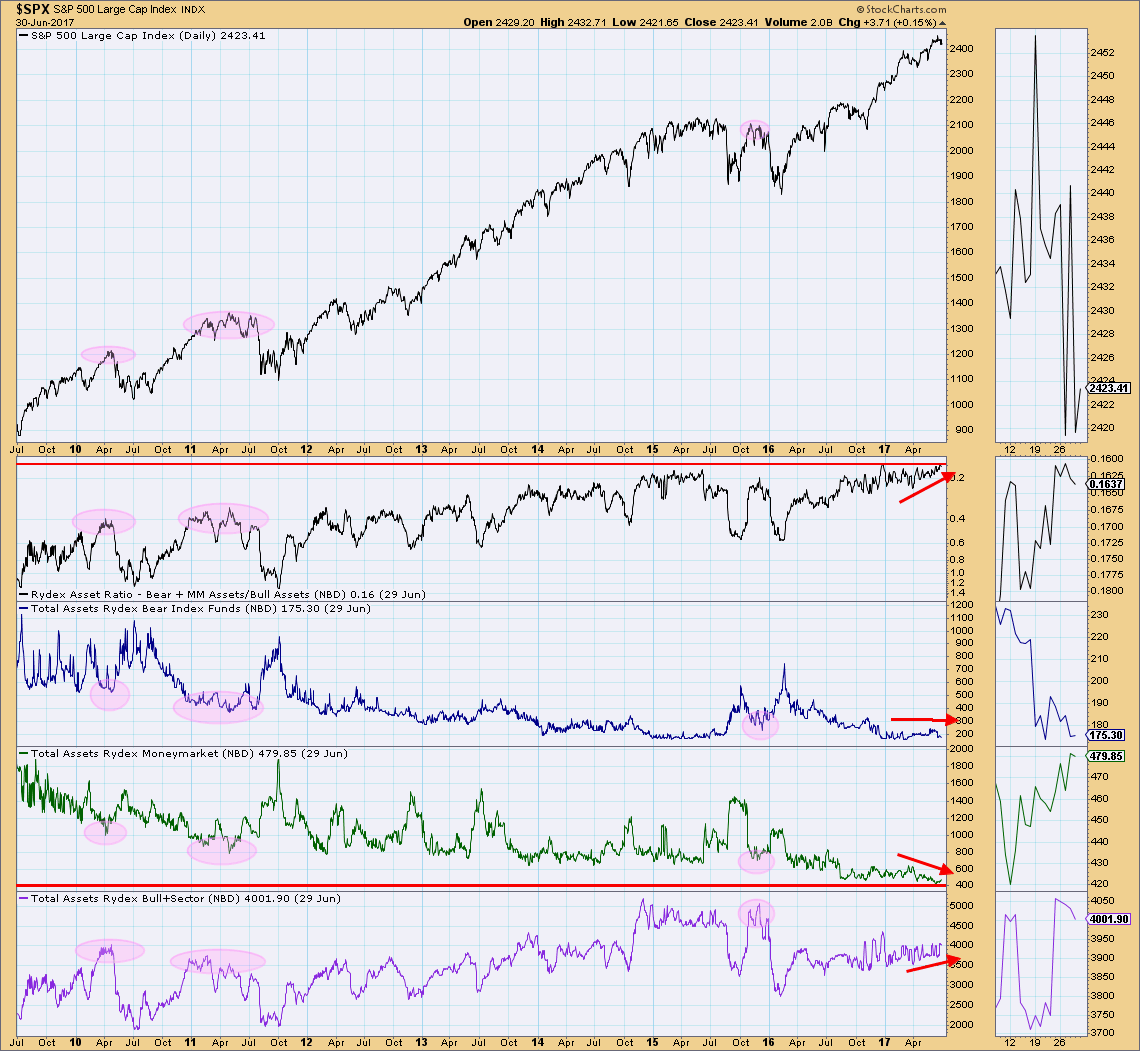
Sentiment: Erin highlighted the Rydex Ratio chart, AAII and NAAIM. Rydex Ratio still shows bullish behavior as bull assets increase and money market/bear fund assets decrease. As far as "money where your mouth is", investors in Rydex funds are very bullish.
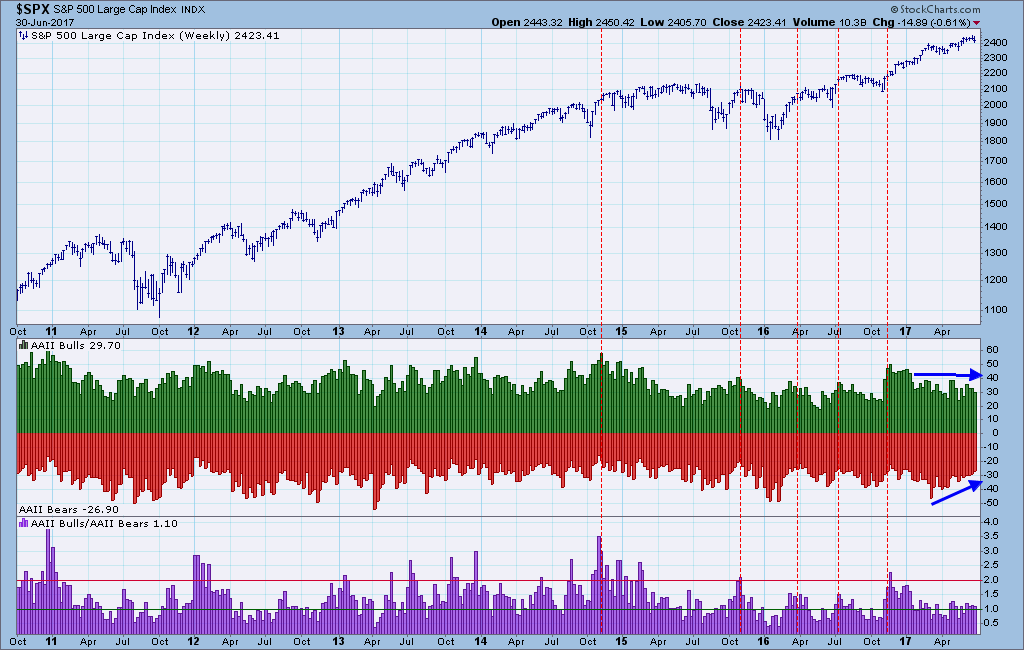
AAII also shows respondents are getting less bearish, but not correspondingly bullish. Bear numbers are falling, but so have bullish numbers over the past few weeks. This reflects some uncertainty among individual investors.
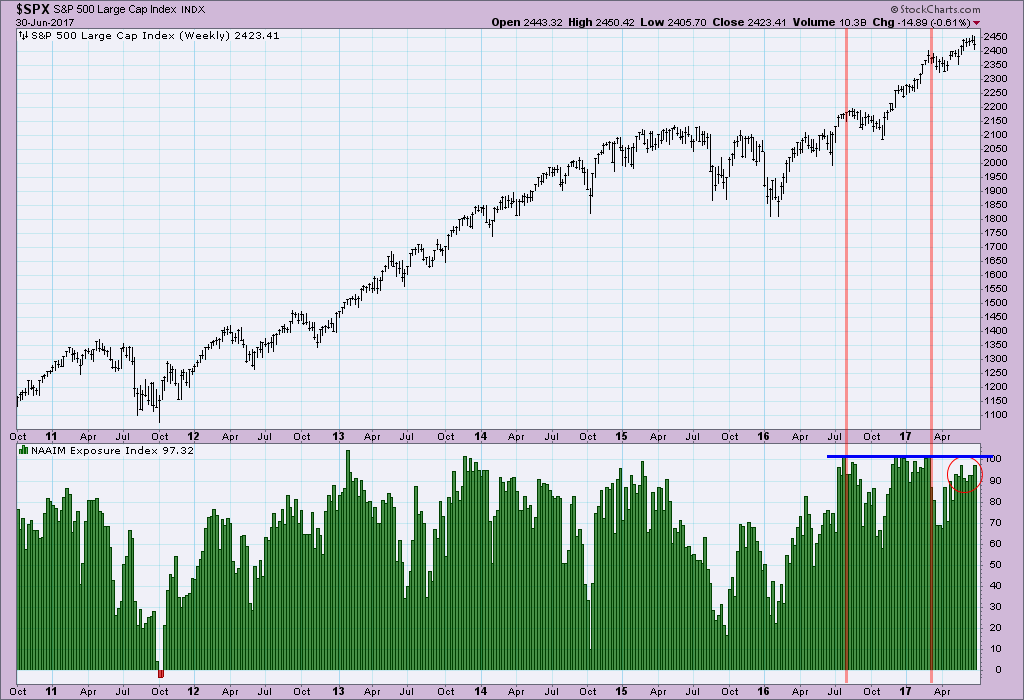
The National Association of Active Investment Managers shows they are exposing themselves more. However, it's important to note that they still are not as exposed as we saw at the previous market tops.
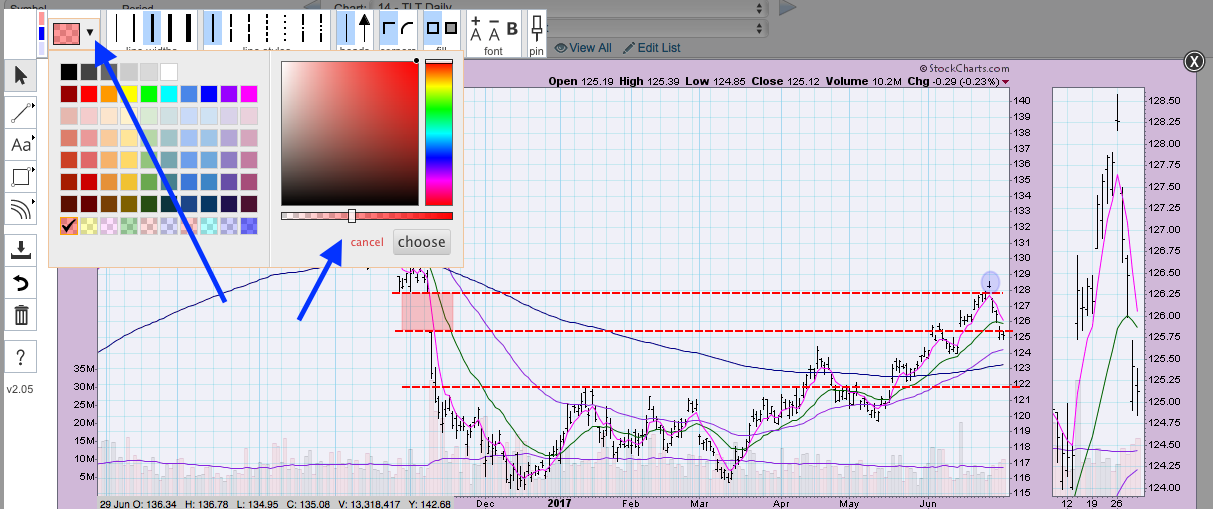
Mailbag Segment: Each show Erin and Tom answer questions received via Twitter, Facebook and Email. Tom was asked if he has researched European seasonality. His answer was long, but ultimately "NO" (love ya, Tom!). Erin was asked to demonstrate how to lower the opacity of shapes within the annotation tool. Click on the "color" dropdown and then use the slider to make the "fill" less opaque:
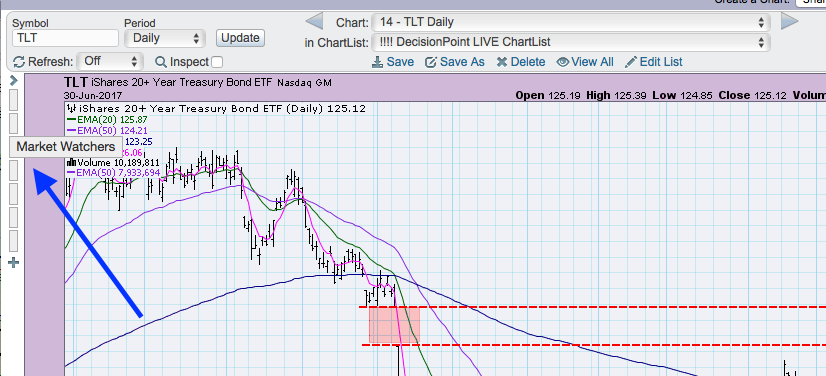
She also showed everyone how to save blogger ChartStyles and create "Style Buttons". If you see a chart anywhere on the site, click on it and all of the style settings are already there. If you want to manipulate or change it, go for it! When you click to "Add New", it will ask you to name the ChartStyle (Bonus: if you save it as "CandleGlance", it will be your new "CandleGlance" ChartStyle). Give it a name and then choose a "Button number".
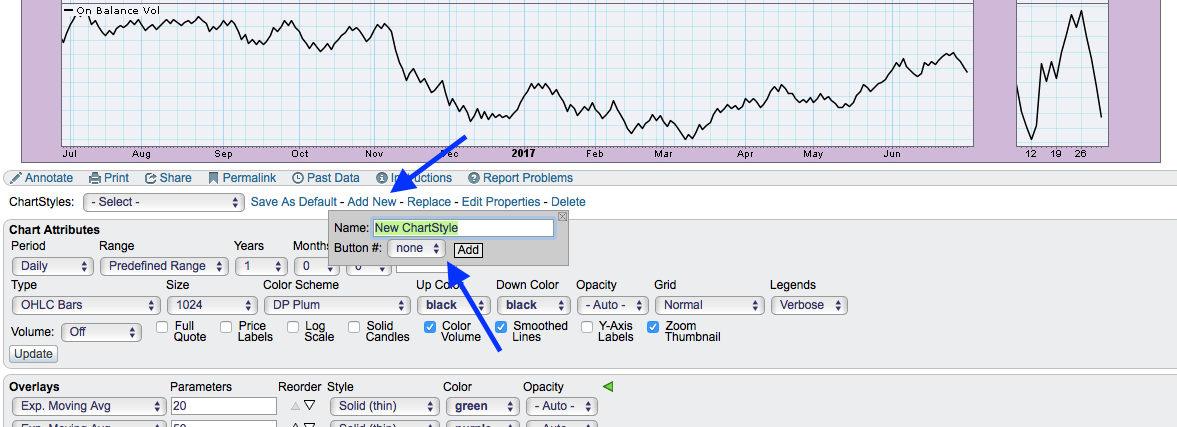
Once you add the ChartStyle and assign a "button #", you can use the buttons to the left of your chart to quickly switch from one favorite ChartStyle to another! If you watch the MarketWatchers show, you probably have seen Tom and Erin use the buttons to switch between each other's ChartStyles for the show.
Tom was asked to explain the effect of huge volume on selling and how he determines whether it is a minor correction or change in the trend. Of course the answer is it depends and you won't always know; however, using 20-EMA tests and MACD divergences as well as support/resistance will clue you in.
It's a Wrap! In closing Tom and Erin discussed their outlook for the market next week. Erin said that she would be turning in a "bearish" vote to the Wall Street Weekly Sentiment Survey and Tom said that positive seasonality in the first week and around a holiday is generally bullish, but he wasn't feeling that confident and decided to make a "neutral" call. What do you think? Our viewer poll will be open on Twitter until showtime on Monday at noon EST.
Looking Forward:
Tune in on Monday at 12:00p - 1:30p EST on 7/1 for Monday Set-Ups. Tom and Erin will discuss which charts look hot or not for the upcoming week.
The regular segments, Ten in Ten to One and Mailbag are also on tap for Monday, where we answer your questions and take symbol requests.
Don't miss it!!
