Welcome to the recap of Wednesday's MarketWatchers LIVE show, your antidote for the CNBC/FBN lunchtime talking heads. Listen and watch a show devoted to technical analysis of the stock market with live market updates and symbols that are hot.
Information abounds in our Monday/Wednesday/Friday 12:00pm - 1:30pm EST shows, but the MWL blog will give you a quick recap. Be sure and check out the MarketWatchers LIVE ChartList for many of today's charts. When you first arrive at the MarketWatchers LIVE blog page, you'll see a link to the ChartList in the upper left corner.
Your comments, questions and suggestions are welcome. Our Twitter handle is @MktWatchersLive and/or #mktwatchers, email is marketwatchers@stockcharts.com and our Facebook page is up and running so "like" it at MarketWatchers LIVE. Don't forget to sign up for notifications at the bottom of this blog article by filling in your email address and hitting the green "Notify Me!" button.
What Happened Today?
Greg and Tom discussed Apple's (AAPL) solid quarter, but were disappointed that the NASDAQ and technology stocks have been unable to capitalize on excellent quarterly results from prominent names such as Netflix (NFLX), Facebook (FB) and Apple (AAPL). We've seen four gaps higher in the past five trading sessions on the NASDAQ 100 ($NDX), but the early strength couldn't be sustained through the trading day as you can see below:
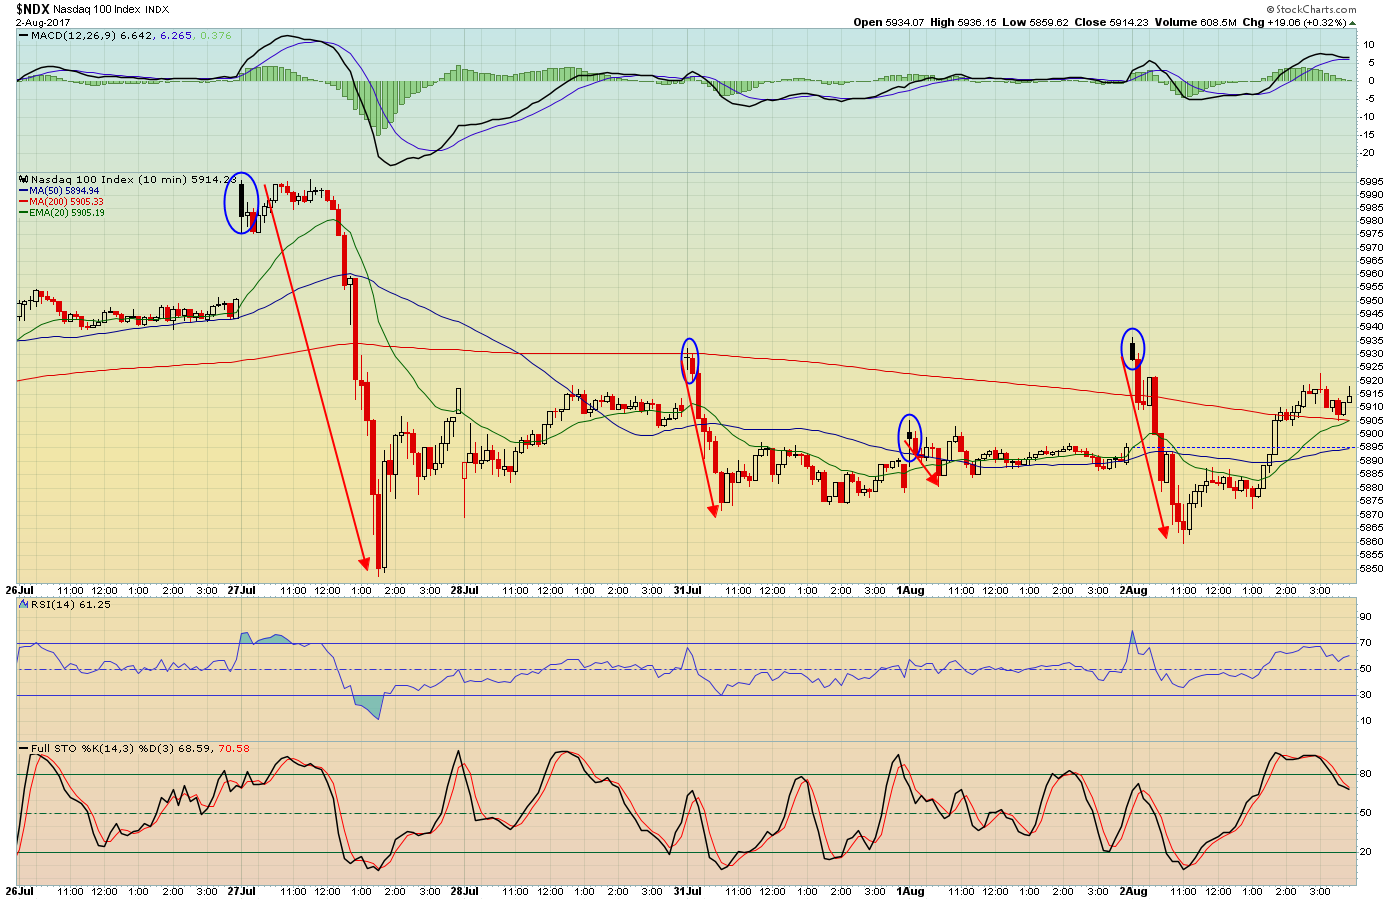 Negative divergences on the weekly charts suggest that momentum is slowing in many areas including technology. The action that we've seen over the past week - with early buying and late selling - suggests momentum could be slowing as well.
SCTR Movers
Greg spent quite a bit of time evaluating some of the top SCTR movers among large, mid and small cap stocks. One of the best looking stocks - Illumina (ILMN) - came from the hot biotechnology space. ILMN posted solid quarterly earnings results after the bell on Tuesday and surged in Wednesday trading with its SCTR score catapulting from 31.4 to 94.0 and its stock price jumping more than 25 bucks, or +14.83%. The best news of all? The chart:
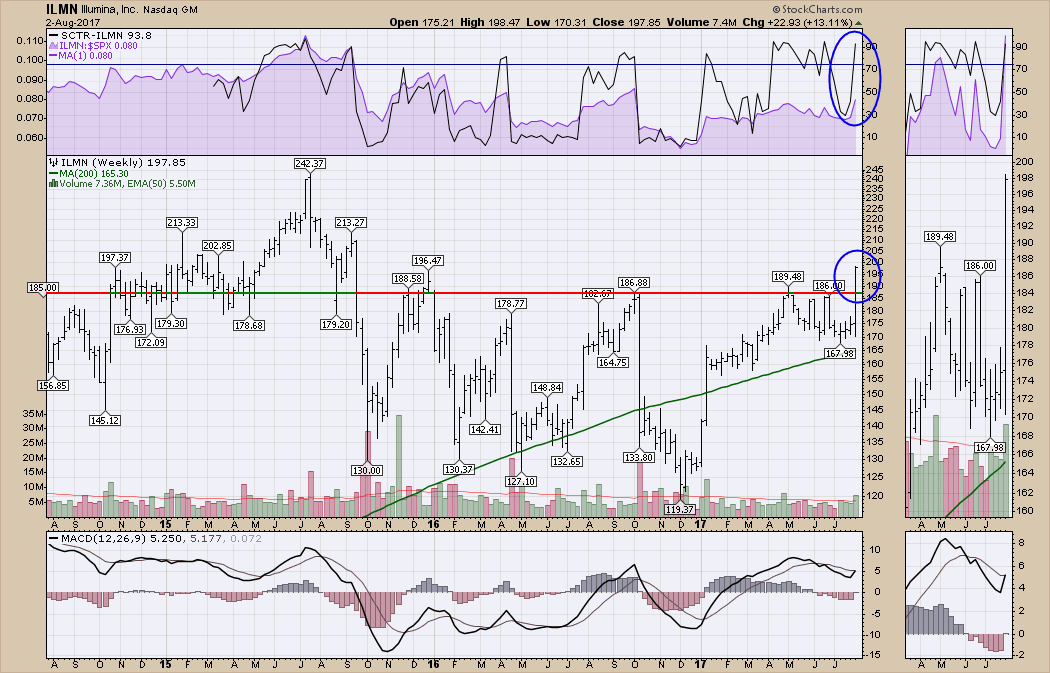 That's a breakout worth noting in an industry group that's been seeing one breakout after another.
10 in 10
During his regular segment at 12:50pm EST, Tom showed how quickly you can review and annotate 10 stocks into a ChartList using the powerful tools here at StockCharts.com. Symbol requests were sent in by viewers on Twitter and GoToWebinar as Tom demonstrated how to use the annotation tool to highlight key levels of price support/resistance, trendline support, candlestick patterns, etc. Symbols reviewed today included EMR, ESNT, FSLR, IMGN, IBB, KAT.TO, KR, MRVL, SPWR and OLED. You'll find all of the charts in the MarketWatchers LIVE ChartList, located at the top of the MarketWatchers LIVE blog page.
Scan Tutorial
Greg spent some time showing how to set up a stochastic scan to identify stocks that were previously oversold, but were beginning to show strength and move out of oversold territory. On the Advanced Scan workbench and under Scan Criteria, type in the following:
[Country is US] and [type is stock] and [sma(20,volume) > 400000]
and [Weekly Full Stoch %K(14,3,3) >20.0] and [Weekly Full Stoch %K(14,3,3) <40.0] and [4 weeks ago Full Stoch %K(14,3,3) < 20.0]
and [close >4.00]
The result? About 100 stocks that fit the scan criteria, providing you a list of recently oversold stocks that might just be turning the corner - rather than attempting to chase the current leaders, many of which appear to be getting very tired.
Mailbag
A question came in dealing with a stock that saw its accumulation/distribution line and on balance volume diverging. The stock was CHCT and the specific question was "what happens when we see a divergence like that"? So Tom pulled up the chart and discussed the divergence:
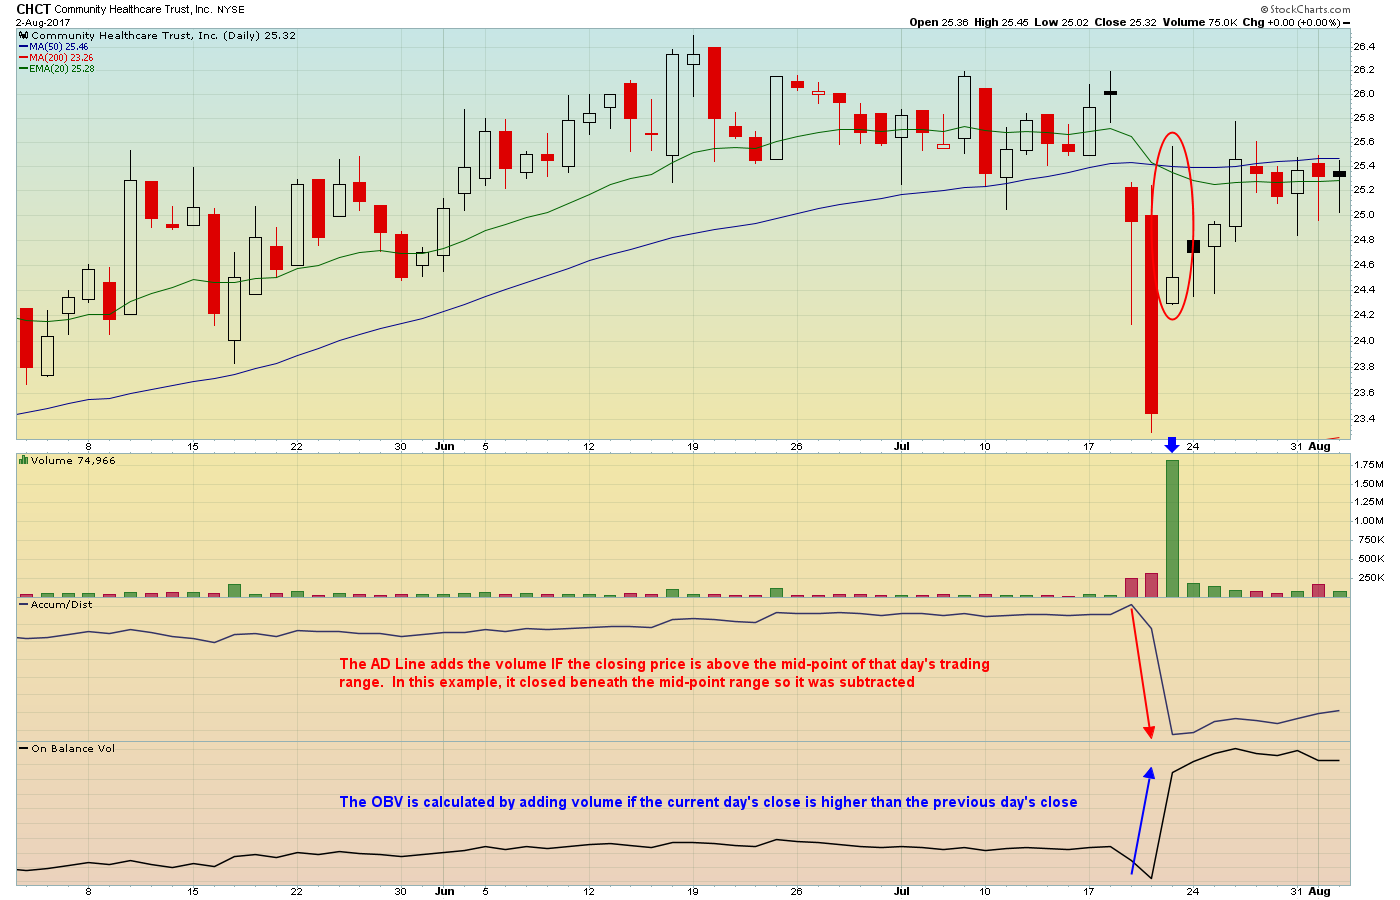 Each of these indicators has its own formula and neither is better than the other. Tom said he personally considers these as secondary indicators and uses them to confirm primary indicators like price and volume.
Looking Ahead
Friday will be interesting as we'll get the latest government nonfarm payroll numbers before the market opens. Tom and Greg will evaluate the jobs number and see how both the bond and stock markets reacted. Is the economy strengthening as the Fed suggests? Or will there be a disappointment on Friday? Stay tuned and.....
Happy trading!
